

0 引言
极端降水的时空分布具有显著的局域性(Zhao et al.,2020;Zeng et al.,2023),常导致泥石流、山洪、滑坡等灾害性天气发生,给人类社会和经济带来灾难性影响(李银娥等,2019;Nie and Sun,2021;Jiang et al.,2024)。全球变暖导致大气水汽增加、强降水事件频发且强度显著增强(周雅蔓等,2021;Sun et al.,2021;姚彦伶等,2023;Yu et al.,2025),深入揭示极端降水的生成发展机制、有效提升预测精度与风险评估能力,对生态保护、水资源管理和灾害防御具有重要科学价值和现实意义(Zhao et al.,2020;Tang et al.,2021)。
研究表明,极端降水受大气环流、温湿条件及局地地形等多因素共同作用(Chen et al.,2021;Xu et al.,2023;Zeng et al.,2023;Chen et al.,2024;马琼等,2025)。高空槽、西太平洋副热带高压(简称副高)、低涡切变等天气系统相互作用,可为极端降水的发生提供必要的动力抬升和水汽输送条件;受天气系统配置差异影响,极端降水空间分布呈现显著的区域性差异(Luo et al.,2016;王丛梅等,2017;Zeng et al.,2023;Xu et al.,2023)。同时,地形也起到重要调控作用(Chen et al.,2024),特殊地形阻挡与强迫抬升效应叠加不同天气系统影响,进一步改变降水范围、强降水落区及其中心位置(杨侃等,2020)。
秦岭及其周边地区因独特的地理位置和气候特征,降水呈显著差异(张宏芳等,2015;潘留杰等,2018;位晶和段克勤,2018;张宏芳等,2020)。近年来,围绕秦岭及周边地区极端降水的研究不断增多,相关成果主要集中于极端降水的时空变化特征(Jiang et al.,2023;Xiang et al.,2023;Li et al.,2024)、环流背景及其气候变化响应(Shao et al.,2019;Wang et al.,2021;Deng et al.,2022;Liao et al.,2025)等方面。研究表明,秦岭—汉江流域—四川盆地这一带的极端降水在空间分布上存在明显差异,副高、东亚夏季风和高空急流等系统的位置、强度及配置差异,以及与秦岭及其周边复杂地形的相互耦合作用,是导致极端降水在秦岭及其周边地区呈现空间差异的重要原因(殷田园等,2019;Li et al.,2021;Deng et al.,2022;Liao et al.,2025)。
上述成果为探究秦岭及周边区域极端降水提供了重要基础,但总体上仍偏重于变化特征和影响因子的描述与解释,针对极端降水的环流系统分型工作较为欠缺。不同区域影响极端降水的环流是否具有可重复识别的主导型?哪些特定环流—水汽—地形配置构成了极端降水的主要条件?这些环流型在秦岭南北是否存在空间差异?上述问题尚未得到充分解决。基于此,本文利用地面气象站降水数据和ERA5再分析资料,采用谱聚类客观分析方法,探讨秦岭及周边地区夏季区域极端降水主要环流特征,进一步加深对该地区极端降水天气发生机理的认识。
1 资料与方法
所用资料包括:1)国家气象信息中心提供的数据完整度在90%及以上的663个地面气象站逐小时降水数据,时段为2008—2025年6—8月,对降水数据的质控包括界限值检查和时空一致性检验(张乐坚等,2016);2)同期欧洲中期天气预报中心第五代再分析资料(ERA5),空间分辨率为0.25°×0.25°,所用物理量参数包括对流有效位能(Convective Available Potential Energy,CAPE)、对流抑制能量(Convective Inhibition,CIN)和大气可降水量(Precipitable Water Vapor,PWV)等。
秦岭及周边地区(29°N—40°N,101°E—115°E)以34°N为界将其划分为秦岭北部和秦岭南部两个研究区域(张宏芳等,2020)(图1)。参考Yu等(2025)的研究方法定义区域小时极端降水事件(Regional Hourly Extreme Precipitation, RHEP):1)基于研究区2008—2025年夏季逐小时降水量(≥0.1 mm),采用95%分位数法确定各站点小时极端降水阈值;2)统计区域内逐小时出现极端降水的站点数,并按升序排列,再采用95%分位数法定义RHEP数量阈值。2008—2025年夏季秦岭北部和南部分别共检测到752 h和928 h的RHEP,分别占夏季总小时数的1.9%和2.3%。
图1
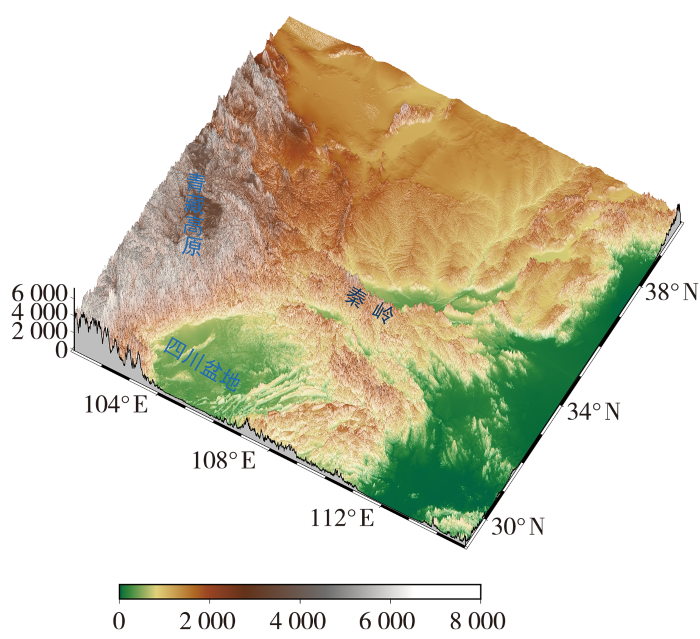
图1
秦岭及周边地区地形高度(单位:m)
Fig.1
Topographical height of the Qinling Mountains and surrounding regions(Unit: m)
谱聚类(Spectral Clustering)是一种适用于高维空间数据聚类的常用方法(Rouhi et al.,2024),本文利用该方法对秦岭北部和南部夏季RHEP的环流型进行分类,综合考虑CH(Calinski Harabasz)评分与物理条件确定聚类数量。对RHEP发生时秦岭北部和南部850、700、500和200 hPa风场进行聚类分析,秦岭北部和南部聚类数分别为3和5的CH评分最高[图2(a)、(b)];选取占各区域RHEP比例10%及以上的类别,秦岭北部和南部区域分别为2类(命名为北部1和2类)和3类(命名为南部1、2和3类),秦岭北部和南部区域比例最高类别分别占总RHEP的85.8%和54.5%(图略),这种分布极不平衡。在天气系统配置、中高层冷空气的强度和入侵路径等不同条件下,强降水的地理位置不同(杨晓霞等,2013),因此对两个区域比例最高的类别(北部和南部1类)进行细分,对其中的温度场数据进行Spectral Clustering分析,表明划分为两个类别更为合理(北部1-1和1-2类,南部1-1和1-2类)[图2(c)、(d)]。基于上述方法,秦岭北部区域划分为3类,北部1-1、1-2和2类,分别命名为N1、N2和N3;秦岭南部区域划分为4类,南部1-1、1-2、2和3类,分别命名为S1、S2、S3和S4。
图2
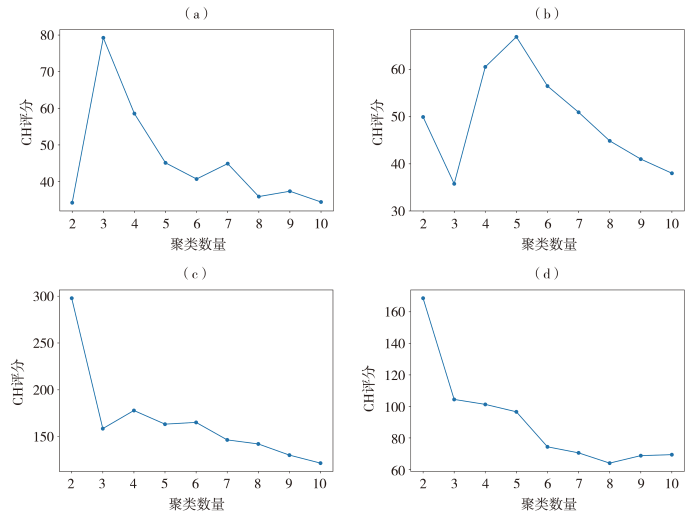
图2
基于谱聚类算法分析秦岭北部(a、c)与南部(b、d)风场(a、b)和温度场(c、d)不同聚类数量的CH评分
Fig. 2
The analysis of CH scores of different cluster numbers of wind fields (a, b) and temperature fields (c, d) in the study areas north (a, c) and south (b, d) of the Qinling Mountains based on the Spectral Clustering algorithm
2 结果分析
2.1 环流特征分析
秦岭北部区域N1型环流在夏季每月均有发生,N2型主要发生在7月和8月,N3型仅出现在7月,3种类型发生频率峰值均出现在7月。秦岭南部区域S1、S2、S3、S4型环流每月均有发生,S1和S3型的频率峰值出现在7月,S2和S4型的频率峰值分别出现在6月和8月(图3)。
图3
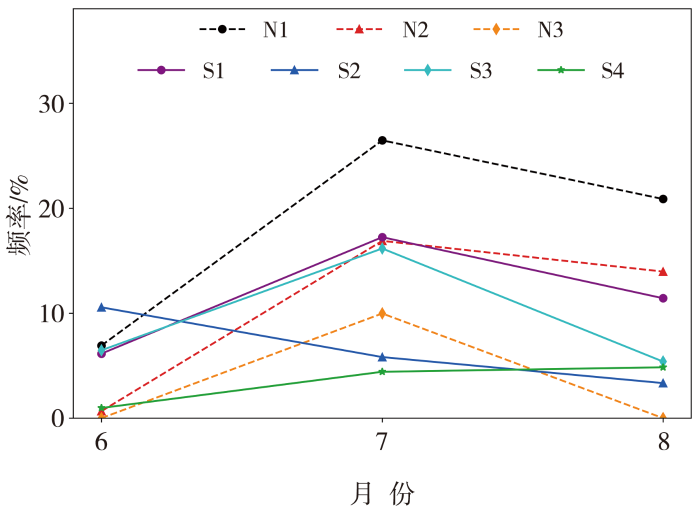
图3
2008—2025年6—8月秦岭北部和南部区域RHEP的不同环流类型发生频率
Fig.3
Frequency of different RHEP circulation patterns in the study areas north and south of the Qinling Mountains during June-August, 2008-2025
影响秦岭北部RHEP N1型环流的主要特征是200 hPa南亚高压(以1 252 dagpm等值线作为其识别阈值)中心强度大于1 252 dagpm,辐散中心位于南亚高压以北研究区域的东部[图4(a)],高空辐散有利于低层系统的发展和上升运动增强(张霞等,2021)。500 hPa副高位置偏东,中纬度地区甘肃东部至山西一带存在低压槽,槽后西北气流与等温线交角较大,南下冷空气与槽前西南暖湿气流交汇,RHEP高频区主要位于槽前西南气流区[图4(d)]。700 hPa沿副高外围从广西至陕西由偏南气流逐渐转为西南气流,甘肃附近沿青藏高原东北侧南下的偏北气流与西南气流在陕西附近形成切变,有利于上升运动的发展和水汽的聚集,近地面至500 hPa垂直积分水汽通量散度在切变前方表现为明显的负值区[图4(g)]。850 hPa从广东沿海至山西附近为较一致的偏南气流,陕西中北部存在切变[图4(j)]。中低层低压槽切变前部暖湿气流汇聚区与200 hPa辐散区对应较好,切变造成的辐合运动会进一步加强高空辐散区附近的上升运动,导致RHEP主要分布在秦岭北部的中东部地区。
图4
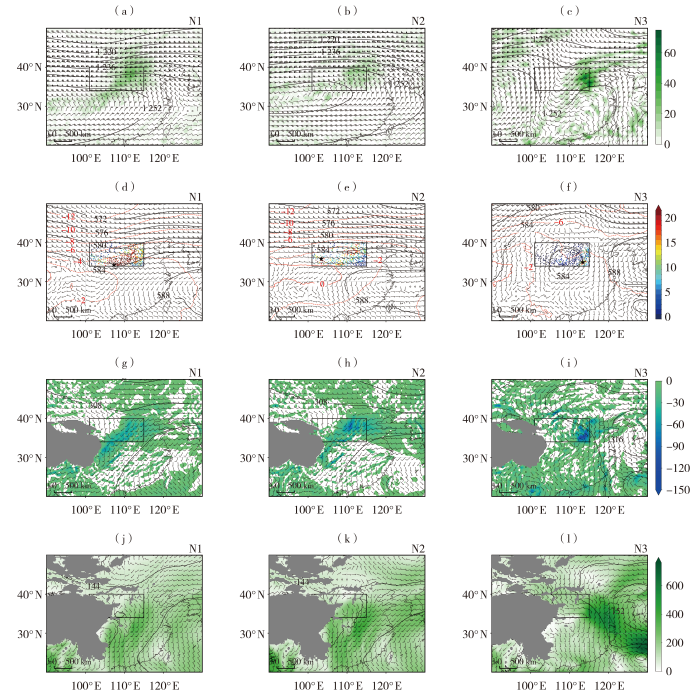
图4
秦岭北部3类RHEP环流型200 hPa位势高度场(等值线,单位:dagpm)、散度场(填色,单位:10-6 s-1)和风场(风矢,单位:m·s-1)(a、b、c),500 hPa位势高度场(黑色等值线,单位:dagpm)、温度场(红色等值线,单位:℃)、风场(风矢,单位:m·s-1)和RHEP发生频次空间分布(彩色圆点,单位:次)(d、e、f),700 hPa位势高度场(等值线,单位:dagpm)、近地面至500 hPa垂直积分水汽通量散度(填色,单位:10-5 kg·m-2·s-1)和风场(风矢,单位:m·s-1)(g、h、i),850 hPa位势高度场(等值线,单位:dagpm)、近地面至500 hPa垂直积分水汽通量(填色,单位:kg·m-1·s-1)和风场(风矢,单位:m·s-1)(j、k、l)
(★为RHEP发生频次最大值位置,灰色阴影为地形,黑色框为秦岭北部边界)
Fig.4
Synoptic patterns of three RHEP circulation types in the study area north of the Qinling Mountains: 200 hPa geopotential height field (contours, Unit: dagpm), divergence field (the color shaded, Unit: 10-6 s-1) and wind field (vectors, Unit: m·s-1) (a、b、c); 500 hPa geopotential height field (black contours, Unit: dagpm), temperature field (red isolines, Unit: ℃), and wind field (vectors, Unit: m·s-1), along with spatial distribution of the RHEP occurrence frequency (colour dots, Unit: times) (d、e、f); 700 hPa geopotential height field (contours, Unit: dagpm), vertically integrated water vapor flux divergence from the near-surface to 500 hPa (the color shaded, Unit: 10-5 kg·m-2·s-1), and wind field (vectors, Unit: m·s-1) (g、h、i); 850 hPa geopotential height field (contours, Unit: dagpm), vertically integrated water vapor flux from the near-surface to 500 hPa (the color shaded, Unit: kg·m-1·s-1), and wind field (vectors, Unit: m·s-1) (j、k、l)
(★ denotes the location with the highest frequency of RHEP occurrence, the gray shaded denotes topography, the black frame denotes the boundary of the study area north of the Qinling Mountains)
N3型环流200 hPa高空图显示研究区域的东部处在南亚高压边缘的分流辐散区[图4(c)]。副高是影响水汽输送的重要因素(方浩和乔云亭,2019),500 hPa副高位置偏北,使得水汽输送通道也偏北;从浙江至山西为较一致的东南气流,有利于引导暖湿气流向西北输送;研究区上空为气旋式环流,RHEP主要发生在气旋式环流的东侧[图4(f)]。700 hPa从浙江至陕西为较一致的东南气流,近地面至500 hPa垂直积分水汽通量散度的负值区集中分布于山西南部至河南北部[图4(i)]。850 hPa浙江至河北南部存在与东南气流相伴的水汽通道,水汽输送带前方的河北南部至河南北部存在风速辐合区,有利于上升运动发展和水汽聚集[图4(l)]。
在秦岭南部区域,S1型环流200 hPa南亚高压中心强度大于1 260 dagpm,研究区上空为分流型辐散风场,西南部辐散较强[图5(a)]。500 hPa内蒙古附近存在低压槽,槽后温度槽中心低于-12 ℃,副高脊点西伸到117°E,槽后部偏北气流与副高外围西南气流在研究区西部形成切变,该位置也是RHEP发生的高频区[图5(e)]。700 hPa内蒙古西部存在准南北向低压槽,副高外围广西至河南一带维持一致西南气流,低压槽后部沿青藏高原东侧南下的偏北气流与西南气流在四川东部形成切变,切变线附近近地面至500 hPa垂直积分水汽通量散度的负值中心较强[图5(i)]。850 hPa四川东部也存在切变,副高外围从广西至湖北由偏南气流逐渐转为西南气流,向北输送暖湿气流[图5(m)]。
图5
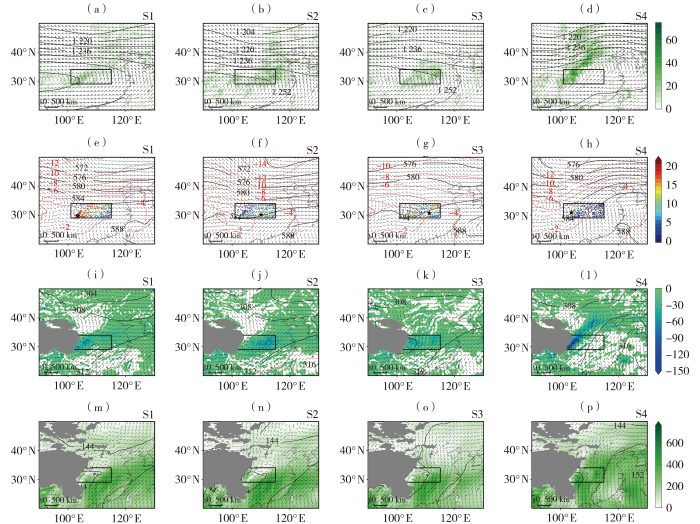
图5
秦岭南部4类RHEP环流型200 hPa位势高度场(等值线,单位:dagpm)、散度(填色,单位:10-6 s-1)和风场(风矢,单位:m·s-1)(a、b、c、d),500 hPa位势高度场(黑色等值线,单位:dagpm)、温度场(红色等值线,单位:℃)、风场(风矢,单位:m·s-1)和RHEP发生频次空间分布(彩色圆点,单位:次)(e、f、g、h),700 hPa位势高度场(等值线,单位:dagpm)、近地面至500 hPa垂直积分水汽通量散度(填色,单位:10-5 kg·m-2·s-1)和风场(风矢,单位:m·s-1)(i、j、k、l),850 hPa位势高度场(等值线,单位:dagpm)、近地面至500 hPa垂直积分水汽通量(填色,单位:kg·m-1·s-1)和风场(风矢,单位:m·s-1)(m、n、o、p)
(★为RHEP发生频次最大值位置,灰色阴影为地形,黑色框为秦岭南部边界)
Fig.5
Synoptic patterns of four RHEP circulation types in the study area south of the Qinling Mountains: 200 hPa geopotential height field (contours, Unit: dagpm), divergence field (the color shaded, Unit: 10-6 s-1) and wind field (vectors, Unit: m·s-1) (a、b、c、d); 500 hPa geopotential height field (black contours, Unit: dagpm), temperature field (red isolines, Unit: ℃), and wind field (vectors, Unit: m·s-1), along with spatial distribution of the RHEP frequency (colour dots, Unit: times) (e、f、g、h); 700 hPa geopotential height field (contours, Unit: dagpm), vertically integrated water vapor flux divergence from the near-surface to 500 hPa (the color shaded, Unit: 10-5 kg·m-2·s-1), and wind field (vectors, Unit: m·s-1) (i、j、k、l); 850 hPa geopotential height field (contours, Unit: dagpm), vertically integrated water vapor flux from the near-surface to 500 hPa (the color shaded, Unit: kg·m-1·s-1), and wind field (vectors, Unit: m·s-1) (m、n、o、p)
(★ denotes the location with the highest frequency of RHEP occurrence, the gray shaded denotes topography, the black frame denotes the boundary of the study area south of the Qinling Mountains)
S2型200 hPa南亚高压位置偏南,南亚高压东北侧边缘附近风场为分流型辐散场,研究区东部辐散较强[图5(b)]。S2型500 hPa环流形势与S1型相似,但内蒙古附近低压槽更深厚,其附近的温度槽中心低于-14 ℃,此类环流型有利于槽后冷空气向降水区输送;而内蒙古冷槽后冷空气扩散南下,有利于研究区内低压槽的维持[图5(f)]。700 hPa内蒙古西部低压槽呈东北—西南向;与S1型相比,此类RHEP发生时四川东部也存在切变,但切变东侧沿副高外围的偏南气流更强,近地面至500 hPa垂直积分水汽通量散度较低的负值区主要位于切变东侧的偏南气流区[图5(j)]。850 hPa从广西至湖北为一致的西南气流水汽输送带[图5(n)]。
S4型200 hPa南亚高压位置偏北偏西,研究区西部为辐散高值区[图5(d)]。500 hPa内蒙古西部以北至四川北部受低压槽影响,副高北界位于37°N附近,与其西侧的低值系统相互对峙,形成“东高西低”的环流形势[图5(h)],副高西侧的暖湿气流与槽后干冷空气在研究区西部汇合,有利于降水发生(陈蕾等,2018)。700 hPa沿副高外围的偏南气流与沿青藏高原东侧南下的偏北气流形成切变,研究区西部近地面至500 hPa垂直积分水汽通量散度小于-150×10-5 kg·m-2·s-1,为明显水汽辐合区[图5(l)]。850 hPa从广西至四川东部为较一致的偏南气流[图5(p)]。S4型水汽辐合和水汽输送的大值中心均位于青藏高原东侧,高值水汽输送在山前迎风坡一带汇集,为RHEP提供了充沛的水汽供应。
综上所述,秦岭北部3类环流型和秦岭南部4类环流型上空200 hPa均受南亚高压边缘附近分流型辐散场影响。秦岭北部N1型和秦岭南部S1、S2、S4型,500 hPa温度槽落后于高度槽,温度槽与高度槽后部西北气流形成明显的交角,且中低层低压槽切变后部西北气流与副高外围偏南气流对峙,阻挡高原南下冷空气,促使暖湿气流抬升。影响秦岭北部N1型和秦岭南部S2型的低压槽呈东北—西南向,RHEP主要分布于低压槽切变前侧;影响秦岭南部S1和S4型的低压槽呈准南北向,RHEP集中分布于低压槽切变底部。秦岭北部N2型和秦岭南部S3型500 hPa中高纬以偏西气流为主,冷平流较弱,RHEP高频区分布于低压槽切变的底部气流辐合区和前部偏南气流风速辐合区。秦岭北部N3型,副高位置明显偏北,RHEP高频区集中分布于水汽输送高值带前方的风速辐合区。
2.2 位势高度和风场异常
秦岭北部和南部的各环流型在200 hPa南亚高压控制区域位势高度均为正距平,在500 hPa副高影响区域位势高度均为正距平,其中N3和S4副高影响区域的位势高度正距平较大,副高位置偏西偏北,且副高外围有显著的异常东南气流,有利于引导水汽向西北输送(图略)。
图6
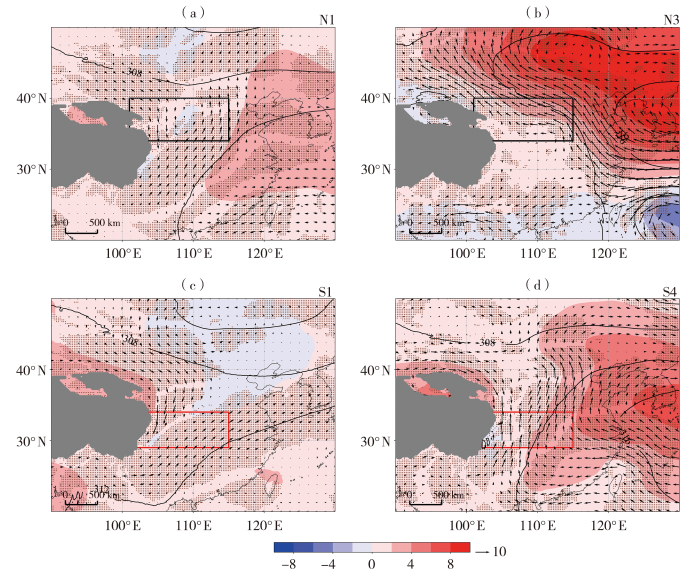
图6
秦岭北部N1(a)、N3(b)RHEP环流型和秦岭南部S1(c)、S4(d)RHEP环流型700 hPa位势高度(等值线,单位:dagpm)、位势高度距平(填色,单位:dagpm)和风场距平(箭矢,单位:m·s-1)
(打点区表示通过置信水平为95%的显著性检验,黑色和红色方框分别表示秦岭北部和南部边界)
Fig.6
The 700 hPa geopotential height (contours, Unit: dagpm), geopotential height anomalies (the color shaded, Unit: dagpm), and wind field anomalies (vectors, Unit: m·s-1) of the N1 (a) and N3 (b) RHEP circulation patterns in the study area north of the Qinling Mountains as well as the S1 (c) and S4 (d) RHEP circulation patterns in the study area south of the Qinling Mountains
(The dotted areas passed the significance test at the 95% confidence level, the black and red frames denote the boundaries of the study areas north and south of the Qinling Mountains, respectively)
2.3 水汽条件诊断
图7
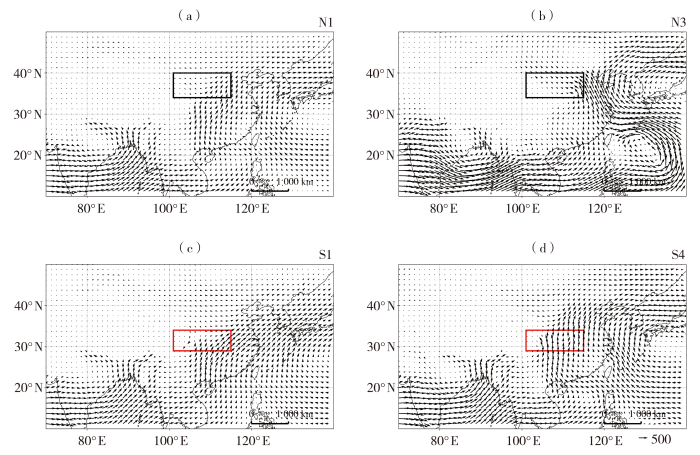
图7
秦岭北部N1(a)、N3(b)RHEP环流型和秦岭南部S1(c)、S4(d)RHEP环流型近地面至300 hPa垂直积分平均水汽通量(矢量,单位:kg·m-1·s-1)
(黑色和红色方框分别表示秦岭北部和南部边界)
Fig.7
Vertically integrated mean water vapor flux from near the surface to 300 hPa (vectors, Unit: kg·m-1·s-1) of the N1 (a) and N3 (b) RHEP circulation patterns in the study area north of the Qinling Mountains as well as the S1 (c) and S4 (d) RHEP circulation patterns in the study area south of the Qinling Mountains
(The black and red frames denote the boundaries of the study areas north and south of the Qinling Mountains, respectively)
计算各边界的水汽收支(各边界正值为输出,负值为输入),分析近地面至700 hPa(对流层低层)、700~500 hPa(对流层中层)、500~300 hPa(对流层高层)的水汽收支特征。由表1可知,总体上,对流层中低层水汽输入更多;秦岭北部N1和N2型对流层低层和中层南边界水汽输入最大,其中N2型水汽输入值更高;N3型对流层中低层东边界和南边界水汽输入较多,东边界低层水汽输入值更大。秦岭南部4类环流型对流层低层和中层南边界水汽输入更大,其中S4型水汽输入值更高;秦岭南部4类环流型对流层低层南边界水汽输入值明显高于秦岭北部3类环流型。
表1 秦岭北部和南部边界不同RHEP环流型水汽收支情况
Tab.1
| 环流型 | 东边界 | 南边界 | 西边界 | 北边界 | ||||||||
|---|---|---|---|---|---|---|---|---|---|---|---|---|
| 低层 | 中层 | 高层 | 低层 | 中层 | 高层 | 低层 | 中层 | 高层 | 低层 | 中层 | 高层 | |
| N1 | 1.52 | 20.72 | 11.83 | -50.28 | -24.05 | -3.96 | -1.27 | -8.54 | -8.74 | 1.35 | -2.52 | 4.72 |
| N2 | 15.10 | 28.65 | 13.27 | -79.15 | -34.14 | -0.80 | -0.84 | -5.10 | -12.62 | -6.89 | -4.60 | 2.20 |
| N3 | -73.05 | -15.97 | 1.54 | -35.22 | -16.29 | -2.68 | 4.70 | 3.97 | -0.24 | 52.07 | 13.24 | 0.97 |
| S1 | 46.35 | 25.62 | 6.09 | -111.89 | -39.13 | 0.07 | 0 | 0.97 | -4.21 | -8.33 | -5.07 | -0.16 |
| S2 | 24.59 | 27.71 | 11.23 | -93.72 | -38.77 | -0.74 | 0 | -0.04 | -7.86 | -11.16 | -10.34 | 1.25 |
| S3 | 10.17 | 18.98 | 5.73 | -120.75 | -46.59 | 0.34 | 0 | -2.39 | -4.11 | 26.23 | 13.43 | 0.06 |
| S4 | 8.60 | 1.40 | -0.59 | -146.4 | -59.12 | -2.55 | 0 | -1.64 | -4.99 | 64.02 | 49.86 | 13.26 |
2.4 RHEP的物理量特征
秦岭北部区域,N1型RHEP高频中心位于青藏高原东侧的秦岭北坡,中低层偏北气流携带冷空气沿青藏高原东缘下滑,与偏南气流在RHEP高频中心附近中低层形成低压槽切变,从中层至低层呈后倾结构,低层冷平流楔入暖平流之下,107°E附近上升运动负值中心小于-0.4 Pa·s-1[图8(a)],冷空气从底层楔入不但与暖湿气流汇合产生辐合上升,且抬升暖湿气流使上升运动加强(杨晓霞等,2010)。秦岭以北受偏北气流影响,秦岭附近存在中心小于-1.5×10⁻⁵ s-1的辐合区,560 hPa至近地面相对湿度大于80%[图8(d)],秦岭以北RHEP高频中心附近最大地形强迫垂直速度[具体计算公式参考徐燚等(2019)文献]小于-0.1 Pa·s-1[图9(b)],低层切变和地形抬升均有利于上升运动发展和暖湿气流向上输送。
图8
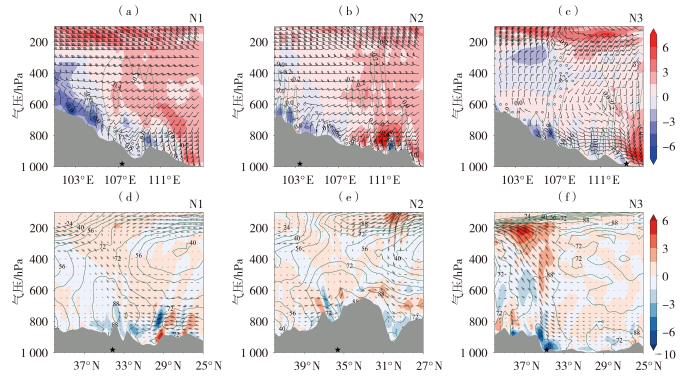
图8
秦岭北部3类RHEP环流型风场(风矢,单位:m·s-1)、温度平流(填色,单位:10-5 ℃·s-1)和垂直速度(绿色虚线,单位:Pa·s-1)沿RHEP发生频次最大值位置的经度-高度剖面(a、b、c),经向风-垂直速度合成(垂直速度扩大了100倍,矢量,单位:m·s-1)、散度(填色,单位:10-5 s-1)与相对湿度(绿色等值线,单位:%)沿RHEP发生频次最大值位置的纬度-高度剖面(d、e、f)
(★为各类环流型RHEP发生频次最大值位置,灰色阴影为地形)
Fig.8
Longitude-height cross-sections (a, b, c) of the wind field (vectors, Unit: m·s-1), temperature advection (the color shaded, Unit: 10-5 ℃·s-1), and vertical velocity (green dashed lines, Unit: Pa·s-1), and latitude-height cross-sections (d, e, f) of the synthesis of meridional wind-vertical velocity (the vertical velocity is magnified by 100 times, vectors, Unit: m·s-1), divergence (the color shaded, Unit: 10-5 s-1), and relative humidity (green isolines, Unit: %) along the location of the maximum RHEP occurrence frequency of the three RHEP circulation types over the study area north of the Qinling Mountains
(★ indicates the location of the maximum RHEP occurrence frequency for each circulation pattern, the gray shaded represents terrain)
图9
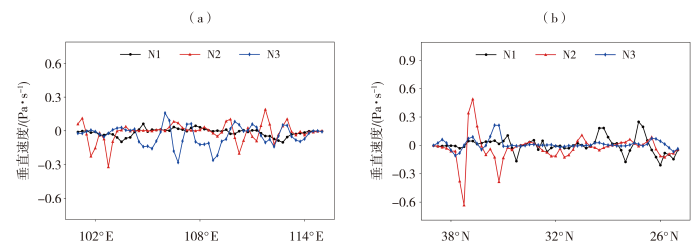
图9
秦岭北部3类RHEP环流型RHEP发生频次最大值位置的地形强迫垂直速度沿经度(a)和纬度(b)的变化
Fig. 9
The variation of terrain-forced vertical velocity along longitude (a) and latitude (b) at the locations with maximum RHEP occurrence frequency of the three RHEP circulation patterns over the study area north of the Qinling Mountains
秦岭南部区域,S1型RHEP高频中心位于青藏高原东侧的四川盆地西部,500 hPa以下的低压槽切变也呈后倾结构,低层沿青藏高原东侧山脉至山底为冷平流,其上为暖平流,山前冷空气楔入暖湿空气底部,有利于暖湿空气被迫抬升;RHEP高频中心附近上空形成中心小于-0.8 Pa·s-1的上升运动区[图10(a)];30°N盆地附近低层为强中心小于-4.5×10⁻⁵ s-1的辐合区,可能与盆地地形有利于进入地形区内的偏南气流辐合增强有关,500 hPa以下相对湿度大于80%[图10(e)];沿经度和纬度RHEP高频中心附近最大地形强迫垂直速度分别小于-0.3 Pa·s-1和-0.1 Pa·s-1[图11(a)、(b)]。
图10
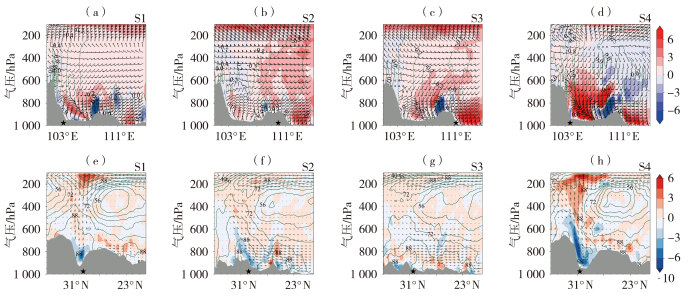
图10
秦岭南部4类RHEP环流型风场(风矢,单位:m·s-1)、温度平流(填色,单位:10-5 ℃·s-1)和垂直速度(绿色虚线,单位:Pa·s-1)沿RHEP发生频次最大值位置的经度-高度剖面(a、b、c、d),经向风-垂直速度合成(垂直速度扩大了100倍,矢量,单位:m·s-1)、散度(填色,单位:10-5 s-1)与相对湿度(绿色等值线,单位:%)沿RHEP发生频次最大值位置的纬度-高度剖面(e、f、g、h)
(★为各类环流型RHEP发生频次最大值位置,灰色阴影为地形)
Fig.10
Longitude-height cross-sections (a, b, c, d) of the wind field (vectors, Unit: m·s-1), temperature advection (the color shaded, Unit: 10-5 ℃·s-1), and vertical velocity (green dashed lines, Unit: Pa·s-1), and latitude-height cross-sections (e, f, g, h) of the synthesis of meridional wind-vertical velocity (the vertical velocity is magnified by 100 times, vectors, Unit: m·s-1), divergence (the color shaded, Unit: 10-5 s-1), and relative humidity (green isolines, Unit: %) along the location of the maximum RHEP occurrence frequency of the four RHEP circulation types over the study area south of the Qinling Mountains
(★ indicates the location of the maximum RHEP occurrence frequency for each circulation pattern, the gray shaded represents terrain)
图11
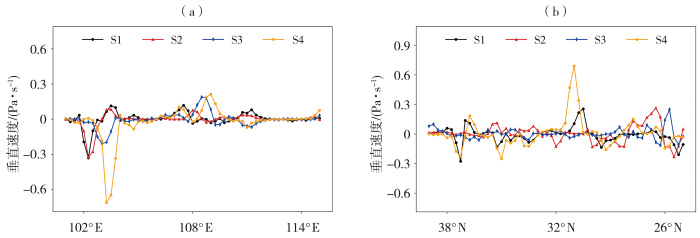
图11
秦岭南部4类RHEP环流型RHEP发生频次最大值位置的地形强迫垂直速度沿经度(a)和纬度(b)的变化
Fig. 11
The variation of terrain-forced vertical velocity along longitude (a) and latitude (b) at the locations with maximum RHEP occurrence frequency of the four RHEP circulation patterns over the study area south of the Qinling Mountains
合成T-ln P分析显示秦岭北部N1型400 hPa以下为近V型结构,CAPE值为461.19 J·kg-1,能量条件相对较好[图12(a)];与N1型相比,N2型对流层中层温度露点差更小,可降水量更大(图略);N3型整层露点温度与温度接近,大气趋于饱和[图12(b)]。秦岭南部S1型整层温度露点差较小,可降水量相对较大(图略);S2型400 hPa以下为近V型结构,可降水量相对较低[图12(c)];S3与S2型相似(图略);S4型为整层高湿结构,可降水量较高[图12(d)]。各环流型CIN值均较低,表明较弱强迫抬升可使气块达到自由对流高度(郑永光等,2017);K指数均大于37 ℃,大气明显不稳定(仇娟娟和何立富,2013)。
图12
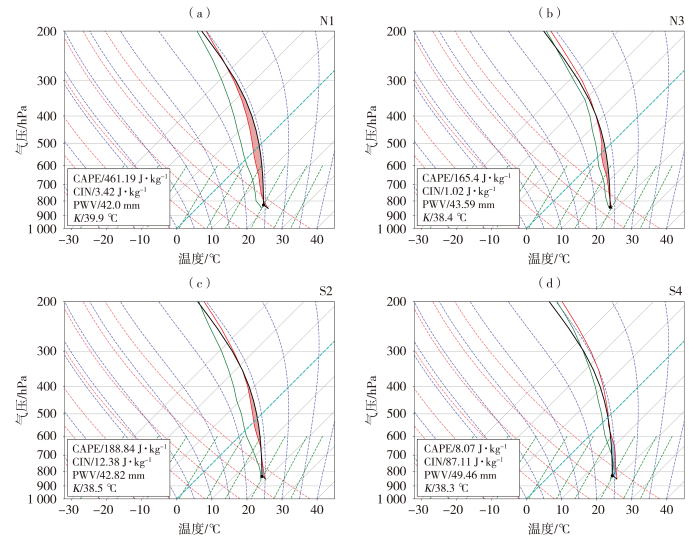
图12
秦岭北部N1(a)、N3(b)和秦岭南部S2(c)、S4(d)RHEP环流型合成T-ln P图
(红色曲线为环境温度,绿色曲线为环境露点温度,黑色曲线为气块温度,黑色圆点为抬升凝结高度)
Fig.12
Composite T-ln P diagram of RHEP circulation patterns N1 (a) and N3 (b) over the study area north of the Qinling Mountains, as well as S2 (c) and S4 (d) over the study area south of the Qinling Mountains
(The red curve is environmental temperature, the green curve is environmental dew point temperature, the black curve is parcel temperature, the black dot is lifting condensation level)
3 结论
基于秦岭及周边地区2008—2025年6—8月逐小时降水数据和ERA5再分析资料,研究该区域夏季RHEP的典型环流型,秦岭北部主导环流型为N1、N2、N3三类,秦岭南部为S1、S2、S3、S4四类,进一步分析各环流型的环流特征、水汽输送特征和热力动力条件,主要得到以下结论。
1)秦岭北部3类和秦岭南部4类RHEP环流型的环流特征表现为200 hPa存在分流型辐散场,中低层存在短波槽、切变线或风速辐合。副高外围气流向秦岭及周边输送充沛水汽,并在极端降水区形成明显辐合。秦岭山地及其周边复杂地形通过阻挡、抬升和辐合效应,促进低层暖湿气流爬坡上升,并与中低层切变和风速辐合叠加,增强垂直运动,是造成RHEP频发的重要原因。
2)秦岭北部3类和秦岭南部4类RHEP环流型对流层中低层副高影响区域表现为大范围位势高度异常偏高,且对流层低层副高外围为西南、偏南或东南风异常,其中N1、N2、S1、S2和S4青藏高原东北侧均存在异常偏北风,有利于北方南下的冷空气与副高外围暖湿气流交汇,从而产生RHEP。
3)水汽条件是区域极端降水发生的关键前提。秦岭北部和南部区域,除N3型是对流层低层东边界水汽输入更强,其他环流型普遍表现为对流层中低层南边界水汽输入强。阿拉伯海、孟加拉湾、南海、西太平洋及东海等共同构成主要水汽源区,多源水汽汇合后向秦岭周边地区输送,为RHEP提供了充沛的水汽供应。
4)各类环流型RHEP高频中心普遍具有较高K指数、较低CIN和较充足的可降水量,表明大气明显不稳定、湿度条件良好,较弱的抬升机制即可触发对流发展。
本文重点分析了环流特征,N1和S1型分别为秦岭北部和南部区域比例最高环流型,青藏高原东侧秦岭北坡为N1环流型RHEP高频中心,青藏高原东侧四川盆地西部为S1环流型RHEP高频中心,区域极端降水在此类环流型天气预报中,建议重点关注。由于缺乏长时间序列逐小时地面观测数据,目前仅能对2008年以来数据进行分析,后续可应用多源融合降水产品、高密度区域站降水等资料继续开展验证。同时,地形强迫垂直速度为线性地形抬升近似,适用于大尺度稳定降水,在强对流、非线性地形作用明显的情况下可能低估实际抬升,后续可利用高分辨率模式(如WRF)进行有无秦岭地形的对比数值模拟试验。关于秦岭周边极端降水的中小尺度特征、不同环流型如何协同中小尺度系统共同形成极端降水、地形复杂的热力和动力效应与降水微物理过程相互作用机理仍有待继续深入研究。
参考文献
基于卫星资料的秦岭南北云系及其垂直结构特征
[J].
利用2007-2010年CloudSat/CALIPSO联合产品2B-CLDCLASS-LIDAR资料对关中、秦岭和陕南云出现概率及云垂直结构特征进行了研究。结果表明,各地区四季均以云天为主,云出现概率从南到北逐渐减少,但云出现概率最高的月份北部要早于南部。秦岭南北云层高度的季节变化单层云中关中地区最为显著,多层云则是陕南地区。云厚季节变化不明显,均在1~3 km之间。除少数情况外,8大云类在各地区不同云层中的出现概率具有显著的季节变化。除Ns(雨层云)在三层云下层及Dc(深对流云)在各层云中云顶和云厚存在明显的区域差异外,所有云类的云底云顶高度及平均厚度在不同云层的出现概率均没有明显的季节变化和区域差异。
青藏高原中东部极端降水的时空变化特征
[J].伴随全球气候变暖,极端降水事件明显增多,造成的灾害损失日益增加。青藏高原作为全球气候变化敏感区域,开展该区域极端降水事件时空变化特征研究有助于提升高原气候预测和防灾减灾能力。利用1961—2017年青藏高原中东部68个气象站逐日降水观测数据,通过百分位阈值法和线性倾向估计法,结合极端降水指数,分析该区域极端降水时空分布及变化趋势,探讨不同等级降水对总降水量的贡献。结果表明:青藏高原中东部地区各极端降水指数总体均由东南向西北递减,东南部是总降水和极端降水高值区,但该区域对整体降水量增加的影响较小。近57 a来,各极端降水指数整体均呈增加趋势,总降水量及其强度、强降水量、1日最大降水量和连续5 d最大降水量增加趋势显著,强降水量气候倾向率大于特强降水量,且强降水量占比明显增大,而特强降水量占比略有减小,表明强降水量增加对总降水量的贡献更大。强降水量和强降水、中雨日数与总降水量及其强度的变化趋势空间分布基本一致,区域东北部为显著增加区,中雨、强降水日数及雨量的增加导致高原中东部总降水量和极端降水量增加。
秦岭及周边地区暖季降水日变化及其成因分析
[J].利用三源降水融合资料和欧洲中期数值预报中心ERA5逐小时再分析数据, 分析暖季秦岭及周边地区的降水日变化特征及可能的成因。研究表明: 暖季秦岭南北降水日变化存在显著差异, 秦岭南部降水日峰值主要是盆地地形影响下的夜雨, 秦岭北部降水日峰值则是午后黄土高原上的昼雨。青藏高原东部延伸区、 黄土高原等大地形对研究区域长、 短时降水的空间分布贡献显著; 秦岭南部短时降水频率高, 但L3级降水强度相对较低, 北部L3级降水频率低、 强度大。盆地地形作用下夜间的山风与青藏高原南侧地形槽前定常西南暖湿上升气流叠加, 800 hPa以上上升运动异常加强, 形成多个铅直次级环流, 是秦岭南部夜雨特别显著的重要原因; 而白天受谷风的作用, 使得地形槽前上升气流减弱, 昼雨相对较少。午后热力作用加强, 南风上升气流与中上层西北风下沉气流在700 hPa附近交汇, 使得秦岭北部黄土高原午后强降水异常多发。
Detectable intensification of hourly and daily scale precipitation extremes across Eastern China
[J].Detecting long-term changes in precipitation extremes over monsoon regions remains challenging due to large observational uncertainty, high internal variability at the regional scale, and climate models’ deficiency in simulating monsoon physics. This is particularly true for Eastern China, as illustrated by limited yet controversial detection results for daily scale precipitation extremes and the lack of detection analysis on hourly scale extremes there. Relying on high-quality gauge observations, two complementary techniques are used to detect the footprint of anthropogenic forcings in observed changes in both hourly and daily scale precipitation extremes across Eastern China. Results show that, scaled with global-mean surface temperature during 1970–2017, the regional-scale intensification nearly doubles the Clausius–Clapeyron rate (C-C; ~6.5% °C−1) for the wettest 10 h in the period and almost triples the C-C rate for the top 10 heaviest daily precipitation extremes. The intensification at both time scales, as well as the resulting increase in frequency, is discernibly stronger and more widespread than expected due to random internal variability. This not only lends supports to the model-based detection of forced trends for daily scale precipitation extremes, but it also suggests that anthropogenic warming has already be intensifying hourly scale precipitation extremes in this monsoon region. The magnitude and detectability of observed changes arise primarily from systematic intensification of non-tropical-cyclone-related precipitation extremes in response to the past warming.
Characteristics of hourly extreme precipitation over the eastern extension of the Tibetan Plateau
[J].The eastern extension of the Tibetan Plateau (EETP) has complex terrain, unique climate characteristics, and significant regional differences. Based on the hourly precipitation data from 444 stations over the EETP, the characteristics of the extreme precipitation event (EPE) diurnal cycle over the EETP and their regional differences during the warm season (May–September) have been indicated and revealed in this study. The mean duration of EPEs at most stations over the EETP is over 6 h, except for some stations in the eastern part of the Tibetan Plateau and Yunnan province. In addition to the Qinba Mountain area, EPEs developed rapidly in most stations. EPEs with long (short) durations usually start at night (afternoon). But in the southwestern part of the Sichuan Basin (eastern part of the Tibetan Plateau), long-duration EPEs and short-duration EPEs often start at night (afternoon to early night). Meanwhile, the long-duration EPEs lead to the nocturnal diurnal peaks and eastward propagating features of extreme precipitation amount (EPA) over the EETP. In the Sichuan Basin (the eastern part of the Tibetan Plateau), the onset and peak moments of total EPEs show a single diurnal peak and appear at midnight (late afternoon to early night). The onset and peak moments of EPEs in the Yunnan–Guizhou Plateau and the Qinba Mountain area exhibit two diurnal peaks, one at midnight and the other from afternoon to early night. Over the EETP, for the long-duration EPEs, the peak moments are often delayed by 2–3 h compared to the start moment, while for the short-duration EPEs, the peak moment and the start moment almost coincide.
Contrasts between the interannual variations of extreme rainfall over western and eastern Sichuan in mid-summer
[J].
40-year statistics of warm-season extreme hourly precipitation over southwest China
[J].Southwest China (SWC) possesses complicated topography with frequent geological activities, where heavy precipitation occurs frequently in warm seasons. Few previous studies on extreme precipitation were carried out at hourly scales. In this study, spatiotemporal variations of the extreme hourly precipitation (EHP) over SWC during the warm season of 1981–2020 and the involved mechanisms are investigated. Results show that the threshold and intensity of EHP present similar spatial distribution—lower (higher) in the west (east) part of SWC, while the EHP frequency is opposite. The long-term trend of EHP amount shows a more significant positive tendency than that of hourly precipitation (HP) amount due to synchronous increases in intensity and frequency. The significant increasing trend of EHP occurs in areas above 500-m terrain height, with a weak increasing trend below 500 m (e.g., Chongqing and eastern Sichuan). EHP appears mainly from June to August and exhibits a bimodal distribution in diurnal variation. The mechanism analysis demonstrates that occurrences of EHP are generally accompanied by positive anomalies of temperature, humidity, and geopotential height. Anomalous cyclonic circulation can also be found in the low-level wind field. The westward and northward extension of the western North Pacific subtropical high (WNPSH) as well as temperature rise may be the primary reason for the increase of EHP. For Chongqing and eastern Sichuan, the anticyclone circulation in low-level and the significantly weakened water vapor flux convergence cause poor moisture and dynamic conditions, inhibiting the growth of EHP.
Weather pattern classification of regional extreme precipitation events and their formation mechanisms in the Yangtze-Huai Region, China
[J].
Variations in extreme precipitation and relation to the Asia summer monsoon over the Qinling-Dabashan Mountains, China
[J].
Statistics of warm-season hourly extreme precipitation in the Sichuan Basin, China during 2002-2021
[J].
Characteristics and causes of July extreme rainfall events in the Sichuan-Chongqing-Shaanxi region, China
[J].
Synoptic situations of extreme hourly precipitation over China
[J].In this study, synoptic situations associated with extreme hourly precipitation over China are investigated using rain gauge data, weather maps, and composite radar reflectivity data. Seasonal variations of hourly precipitation (>0.1 mm h−1) suggest complicated regional features in the occurrence frequency and intensity of rainfall. The 99.9th percentile is thus used as the threshold to define the extreme hourly rainfall for each station. The extreme rainfall is the most intense over the south coastal areas and the North China Plain. About 77% of the extreme rainfall records occur in summer with a peak in July (30.4%) during 1981–2013.
Synoptic-scale circulation precursors of extreme precipitation events over southwest China during the rainy season
[J].
Two-pronged feature reduction in spectral clustering with optimized landmark selection
[J].
Spatiotemporal variations of extreme precipitation events at multi-time scales in the Qinling-Daba mountains region, China
[J].
A global, continental, and regional analysis of changes in extreme precipitation
[J].This paper provides an updated analysis of observed changes in extreme precipitation using high-quality station data up to 2018. We examine changes in extreme precipitation represented by annual maxima of 1-day (Rx1day) and 5-day (Rx5day) precipitation accumulations at different spatial scales and attempt to address whether the signal in extreme precipitation has strengthened with several years of additional observations. Extreme precipitation has increased at about two-thirds of stations and the percentage of stations with significantly increasing trends is significantly larger than that can be expected by chance for the globe, continents including Asia, Europe, and North America, and regions including central North America, eastern North America, northern Central America, northern Europe, the Russian Far East, eastern central Asia, and East Asia. The percentage of stations with significantly decreasing trends is not different from that expected by chance. Fitting extreme precipitation to generalized extreme value distributions with global mean surface temperature (GMST) as a covariate reaffirms the statistically significant connections between extreme precipitation and temperature. The global median sensitivity, percentage change in extreme precipitation per 1 K increase in GMST is 6.6% (5.1% to 8.2%; 5%–95% confidence interval) for Rx1day and is slightly smaller at 5.7% (5.0% to 8.0%) for Rx5day. The comparison of results based on observations ending in 2018 with those from data ending in 2000–09 shows a consistent median rate of increase, but a larger percentage of stations with statistically significant increasing trends, indicating an increase in the detectability of extreme precipitation intensification, likely due to the use of longer records.
Drivers of summer extreme precipitation events over East China
[J].
Spatiotemporal variations of extreme precipitation and its potential driving factors in China’s North-South Transition Zone during 1960-2017
[J].
Spatiotemporal characteristics of hourly-scale extreme precipitation in the Sichuan Basin and its impact on normalized difference vegetation index values
[J].This study harnesses ground observation data collected between 1980 and 2021 and ERA5 hourly data to thoroughly implement trend and correlation analysis techniques to explore the spatiotemporal dynamic characteristics of daily and hourly extreme precipitation in the Sichuan Basin. The investigation delineates these characteristics and probes into the potential triggers of extreme hourly rainstorms. The findings unveil the following: (1) A general increase in extreme rainfall volume, contribution rate, intensity, and dispersion, along with a decline in frequency and proportion of rainstorm areas, indicating the concentration of daily-scale severe rainstorms. The basin’s edge receives more precipitation than the bottom, exhibiting latitudinal variations. (2) The northernmost mountainous regions have less frequent, less intense rainstorms influenced by terrain, whereas the northeastern region experiences more frequent, dispersed rainstorms. (3) Extreme hourly rainstorms predominantly occur at night, with rainfall amount, intensity, and frequency declining at 21:00 compared to 19:00. (4) Summer experiences the highest risk of extreme rainstorms, with annual and monthly datasets displaying a rising trend in the frequency, dispersion, and intensity of intense hourly rainstorms. (5) Peak values of extreme hourly rainstorms are growing, with two distinct periods for their frequency: 1:00–9:00 and 10:00–24:00, with an increase in the former and a decrease in the latter. (6) Normalized difference vegetation index (NDVI) values ascend from southwest to northeast within the basin on a ten-day scale, correlating with the distribution of hourly extreme precipitation.
What are the dominant synoptic patterns leading to the summer regional hourly extreme precipitation events over central-eastern Tibetan Plateau and Sichuan Basin?
[J].
Characteristics of regional hourly extreme precipitation with different durations over the Northeast Plain, China during summer
[J].
Typical synoptic patterns responsible for summer regional hourly extreme precipitation events over the middle and lower Yangtze River basin, China
[J].
Characteristics of hourly extreme precipitation along the Yangtze River Basin, China during warm season
[J].Based on the hourly gauge-satellite merged precipitation data with the spatial resolution of 0.1° × 0.1° during 2008-2016, the characteristics of extreme precipitation (EP) diurnal cycle along the Yangtze River Basin (YRB) and their regional and sub-seasonal differences during warm season have been indicated and revealed in this study. Results show that the EP amount (EPA) over most lower reaches of YRB exhibits two diurnal peaks with one in late afternoon and the other in morning, while the EPA over most eastern Tibetan Plateau (the Sichuan Basin and the northern Yunnan-Guizhou Plateau) generally peaks during late afternoon to midnight (midnight to early morning). The afternoon (morning) EPA diurnal peaks over the areas east to 110°E is mainly resulted from the short (long) duration EP events. However, both the short and long duration EP events lead to the nocturnal diurnal peaks and eastward propagating features of EPA over the regions west to110°E. The EP events over the Sichuan Basin generally begin at midnight and mostly peak around 03:00-04:00 Beijing time, and they start earlier and end later with the duration time increased. However, the EP events with short (long) duration over the lower reaches of YRB frequently start and peak in afternoon (early morning) and typically end at around 18:00 (07:00-08:00) Beijing time, and they start later (earlier) and end later with the duration time increased. Meanwhile, the EP frequency (EPF) diurnal cycles over the lower reaches of YRB exhibit obvious sub-seasonal differences in warm season, which show only a morning peak in the pre-Meiyu period, two comparable peaks with one in afternoon and the other in morning during the Meiyu period, and a predominant afternoon peak and a secondary morning peak in the post-Meiyu period, respectively. While the EPF over Sichuan Basin characterized by only one dominant early morning peak during all periods of the warm season exhibits much smaller sub-seasonal differences in the diurnal phase relative to that over the lower reaches of YRB.


