秦岭及周边地区夏季极端降水环流特征及成因分析
Circulation characteristics and causal analysis of extreme summer precipitation over the Qinling Mountains and surrounding regions
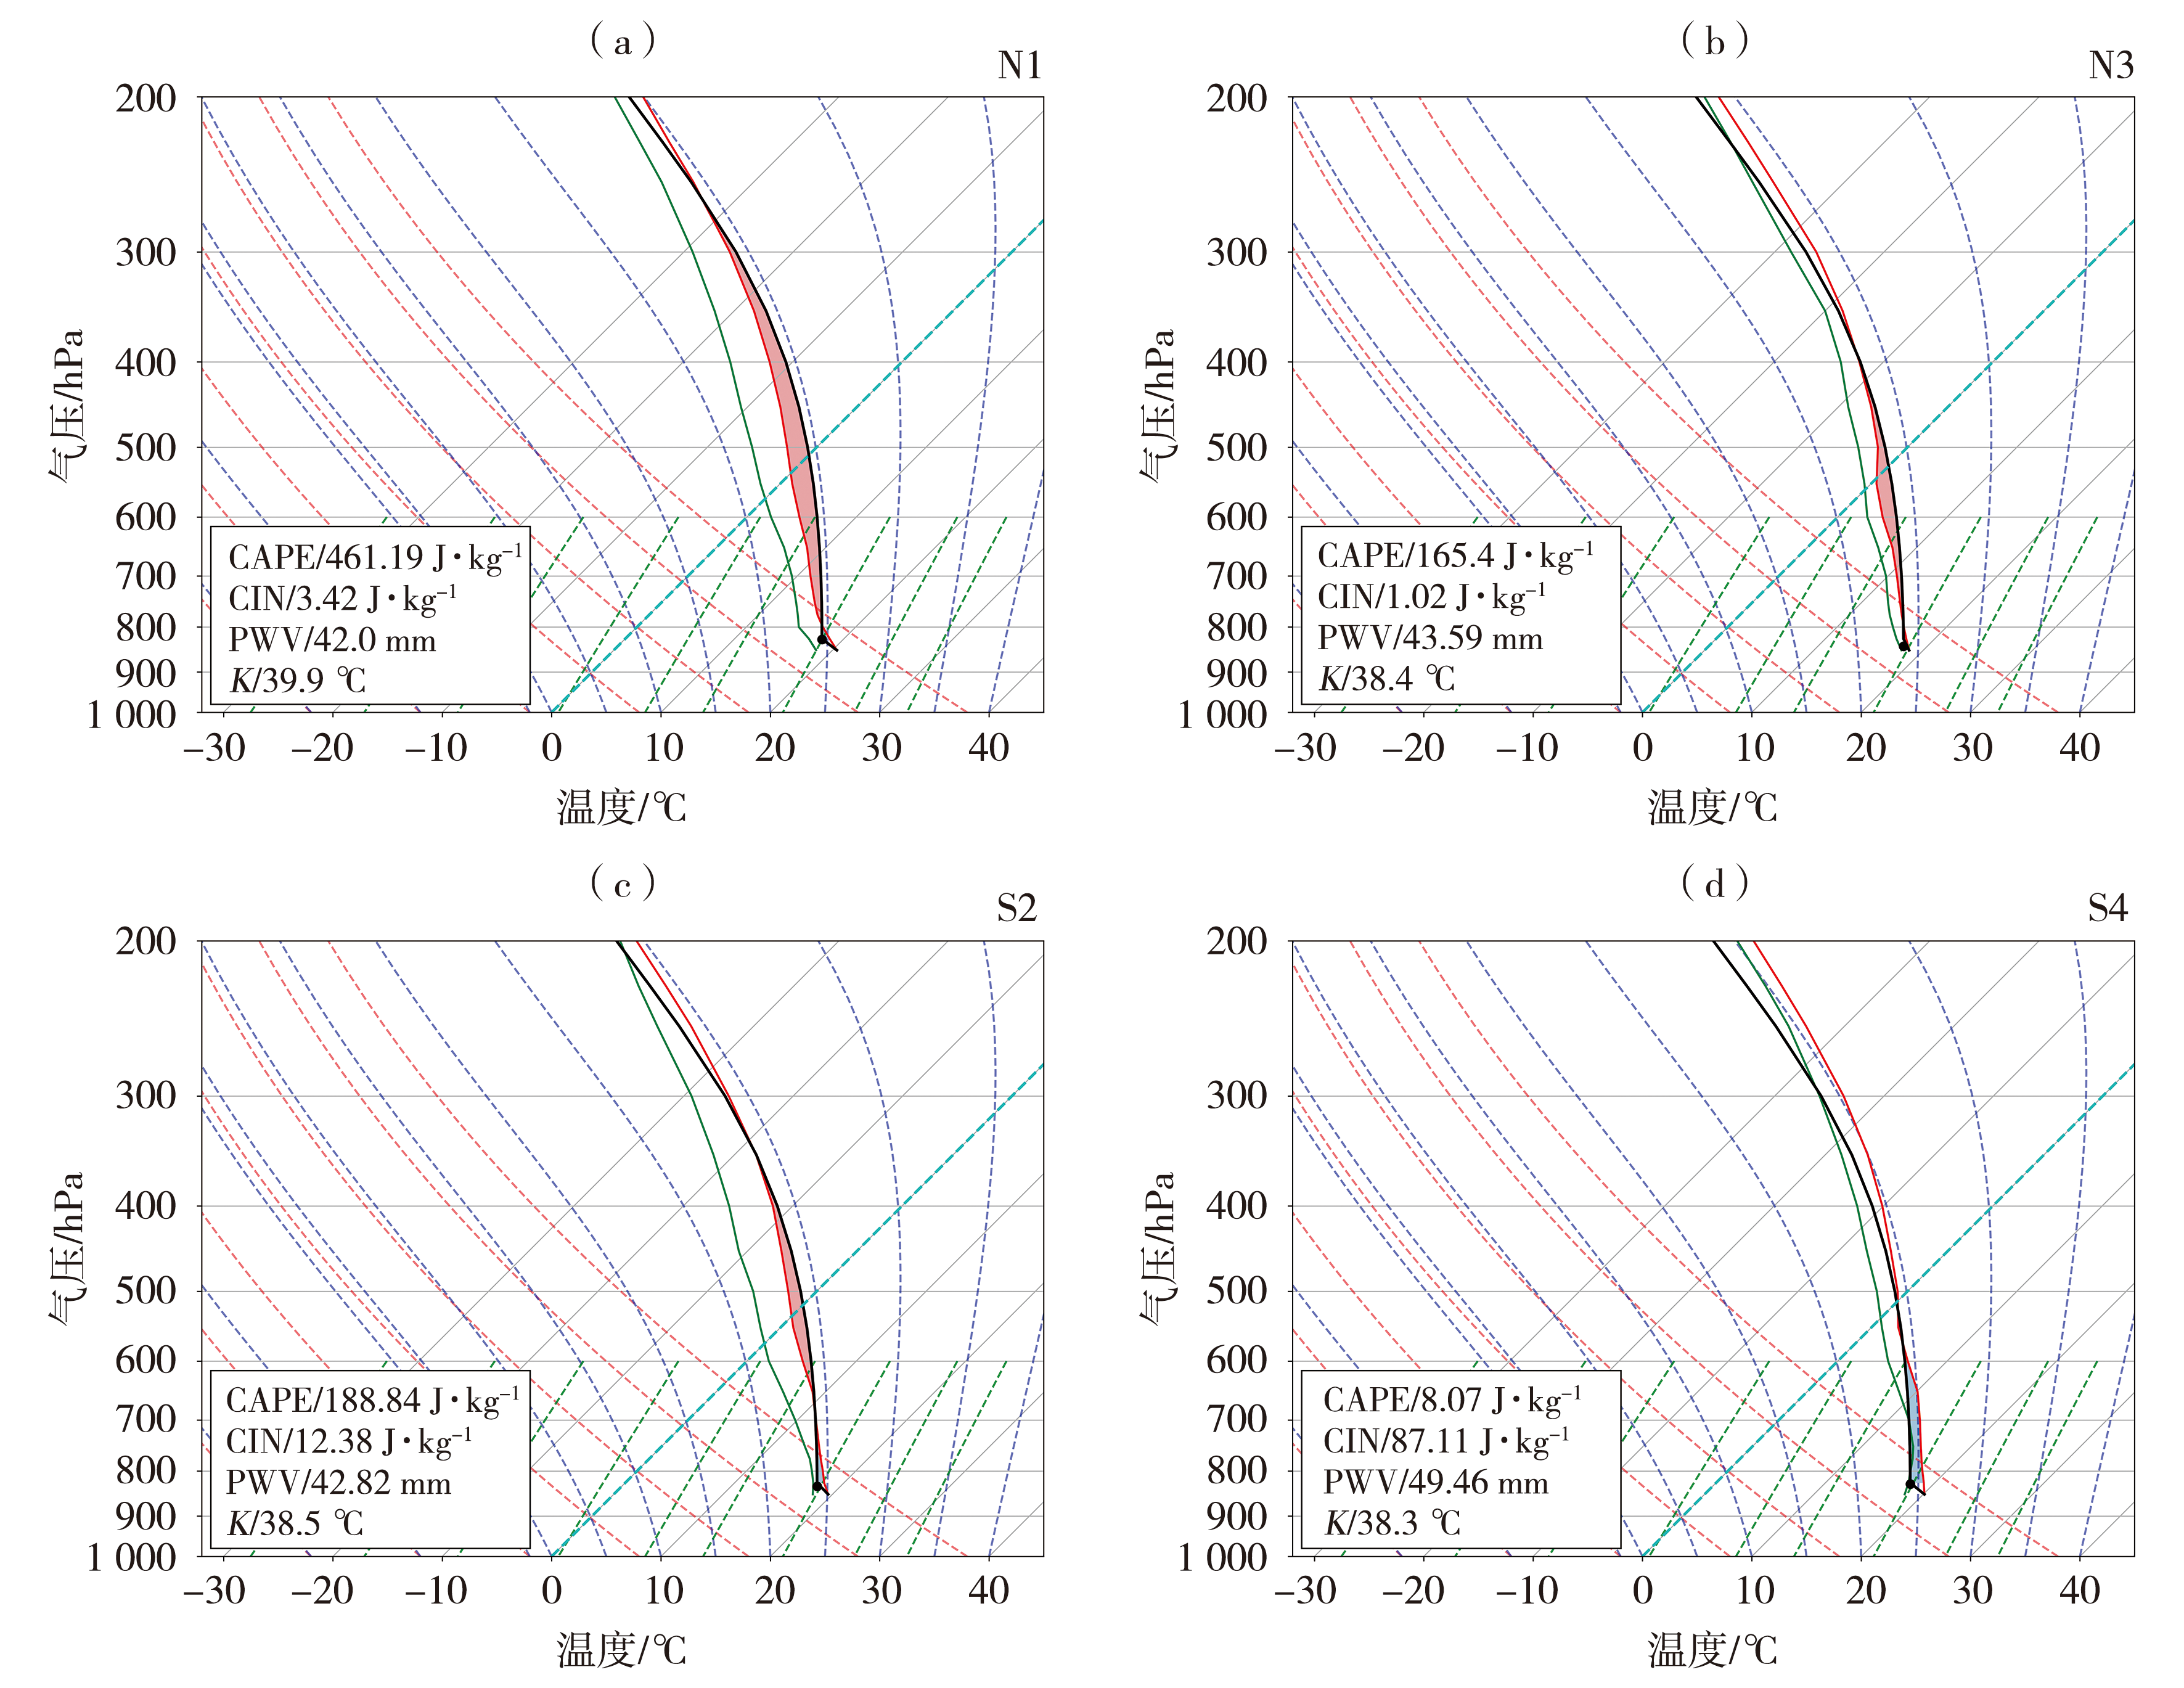
(红色曲线为环境温度,绿色曲线为环境露点温度,黑色曲线为气块温度,黑色圆点为抬升凝结高度)
(The red curve is environmental temperature, the green curve is environmental dew point temperature, the black curve is parcel temperature, the black dot is lifting condensation level)