

0 引言
全球变暖背景下,极端天气气候事件呈现“频发、强发、并发”特征,影响风光发电出力效率,对风光资源高质量开发构成挑战。大气科学中,极端事件通常采用最大值、百分位数、阈值指数等方法进行定义(Beniston et al.,2007)。例如,极端高温常用日最高气温极高值、暖昼日数、夏季日数等表征,极端低温则以日最低气温极低值、百分位阈值、冷夜日数等衡量(马丽云等,2024;Ibebuchi et al.,2025;庞萬隆等,2025)。研究表明,1961—2010年沙戈荒地区沙尘强度明显减弱(元天刚等,2016);1960—2018年中国北方极端高温指数呈上升趋势,且未来将持续上升,而极端低温事件发生频率减少,但强度增强,其指数未来将显著下降(Zhao and Chen,2021;Wang et al.,2022;庞萬隆等,2025)。然而,现有极端事件多定义为小概率事件,尚未建立与风光发电出力效率之间的直接定量关系。
科学评估极端事件影响下的风光资源开发气候风险,是保障风光资源高质量开发的重要基础。IPCC报告指出,气候风险由致灾因子、暴露度和脆弱性共同决定(IPCC,2023),其中脆弱性反映承灾体对气候灾害的敏感性与适应能力(张艳明,2021;孙涛等,2024;聂振岭等,2025)。基于上述气候风险理论框架,已有研究分析了沙尘、极端低温等事件对风光电场安全运行带来的风险(胡威等,2020),明确指出沙尘、极端高温和极端低温会造成风电、光伏电站设备损毁,影响电网安全运行(徐璨,2022)。此外,部分研究针对输电线路的大风灾害,综合考虑风速极值与频次分布、输电线路密度,评估了大风灾害对输电线路的综合风险(高建国和朱丹,2024)。然而,上述研究缺乏对极端事件与风光设备受损程度或发电效率关系的量化,可能导致风险评估存在较大不确定性。因此,本文基于经过偏差校正后的第六次耦合模式比较计划数据,选取SSP2-4.5和SSP5-8.5两种排放情景驱动天气研究与预报模式,采用考虑沙尘、极端高温和极端低温与风光发电效率之间定量关系的气候风险评估方法,分析2030—2060年中国沙戈荒地区极端事件的时空演变趋势,并研究未来极端事件影响下风光开发气候风险的时空特征。研究结果可为该地区未来风光基地化建设的政策规划和决策提供科学依据。
1 研究区概况、资料与方法
1.1 研究区概况
图1
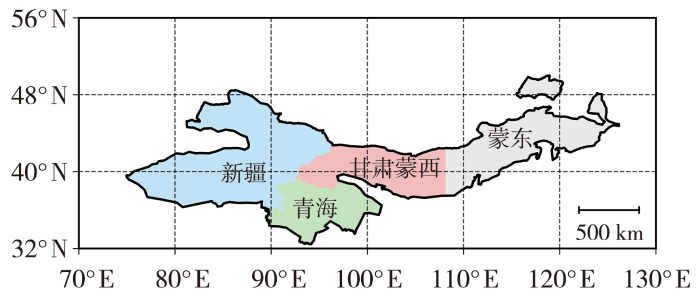
图1
沙戈荒地区的空间范围及其子区域
Fig.1
Spatial extent and subregions of the Gobi desert region of China
1.2 资料介绍
利用经过偏差校正后的第六次耦合模式比较计划(Coupled Model Intercomparison Project Phase 6, CMIP6)全球数据集(Xu et al.,2021),驱动天气研究与预报模式(Weather Research and Forecasting Model, WRF)开展动力降尺度模拟。该数据集空间分辨率为1.25°×1.25°,时间分辨率为6 h,融合了欧洲中期天气预报中心第五代再分析资料(European Centre for Medium-Range Weather Forecasts Reanalysis v5, ERA5)的气候平均态和年际变化信息,以及18个CMIP6模式集合平均的非线性趋势。在气候平均、年际变化和极端事件模拟方面均优于任一单独CMIP6模式,具有较高的可靠性(Xu et al.,2021)。研究时段包括历史时期(1980—2010年)和未来时期(2030—2060年),未来时期选取两个不同排放情景(SSP2-4.5、SSP5-8.5)。文中所有时间均为世界时。
1.3 极端事件的定义
1.4 气候风险评估方法
使用IPCC报告提出的气候风险评估模型(IPCC,2023),气候风险的表达式为:
式中:R是气候风险;H是致灾因子危险性;V表示承灾体脆弱性,由承灾体暴露度(E)与孕灾环境敏感性(S)共同决定,其中暴露度反映基地的设备暴露程度与装机规模,暴露度越高,承灾体在致灾因子影响范围内可能遭受的损失越大,在其他条件不变时,同等致灾因子导致的气候风险越高,敏感性反映局地环境对致灾因子的放大或缓解作用;a、b分别为权重系数。
表1 风光资源开发的气候风险指标
Tab.1
| 资源类型 | 指标类型 | 指标名称 | 指标内容 | 指标单位 |
|---|---|---|---|---|
| 风资源 | 危险性 | 致灾因子频率 | 次 | |
| 致灾因子强度 | ||||
| 致灾因子引起的风电发电效率损失 | % | |||
| 暴露度 | 风电基地面积 | km2 | ||
| 风电基地总装机容量 | kW | |||
| 敏感性 | 垂直风切变(Zhang et al.,2022) | m·s-1 | ||
| 湍流强度(夏馨等,2022) | ||||
| 风速 | m·s-1 | |||
| 光资源 | 危险性 | 致灾因子频率 | 次 | |
| 致灾因子强度 | ||||
| 致灾因子引起的光伏发电效率损失 | % | |||
| 暴露度 | 光伏基地面积 | km2 | ||
| 光伏基地总装机容量 | kW | |||
| 敏感性 | 向下短波辐射 | W·m-2 |
式中:η和ε分别表示由沙尘质量浓度引起的风电、光伏发电效率损失,单位均为%;x为近地面沙尘质量浓度,单位:mg·m-3。
图2
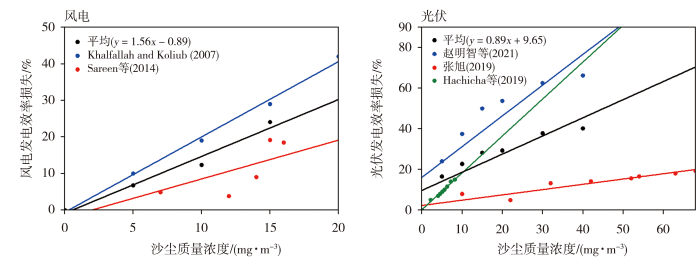
图2
近地面沙尘质量浓度与风电、光伏发电效率损失的线性拟合关系
Fig.2
Linear fitting relationship between near-surface dust mass concentration and efficiency loss of wind and photovoltaic power generation
1.5 数值试验设计
使用WRF-Chem模式开展数值模拟,该模式耦合了沙尘的起沙、传输和沉降过程,适用于沙尘相关研究(Skamarock et al.,2019)。模拟区域采用单层嵌套(兰勃托投影),覆盖沙戈荒地区(图1),中心点位于47°N、95°E,水平网格数为170×110,网格距为30 km×30 km,垂直层数41层。主要物理参数化方案包括:WSM6微物理方案(Hong and Lim,2006)、CAM长短波辐射方案(Collins et al.,2004)、YSU边界层方案(Hong et al.,2006)、KF积云对流方案(Kain,2004)、Noah陆面方案(Chen and Dudhia,2001)、GOCAR起沙过程方案(Ginoux et al.,2004;Grell et al.,2005)。历史时期(1979年12月1日00:00至2010年12月31日18:00)与未来时期(2029年12月1日00:00至2060年12月31日18:00)的初边界条件均来自偏差校正的CMIP6全球数据集,更新频率为6 h。模式积分首月作为预热期,未作分析。积分采用自适应时间步长以保证计算稳定,输出结果时间分辨率为3 h。在分析过程中将输出数据插值至0.25°×0.25°网格,仅分析沙戈荒及其四个子区域。
2 结果与分析
2.1 未来不同排放情景下极端事件的变化
2.1.1 空间分布
图3为未来不同排放情景下,沙戈荒地区各极端事件频率和强度相对于历史时期变化百分率的空间分布。可以看出,SSP2-4.5情景下,未来大部分地区沙尘频率呈减少趋势,其中新疆减少趋势显著,蒙东、青海南部则明显增多,增幅超过20%;未来大部分地区沙尘强度呈增强趋势,青海、甘肃蒙西以及蒙东地区增幅尤为显著,其中蒙东地区增强幅度超过20%。SSP5-8.5情景下沙戈荒地区未来沙尘频率和强度的变化与SSP2-4.5情景总体类似,但内蒙古中部的沙尘频率呈显著减少趋势,南疆地区的沙尘强度呈显著增强趋势。说明未来沙戈荒地区沙尘的发生频率总体呈下降趋势,但沙尘事件的致灾能力有所增强,单次沙尘过程对风光发电效率的影响也随之加剧。未来极端高温的频率在新疆、甘肃蒙西、蒙东大部分地区均显著增多,强度也显著增强,其中频率增多超过200%,强度增强超过40%,但未来青海地区极端高温的频率和强度相对历史时期变化并不显著。沙戈荒地区未来极端低温的频率总体呈减少趋势,但仅在蒙东、新疆北部显著减少,青海南部地区则呈显著增加趋势,增幅超过20%;未来极端低温强度均呈减弱趋势,尤其在蒙东、新疆北部和青海南部地区减少幅度超过20%。这表明,未来沙戈荒地区极端高温的致灾危险性总体上显著增强,而极端低温的致灾危险性在蒙东和新疆北部地区显著减弱。
图3
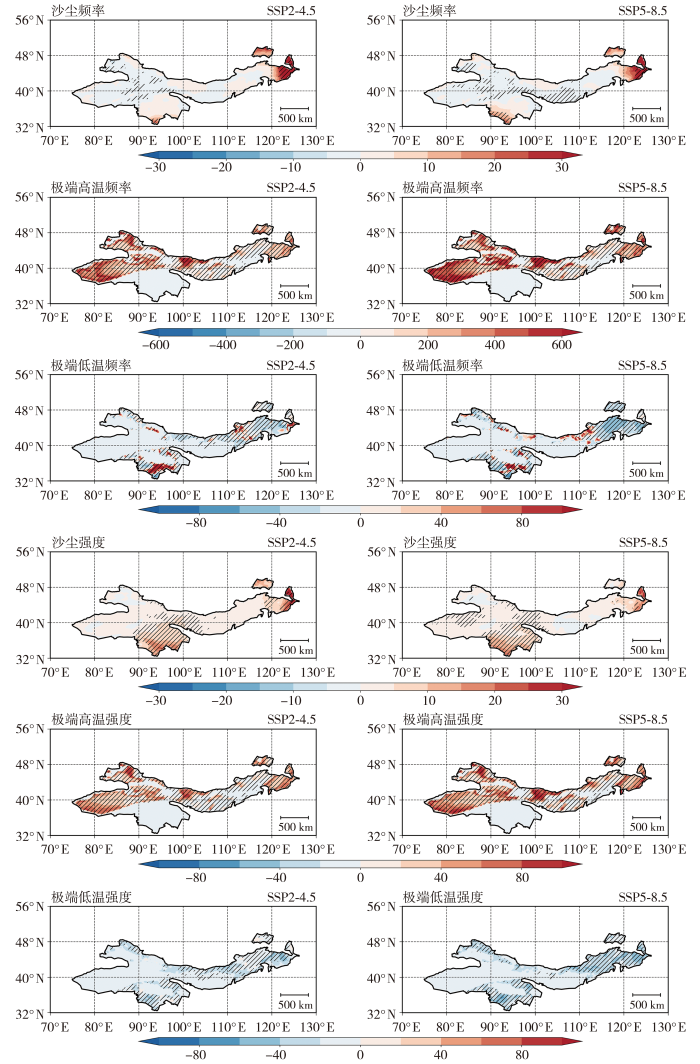
图3
2030—2060年不同排放情景下沙戈荒地区不同极端事件的频率、强度相对历史时期变化百分率空间分布
(斜线区域表示变化百分率通过0.1的显著性检验,下同)
Fig.3
Spatial distribution of percentage changes of frequency and intensity of different extreme events in the Gobi desert region of China during 2030-2060 relative to the historical period under different emission scenarios
(Black hatched areas indicate that percentage changes pass the significance test at the 0.1 level, the same as below)
2.1.2 趋势变化
图4为未来不同排放情景下沙戈荒地区不同极端事件频率和强度相对历史时期变化百分率的年际变化。可以看出,未来沙尘频率的变化百分率总体呈不显著减少趋势,但其强度的变化百分率却呈不显著的微弱增加趋势。未来极端高温的频率和强度将增多、增强,但相对变化百分率的趋势不显著。在SSP2-4.5情景下,未来极端低温频率的变化百分率呈显著增加趋势;SSP5-8.5情景下极端低温频率变化百分率的趋势不显著。未来不同排放情景下极端低温强度的变化百分率趋势不显著。此外,未来极端高温强度的变化百分率明显大于极端低温和沙尘的变化百分率。上述结果表明,未来沙戈荒地区影响风光发电效率的极端事件中,单次沙尘发生时对风光发电效率的影响将增强,极端高温的致灾危险性总体增强,而极端低温的强度总体减弱,这与图3的结果基本一致。研究表明,全球地表平均温度升高是极端高温事件增加、极端低温事件减少的直接原因(IPCC,2023;Xu et al.,2024),这一温度变化的驱动机制可合理解释本文中极端高温致灾危险性增强和极端低温强度减弱。此外,中国北方地区未来降水量和土壤水分的增加,以及强蒙古气旋频率的显著下降,将促进该地区植被覆盖率提高、抑制上升运动,从而使沙尘总量呈下降趋势(Li et al.,2022;赵剑琦等,2023;Liu et al.,2024),这一物理机制可解释本文得出的沙尘频率变化百分率减少趋势。
图4
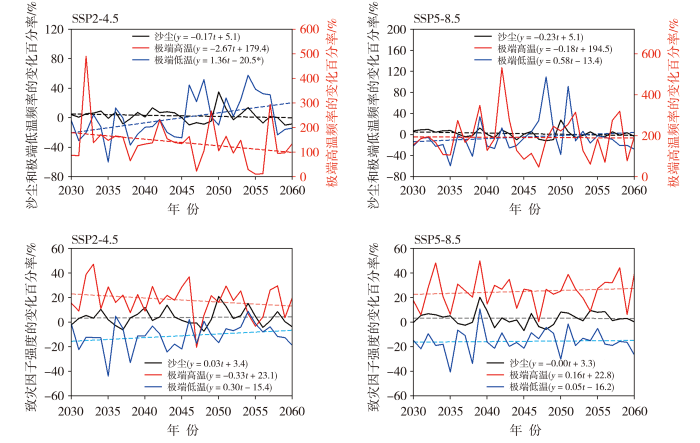
图4
2030—2060年不同排放情景下沙戈荒地区不同极端事件的频率和强度相对历史时期变化百分率的年际变化
(*表示线性趋势通过0.1的显著性检验,下同)
Fig.4
Interannual variations of percentage changes of frequency and intensity of different extreme events in the Gobi desert region of China during 2030-2060 relative to the historical period under different emission scenarios
(* denotes that the linear trend passes the significance test at the 0.1 level, the same as below)
2.2 未来极端事件影响下风光开发的气候风险
2.2.1 气候风险空间分布
图5为沙戈荒地区风电和光伏基地暴露度的空间分布。可以看出,甘肃酒泉和蒙东地区风电基地暴露度较高,而新疆、青海和蒙东地区光伏基地的暴露度较高,说明上述区域风光资源开发面临的气候风险更高,是后续规模化风光基地建设中风险防控的重点区域。
图5
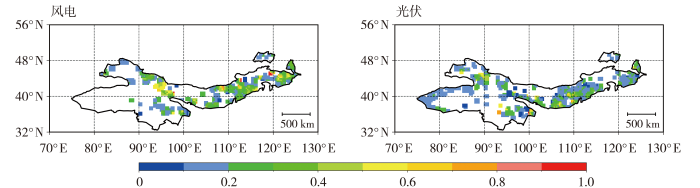
图5
沙戈荒地区风电和光伏基地暴露度的空间分布
Fig.5
Spatial distribution of exposure degree of wind and photovoltaic power bases in the Gobi desert region of China
图6为未来SSP2-4.5排放情景下不同极端事件影响下风光资源开发的气候风险相对历史时期变化百分率的空间分布。可以看出,沙戈荒地区未来沙尘引起的风资源开发气候风险总体呈增加趋势,尤其在青海、甘肃河西和蒙东地区增加显著。极端高温对风资源开发的气候风险总体上显著增加。极端低温引起的风资源开发气候风险在新疆北部、青海中部、甘肃蒙西地区增加,在蒙东显著减小。对于太阳能资源的开发,沙戈荒地区未来沙尘引起的气候风险总体上增加,尤其在青海南部以及蒙东地区增加显著。未来极端高温引起的气候风险在沙戈荒地区总体显著增加。SSP5-8.5情景下气候风险的空间分布特征与SSP2-4.5情景基本一致(图略)。结合图3表明,气候风险的变化与极端事件致灾因子的变化空间分布基本一致,体现了致灾因子对风险的主导作用。但未来极端高温的危险性在青海地区减小,其影响下风光资源的气候风险则增加,极端低温的危险性在新疆和甘肃蒙西地区减小,其影响下风光资源的气候风险也增加,与这些地区孕灾环境敏感性的增强有关(图略)。
图6
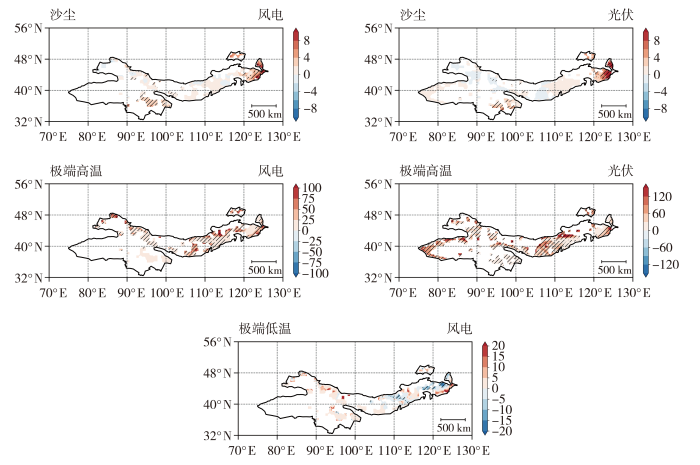
图6
未来SSP2-4.5排放情景下不同极端事件影响下风光开发的气候风险相对于历史时期变化百分率的空间分布(单位:%)
Fig.6
Spatial distribution of percentage changes of climate risks for wind-solar power development under the influence of different extreme events in the future SSP2-4.5 emission scenario relative to the historical period (Unit: %)
2.2.2 气候风险的趋势变化
图7为2030—2060年不同排放情景、不同极端事件影响下风光资源开发的气候风险相对历史时期变化百分率的年际变化。可以看出,未来不同排放情景下沙尘引起的风资源开发气候风险变化百分率总体呈显著增加趋势;极端高温引起的风资源开发气候风险将增大,但相对变化百分率的趋势不显著;SSP2-4.5情景下极端低温引起的风资源开发气候风险变化百分率呈不显著增加趋势,SSP5-8.5情景下则呈不显著减少趋势。对于太阳能资源的开发,未来沙尘造成的气候风险变化百分率呈不显著增加趋势。未来极端高温造成的气候风险将增大,但相对变化百分率呈不显著减少趋势,其中SSP2-4.5情景下的减小速率更快。极端高温和极端低温影响下风光资源开发的气候风险与该极端事件的频率、强度变化趋势较为一致。图3的结果表明,未来沙戈荒地区单次沙尘发生时对风光发电效率的影响增强,这是沙尘影响下风光资源开发的气候风险变化百分率呈增加趋势的重要原因。
图7
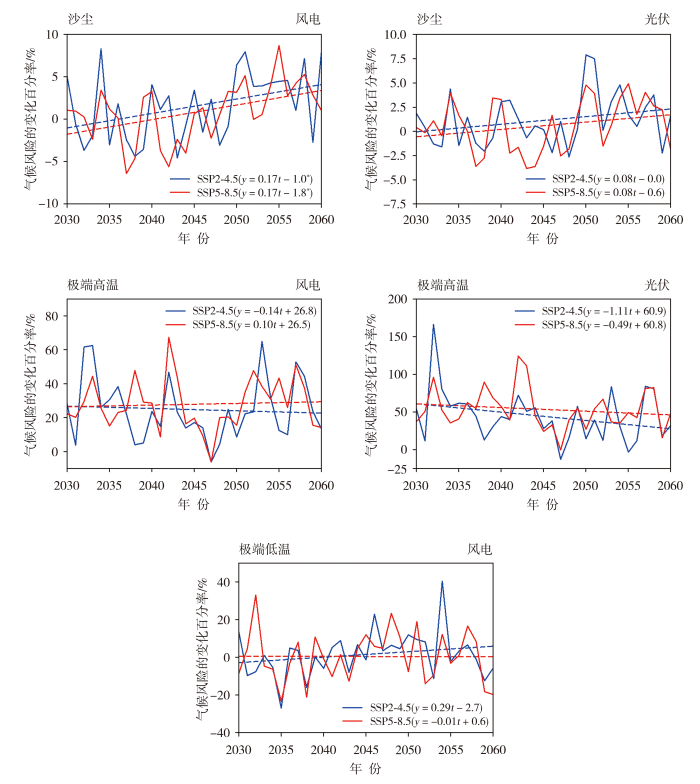
图7
2030—2060年不同排放情景、不同极端事件影响下风光资源开发的气候风险相对历史时期变化百分率的年际变化
Fig.7
Interannual variations of percentage changes of climate risks of wind and solar resource development in the Gobi desert region of China during 2030-2060 relative to the historical period under different emission scenarios and extreme events
图8为2030—2060年不同排放情景、不同极端事件影响下沙戈荒及不同子区域风光资源开发的气候风险相对于历史时期变化百分率的箱线图。可以看出,SSP2-4.5情景下,除了蒙东地区外,沙戈荒地区及其他子区域未来沙尘对风资源开发的气候风险将显著增加;SSP5-8.5情景下的风险变化类似,但在甘肃蒙西地区气候风险整体更低。除青海外,沙戈荒地区及其他子区域未来极端高温对风资源开发的气候风险总体上显著增加,这一风险在SSP5-8.5情景下更高。不同排放情景下,极端低温带来的风资源开发气候风险区域差异显著:SSP2-4.5情景风险加剧区主要集中在青海和甘肃蒙西地区;SSP5-8.5情景下新疆、青海和蒙东地区风险显著增加。对于太阳能资源的开发,沙戈荒地区未来沙尘引起的气候风险总体上呈增加趋势,但仅在青海地区显著增加。未来极端高温引起的气候风险在沙戈荒地区及其不同子区域均显著增加,SSP5-8.5情景下的风险明显更高。综上,未来极端事件影响下沙戈荒地区风光资源开发的气候风险总体上显著增强。新疆风资源开发面临的主要风险来自沙尘和极端高温,太阳能资源开发的主要风险来自极端高温;青海风资源开发面临的主要风险来自沙尘和极端低温,太阳能资源开发面临的主要风险来自沙尘和极端高温;甘肃蒙西风资源开发面临沙尘、极端高温和极端低温的多重风险,太阳能资源开发的主要风险为极端高温;蒙东风资源开发及太阳能资源开发的主要风险均为极端高温。
图8
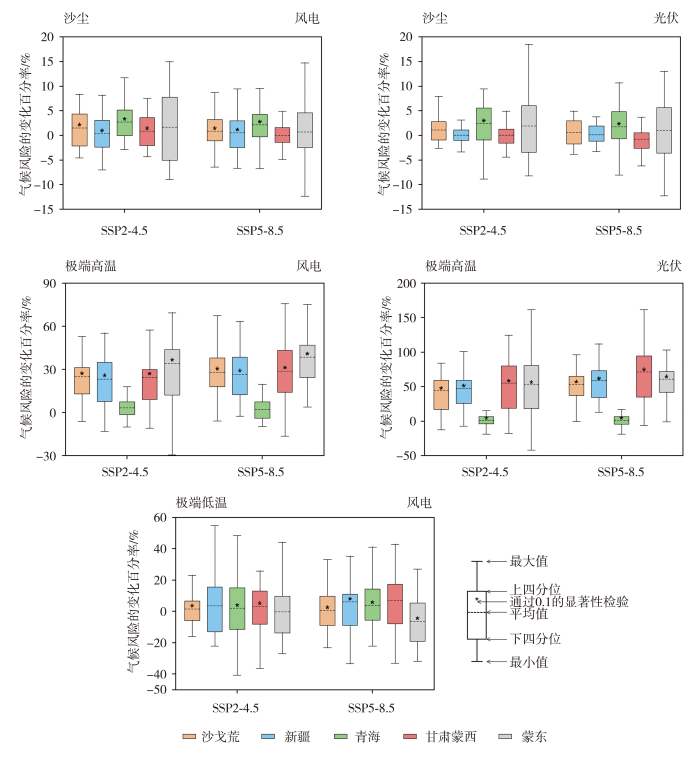
图8
2030—2060年不同排放情景、不同极端事件影响下沙戈荒及不同子区域风光资源开发的气候风险相对于历史时期变化百分率的箱线图
Fig.8
Box plots of percentage changes of climate risks of wind and solar resource development in the Gobi desert region of China and its sub-regions during 2030-2060 relative to the historical period under different emission scenarios and extreme events
3 结论与讨论
本文预估了2030—2060年沙尘、极端高温和极端低温事件对中国沙戈荒地区风光资源开发的气候风险,得到以下主要结论。
1)未来沙戈荒地区沙尘事件频率的相对变化百分率总体减少,但致灾能力增强,即单次沙尘对风光发电效率的影响增加。极端高温事件的致灾危险性整体呈上升趋势,而极端低温事件的致灾危险性总体呈下降趋势。
2)在极端事件影响下,未来沙戈荒地区风光资源开发的气候风险总体呈增强趋势。沙尘对风资源开发的气候风险在新疆和青海地区显著增加,对太阳能资源开发的气候风险在青海地区显著增加。极端高温对风资源开发的气候风险在新疆、甘肃蒙西及蒙东地区显著增加,对太阳能资源开发的气候风险在各地区均显著增加。极端低温对风资源开发的气候风险存在明显区域差异:SSP2-4.5情景下风险显著上升区为青海、甘肃蒙西;SSP5-8.5情景下风险高值区转为新疆、青海及蒙东地区。
3)极端事件影响下风光资源开发的气候风险与致灾因子危险性的空间分布及变化趋势具有较好的一致性,表明未来气候风险主要由致灾因子驱动。
本文仅考虑了沙尘、极端高温和极端低温三种致灾因子,且未区分不同类型光伏板与风机对效率损失的响应差异,研究仍存在一定的不确定性。未来需结合观测实验,考虑新能源机组性能和更多的致灾因子,全面评估风光资源开发面临的气候风险。
参考文献
干旱灾害对河北省苹果种植的风险评估
[J].
科学评估苹果关键生育期的干旱灾害风险,对降低苹果因旱损失具有重要意义。本文基于河北省气象资料、苹果种植资料、高程、河流密度和植被覆盖度等多源数据,通过分析干旱灾害发生的致灾因子危险性、孕灾环境敏感性和承灾体暴露性,系统评估了河北省苹果关键生育期的干旱灾害风险特征。结果表明:河北省苹果在萌芽—幼果期干旱发生概率最高,普遍超过60%,且以重旱和特旱为主。致灾因子危险性由高到低依次为:萌芽—幼果期>着色—成熟期>果实膨大期,其中西北部在各生育期均为危险性高值区。孕灾环境敏感性呈现由东南向西北递增的空间分布特征,承灾体暴露性在东部和南部局地相对较高。萌芽—幼果期、果实膨大期、着色—成熟期干旱灾害风险指数大于0.800的区域分别占比20.8%、8.7%和8.5%,且西北部在各生育期均为风险指数的高值区。苹果全生育期干旱灾害风险的高值区、中值区和低值区分别占总面积的14.2%、27.2%、58.6%,整体呈由东南向西北逐渐升高趋势。因此,需重点关注河北省西北部高风险区的干旱灾害防御工作,为苹果产业抗旱减灾提供科学依据。
新疆伊犁河流域近30 a极端高温时空分布特征
[J].在全球气候变化背景下,极端高温事件频发,且自21世纪以来其发生频率明显增加,对农业生产及人体健康造成深远影响。为探究地形复杂的伊犁河流域极端高温时空演变规律,本文利用1991—2020年该流域11个气象站逐日气温数据,计算夏季日数(SU25)、热夜日数(TR20)、暖昼日数(TX90p)、暖夜日数(TN90p)、日最高气温极高值(TXx)和日最低气温极高值(TNx)6个极端高温指数,并通过线性趋势分析、Mann-Kendall突变检验、经验正交函数分解(Empirical Orthogonal Function decomposition,EOF)以及克里金插值法(Kriging),系统分析伊犁河流域6个极端高温指数的时空变化特征。 结果表明:伊犁河流域大部分极端高温指数整体呈快速增长趋势,且在20世纪90年代至21世纪初发生显著突变。其中SU25、TX90p、TXx和TNx的增长速率突出,2015年后各指数处于加速增长阶段。空间分布上,流域大部分极端高温指数呈现明显的“西北高、东南低”格局:西北部为高温指数高值区,昭苏东北部、特克斯、巩留及尼勒克西南部形成稳定低值中心。由EOF分解得到TXx与TNx的空间分布存在两种典型模态,其演变特征与流域极端高温整体变化趋势具有高度一致性。
强降水诱发陇南电网地质灾害风险评估及预警方法研究
[J].陇南输电线路沿线地质灾害频发易发,严重威胁线路安全稳定运行。为有效提升陇南电网防灾减灾能力,选取2018—2022年5—10月降水数据,利用降水分布特征和有效雨量致灾概率评估地质灾害致灾因子危险性,利用信息量-层次分析耦合模型评估孕灾环境暴露度,利用地质灾害脆弱性简化评估模型评估承灾体脆弱性,并以陇南±800 kV青豫线、祁韶线为例,利用地质灾害个例检验强降水诱发电网地质灾害风险预警效果。结果表明,陇南短时强降水和暴雨局地性强,发生频次自西北向东南呈增加趋势,灾情点大多发生在较高和高危险性区域。地质灾害灾情点大多位于海拔较高、坡度较陡区域,易发坡向为北坡、南坡并以凸型坡为主,旱地、中度及以下植被覆盖度区域地质灾害易发,67.4%的灾情点位于较高暴露度以上区域。陇南±800 kV青豫线、祁韶线电线杆塔不处于极高暴露度与极高脆弱性区域。地质灾害气象风险模型能够捕捉到较密集的地质灾害事件,有效雨量致灾概率对降水诱发的地质灾害预警效果较好。
1961—2010年中国北方沙尘源区沙尘强度时空分布特征及变化趋势
[J].利用1961—2010年我国北方沙尘源区134个地面气象站沙尘暴、扬沙和浮尘发生频率逐月资料,结合定义的沙尘指数,系统地分析了中国北方7大主要沙尘源区沙尘强度的时空分布特征及变化趋势。结果表明:西部的塔克拉玛干沙漠沙尘强度最高,多年平均沙尘指数高达235,其次是中部的阿拉善高原和鄂尔多斯高原沙漠群(182),东北部的呼伦贝尔沙地沙尘强度最小,多年平均沙尘指数仅为23。总体来看,近50 a来中国沙尘源区的沙尘强度呈明显减小趋势,沙尘指数在1972、1987和2000年出现突变。其中,中部的阿拉善高原和鄂尔多斯高原沙漠群沙尘强度减小趋势最为显著(-6.3 a-1),其次是西部的塔克拉玛干沙漠(-5.9 a-1)。EOF分析结果表明,中国北方沙尘源区各地的沙尘强度整体变化一致,塔克拉玛干沙漠、阿拉善高原和鄂尔多斯高原沙漠群是沙尘强度变化中心;在此基础上,东西部地区的沙尘强度呈明显的反相变化;此外,中国北方沙尘源区的沙尘强度在1980年代后期发生显著变化,沙尘指数至今处于较低值。
新时代的中国绿色发展
[R/OL]. (2023-01-19)[2026-04-20]. http://www.scio.gov.cn/zfbps/zfbps_2279/202303/t20230320_707649.html.
Performance analysis of a 10-MW wind farm in a hot and dusty desert environment. Part 2: Combined dust and high-temperature effects on the operation of wind turbines
[J].
Future extreme events in European climate: An exploration of regional climate model projections
[J].
Influence of Extreme Climate events on wind and Solar Energy over the Gobi Desert Region of China in the future
[J].
Breakthroughs in renewable energy: The future of sustainable power
[J].
Coupling an advanced land surface-hydrology model with the Penn State-NCAR MM5 modeling system. Part II: Preliminary model validation
[J].
Description of the NCAR Community Atmosphere Model (CAM 3.0)
[R].
Long-term simulation of global dust distribution with the GOCART model: Correlation with North Atlantic Oscillation
[J].
Fully coupled “online” chemistry within the WRF model
[J].
Impact of dust on the performance of solar photovoltaic (PV) systems under United Arab Emirates weather conditions
[J].
The WRF single-moment 6-class microphysics scheme (WSM6)
[J].
A new vertical diffusion package with an explicit treatment of entrainment processes
[J].This paper proposes a revised vertical diffusion package with a nonlocal turbulent mixing coefficient in the planetary boundary layer (PBL). Based on the study of Noh et al. and accumulated results of the behavior of the Hong and Pan algorithm, a revised vertical diffusion algorithm that is suitable for weather forecasting and climate prediction models is developed. The major ingredient of the revision is the inclusion of an explicit treatment of entrainment processes at the top of the PBL. The new diffusion package is called the Yonsei University PBL (YSU PBL). In a one-dimensional offline test framework, the revised scheme is found to improve several features compared with the Hong and Pan implementation. The YSU PBL increases boundary layer mixing in the thermally induced free convection regime and decreases it in the mechanically induced forced convection regime, which alleviates the well-known problems in the Medium-Range Forecast (MRF) PBL. Excessive mixing in the mixed layer in the presence of strong winds is resolved. Overly rapid growth of the PBL in the case of the Hong and Pan is also rectified. The scheme has been successfully implemented in the Weather Research and Forecast model producing a more realistic structure of the PBL and its development. In a case study of a frontal tornado outbreak, it is found that some systematic biases of the large-scale features such as an afternoon cold bias at 850 hPa in the MRF PBL are resolved. Consequently, the new scheme does a better job in reproducing the convective inhibition. Because the convective inhibition is accurately predicted, widespread light precipitation ahead of a front, in the case of the MRF PBL, is reduced. In the frontal region, the YSU PBL scheme improves some characteristics, such as a double line of intense convection. This is because the boundary layer from the YSU PBL scheme remains less diluted by entrainment leaving more fuel for severe convection when the front triggers it.
Recent trends in extreme temperature events across the contiguous United States
[J].Extreme heat events (EHEs) are becoming prevalent across the globe and are a major factor in terms of temperature‐related mortality in the United States (US). In this study, we compare trends in extreme temperature events (ETEs) across the Contiguous US, from 3 reanalysis products, namely: European Centre for Medium‐Range Weather Forecasts Reanalysis Version 5 (ERA5), Modern‐Era Retrospective Analysis for Research and Applications Version 2 (MERRA2) and North American Regional Reanalysis (NARR). We focused on the trends (1980–2022) in absolute extreme heat and cold events (ECE) as well as seasonally relative extreme heat and cold events (REHE and RECE). ETEs are defined based on a duration‐intensity metric calculated from excess apparent temperature factors, based on the exceedance of apparent temperature beyond local percentile thresholds while incorporating an acclimatisation factor. Our results show that the reanalysis data sets generally produced consistent climatology of ETEs, though with some inconsistencies in their number and spatial distribution. ETE trends in the study region are spatially heterogeneous and were more consistent between MERRA2 and ERA5. Nonetheless, all data sets agree that the frequency of EHEs is significantly increasing in the western parts of the US, whereas REHEs are significantly increasing in the southern parts. The highest increase in the frequency of EHEs occurs in southern California and Nevada, while REHE trends are maximal in Florida. RECEs are significantly decreasing more in spatial scale and magnitude than ECEs, especially towards the coastal regions. The highest decrease in RECEs is in Florida peninsula, southern California and Nevada. The data sets show inconsistency in ECE trends. Trends in excess temperature factors further indicated that extreme cold conditions are decreasing faster compared to the increasing trends of extreme heat conditions. Our findings highlight the need for improving the monitoring of ETEs across the US and for policies that mitigate the impact of ETEs on biological systems.
The kain-fritsch convective parameterization: An update
[J].
Effect of dust on the performance of wind turbines
[J].
Predominant type of dust storms that influences air quality over northern China and future projections
[J].
Historical footprints and future projections of global dust burden from bias-corrected CMIP6 models
[J].Dust aerosols significantly affect the Earth’s climate, not only as a source of radiation, but also as ice nuclei, cloud condensation nuclei and thus affect CO2 exchange between the atmosphere and the ocean. However, there are large deviations in dust model simulations due to limited observations on a global scale. Based on ten initial Climate Models Intercomparison Project Phase Six (CMIP6) models, the multi-model ensemble (MME) approximately underestimates future changes in global dust mass loading (DML) by 7–21%, under four scenarios of shared socioeconomic pathways (SSPs). Therefore, this study primarily constrains the CMIP6 simulations under various emission scenarios by applying an equidistant cumulative distribution function (EDCDF) method combined with the Modern-Era Retrospective Analysis for Research and Applications version 2 (MERRA2) datasets based on observation assimilation. We find that the results (19.0–26.1 Tg) for 2000–2014 are closer to MERRA2 (20.0–24.8 Tg) than the initial simulations (4.4–37.5 Tg), with model deviation reduced by up to 75.6%. We emphasize that the DML during 2081–2100 is expected to increase significantly by 0.023 g m–2 in North Africa and the Atlantic region, while decreasing by 0.006 g m–2 in the Middle East and East Asia. In comparison with internal variability and scenario uncertainty, model uncertainty accounts for more than 70% of total uncertainty. When bias correction is applied, model uncertainty significantly decreases by 65% to 90%, resulting in a similar variance contribution to internal variability.
Effects of leading edge erosion on wind turbine blade performance
[J].
Vertical resolution requirements in atmospheric simulation
[J].The role of vertical mesh spacing in the convergence of full-physics global atmospheric model solutions is examined for synoptic, mesoscale, and convective-scale horizontal resolutions. Using the MPAS-Atmosphere model, convergence is evaluated for three solution metrics: the horizontal kinetic energy spectrum, the Richardson number probability density function, and resolved flow features. All three metrics exhibit convergence in the free atmosphere for a 15-km horizontal mesh when the vertical grid spacing is less than or equal to 200 m. Nonconvergence is accompanied by noise, spurious structures, reduced levels of mesoscale kinetic energy, and reduced Richardson number peak frequencies. Coarser horizontal mesh solutions converge in a similar manner but contain much less noise than the 15-km solutions for coarse vertical resolution. For convective-scale resolution simulations with 3-km cell spacing on a variable-resolution mesh, solution convergence is almost attained with a vertical mesh spacing of 200 m. The boundary layer scheme is the dominant source of vertical filtering in the free atmosphere. Although the increased vertical mixing at coarser vertical mesh spacing depresses the kinetic energy spectra and Richardson number convergence, it does not produce sufficient dissipation to effectively halt scale collapse. These results confirm and extend the results from a number of previous studies, and further emphasize the sensitivity of the energetics to the vertical mixing formulations in the model.
Assessment and prediction of extreme temperature indices in the North China Plain by CMIP6 climate model
[J].Extreme temperature events are becoming more frequent due to global warming, and have critical effects on natural ecosystems, social and economic spheres, human production and life. Predicting changes in temperature extremes and trends under future climate scenarios helps to assess the impact of climate change accurately. Based on climate observations from 54 meteorological stations in the North China Plain and the projection data from seven general circulation models (GCMs) from the Coupled Model Intercomparison Project phase 6 (CMIP6), this paper researches nine representative extreme temperature indices under four typical climate scenarios. The aim is to reveal the temporal and spatial variations in extreme temperature indices in the North China Plain during the past (1971–2010) and the future (2061–2100). The results show that: using a support vector machine (SVM) to perform regression analysis on the multi-GCMs prediction results, the root mean square error (RMSE) and relative standard deviation (RSD) of the multi-model ensemble simulations obtained by the SVM method are lower than those of the arithmetic mean method and can better match the trend of the historical extreme temperature index; the extreme high temperature index is predicted to show a significant upward trend in the future, while the extreme low temperature index will decrease significantly; and there are significant spatial differences in the extreme temperature index in both historical and future periods, with the extreme temperature index under the high radiation forcing scenario (SSP585) showing the most considerable variation and the most significant spatial differences.
Impacts of natural and anthropogenic forcings on historical and future changes in global-land surface air temperature in CMIP6-DAMIP simulations
[J].
Bias-corrected CMIP6 global dataset for dynamical downscaling of the historical and future climate (1979-2100)
[J].
High-temperature power reduction state identification for wind turbines using feature correlation analysis and deep learning methods
[J].
What can we obtain from the initial conditions of assimilating wind tower observation to improve near-surface meteorological elements?
[J].Accurate initial condition is prerequisite to an accurate prediction/forecast of near-surface meteorological elements and wind power. Although assimilating wind tower observations of wind farms in the initial condition has been proved feasible to improve the prediction, how and why assimilating wind tower observation improves initial condition are unclear. This study aims to improve the prediction by obtaining effective information from the initial conditions of assimilating wind tower observations. Results suggest that assimilating wind tower observations has local impacts on the initial condition, and the improvement of the initial condition is significantly related to the observed near-surface atmospheric stability. The forecast improvement by assimilating wind tower observations depends on two effective information: determining whether the initial condition is improved and the length of the improved initial condition can positively impact the forecast results. When the initial condition improves, forecast improvements can persist for about 12 h and are most distinct in the ultra-short term (0–4 h). Using the two effective information not only can distinctly improve the forecasts of near-surface wind, temperature, relative humidity, and wind power, but also can eliminate the stochastic forecasts. When the initial condition improves by assimilation, enhancing nudging intensity will have more positively impact on the prediction, and the root mean square error and mean absolute error in the ultra-short term can be reduced by 0.39 and 0.44 m s−1 for near-surface wind and 66.64 and 79.09 kW for wind power, respectively.
A comprehensive study of spatiotemporal variations in temperature extremes across China during 1960-2018
[J].Understanding the changing patterns of extreme temperatures is important for taking measures to reduce their associated negative impacts. Based on daily temperature data derived from 2272 meteorological stations in China, the spatiotemporal variations in temperature extremes were examined with respect to covariates by means of the Mann–Kendall test and a spatiotemporal model during 1960–2018. The results indicated that the temporal changes in cold extremes showed decreasing trends and warm extremes experienced increasing trends across almost all of China, with mean change rates of −3.9 days, −1.8 days, 3.7 days and 2.3 days per decade for TN10p, TX10p, TN90p and TX90p, respectively. Nighttime warming/cooling was higher than daytime warming/cooling, which indicated that trends in minimum temperature extremes are more rapid than trends in maximum temperature extremes. In addition, the temporal effect on the temperature extremes varied throughout the year, with significant increasing trends in the temporal heterogeneity of warm extremes occurring during 1992–2018. The areas with strong spatial heterogeneity of cool nights mainly included northeastern and central China, and the spatial variation on cool days was more prominent in northern China. For warm nights, the areas showing high spatial heterogeneity were mainly located in the northwestern part of China, while areas for warm days were distributed in northern China. Our results provide meaningful information for a deeper understanding of the spatiotemporal variations in temperature extremes across mainland China.


