

0 引言
森林作为陆地生态系统的核心,其稳定与健康关乎全球生态安全、气候调节与生物多样性存续。然而,森林火灾正持续威胁着这一宝贵资源(Bowman et al.,2009)。在全球气候变暖背景下,高温、干旱、雷暴等极端天气事件发生频率与强度显著增加,直接导致了全球多个林区火险期延长、火灾行为趋强、重大火灾频发,森林防火工作面临前所未有的压力与挑战(Jolly et al.,2015;Abatzoglou and Williams,2016)。雷击火作为一种由自然雷电引发的非人为火源,多发生于人迹罕至的偏远林区及复杂地形中,因其突发性和随机性而具有发现难、扑救难、易成灾的特点,已成为我国北方重点林区,特别是大兴安岭林区夏季森林火灾的最主要成因,给森林资源保护和人民生命财产安全带来巨大风险(田晓瑞等,2012;张冬有等,2012)。内蒙古大兴安岭重点国有林区属于寒温带大陆性季风气候,夏季冷暖空气活动频繁,对流旺盛,雷暴天气多发,为雷击火的发生提供了充沛的“火源”基础(赵俊卉等,2008;倪长虹和邸雪颖,2009;田晓瑞等,2009;赵俊卉等,2009;李威等,2023)。更为重要的是大兴安岭重点国有林区地形地貌复杂多样,这种复杂的地形条件不仅通过动力和热力作用深刻影响局地气象要素分布(Cochrane et al.,2012),还直接决定了可燃物类型、载量、连续性与含水率的空间格局(Parks et al.,2012)。因此,地形是链接大尺度气候背景与局部火环境、进而调控雷击火“发生-探测-蔓延-扑救”全过程的关键空间载体。深入揭示地形因子对雷击火空间分布规律与灾害行为特征的影响机制,是实现雷击火风险精准区划、监测预警关口前移、扑火资源科学调配的前提,对提升大兴安岭林区乃至全国雷击火综合防控能力具有至关重要的理论与现实意义。
关于地形与森林火灾,早期研究多集中于单一或少数几个地形因子与火灾发生率或过火面积的统计关联分析。例如:海拔高度通过对温度、降水垂直递减率的控制,间接影响可燃物干燥速率,中低海拔地区往往是火灾高发区(Syphard et al.,2008);坡度显著影响地表接收的太阳辐射、土壤水分以及火灾蔓延速率和方向,通常缓坡地带更利于火线快速推进(Rothermel,1972);向阳坡日照强、蒸发大,植被和地表枯落物更为干燥,通常火灾发生概率更高(Heyerdahl et al.,2001);地形起伏度与局地对流发展、雷暴触发点分布密切相关,并极大地制约着消防力量的接近速度和扑救效率(Narayanaraj and Wimmers,2012)。然而,现有研究多将“火灾发生”与“火灾蔓延”视为同一过程或仅关注其中之一,缺乏对二者在地形驱动上可能存在“解耦”现象的深入探讨(Du et al.,2021)。随着地理信息系统、遥感技术与数据挖掘方法的飞速发展,机器学习模型因其强大的非线性拟合和高维数据处理能力,在火灾风险预测领域得到广泛应用(Jain et al.,2020)。随机森林、支持向量机、人工神经网络以及梯度提升决策树等算法被成功用于火灾易发性评估、火险等级预测和火灾发生概率建模(Chen et al.,2015;Guo et al.,2016;焦强英等,2023;Yue et al.,2023;Song et al.,2025)。然而机器学习模型常被视为“黑箱”,其内部决策过程难以理解,模型预测结果缺乏明确的物理解释,这限制了其在需要明确因果推断和决策支持的森林防火实际业务中的深度应用(Rudin,2019)。近年来,可解释人工智能的兴起为解决此问题提供了路径,如SHAP(SHapley Additive exPlanations)有效打开了机器学习模型的“黑箱”(Lundberg et al.,2020)。将SHAP与高性能预测模型相结合,既可保证预测精度,又能深入理解各驱动因子的作用方向与强度,是当前火灾预测研究的前沿方向(聂卉和吴晓燕,2024)。此外,新兴的元启发式优化算法,如2024年最新提出的牛顿-拉夫逊优化器(Newton-Raphson-Based Optimizer,NRBO),通过模拟牛顿-拉夫逊法的搜索规则并结合群体智能的扰动策略,在连续优化问题中展现出强大的全局寻优能力和收敛速度(Sowmya et al.,2024),为优化XGBoost(eXtreme Gradient Boosting)等复杂模型的超参数提供了新的高效工具。
在森林火灾应急管理中,扑火力量的快速、科学调度是控制火势、减少损失的核心环节。扑火人数的需求预测是一个典型的回归问题,其不仅取决于直观的过火面积,更与火灾发生地的地形通达性、蔓延难度等复杂条件息息相关(Rodrigues et al.,2014)。目前,国内外的研究更多集中在火灾的发生预测和蔓延模拟上,而直接基于历史灾情数据,综合利用过火面积与精细化地形因子,通过可解释机器学习模型定量预测扑火人力需求,并清晰阐明各因素贡献的研究尚属鲜见。因此,针对内蒙古大兴安岭重点国有林区雷击火防控的重大需求,以及当前研究中存在的对地形影响雷击火机制辨析不足、预测模型可解释性弱、扑火资源需求预测研究欠缺等问题开展研究,深化对大兴安岭雷击火成灾地形机理的科学认识,为建立“空间风险精准识别-扑救需求智能预判”的雷击火防控业务化支撑体系提供直接的模型工具与决策依据,这对提升我国森林雷击火的主动防控和精准应急能力具有重要的应用价值。
1 研究区域概况
图1
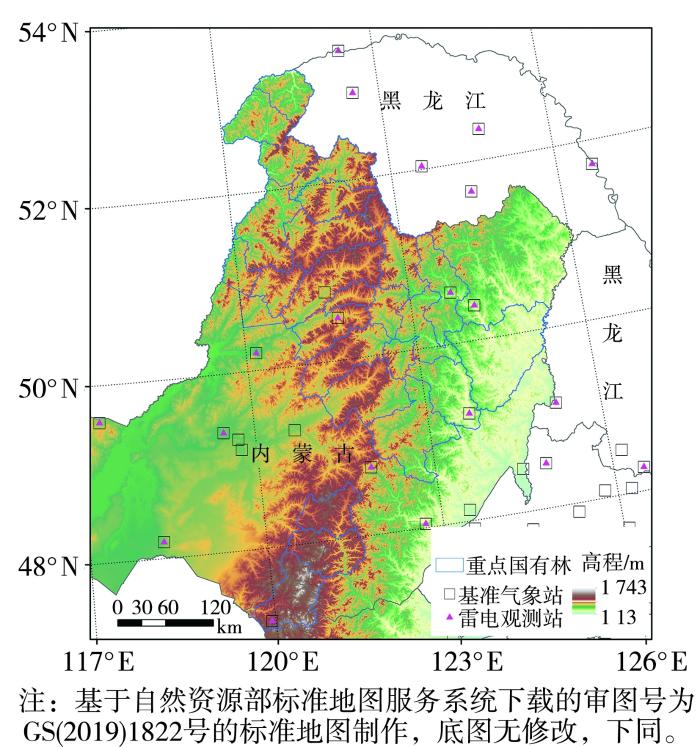
图1
研究区地形及周边气象观测站点分布
Fig.1
Topography of the study area and distribution of surrounding meteorological observation stations
2 资料与方法
2.1 资料
2015—2024年雷击火灾数据来自内蒙古森工集团防火办,包括雷击火点经纬度、火灾发生时间、过火面积、扑火人数等信息。数字高程(Digital Elevation Model,DEM)资料来自中国科学院计算机网络信息中心国际科学数据镜像网站的SRTM(Shuttle Radar Topography Mission)地形数据,分辨率为90 m;DEM主要用于提取高程、坡度、坡向、地形起伏度4种地形因子(刘晓东等,2021)。内蒙古大兴安岭重点国有林区实际高程分布为253~1 743 m,坡度区间为0°~40.6°,地形起伏度为0~368 m。本文将地形高程和起伏度划分为4级(刘晓东等,2020)、坡度划分为6级(刘爱利,2004)(表1),坡向划分为平地(-1°)、北坡(0°~22.5°和>337.5°~360.0°)、东北坡(>22.5°~67.5°)、东坡(>67.5°~112.5°)、东南坡(>112.5°~157.5°)、南坡(>157.5°~202.5°)、西南坡(>202.5°~247.5°)、西坡(>247.5°~292.5°)、西北坡(>292.5°~337.5°)共9个等级。
表1 大兴安岭重点国有林区地形因子的分级
Tab.1
| 地形因子 | 分级 | ||||||
|---|---|---|---|---|---|---|---|
| 1 | 2 | 3 | 4 | 5 | 6 | ||
| 高程/m | [200,500) | [500,1 000) | [1 000,1 500) | [1 500,2 000) | |||
| 坡度/(°) | [0,0.5) | [0.5,2) | [2,5) | [5,15) | [15,35) | [35,55) | |
| 地形起伏度/m | [0,20) | [20,75) | [75,200) | [200,600) | |||
2.2 方法
2.2.1 基于NRBO优化的XGBoost算法
本研究采用的基于NRBO(Sowmya et al.,2024)优化的XGBoost算法,是将高效全局优化技术与梯度提升决策树框架相结合的改进模型,本质是通过元启发式优化驱动机器学习模型的超参数调优,核心价值在于平衡参数搜索的全局探索与局部开发,最终提升模型泛化能力和训练效率。
XGBoost作为经典的集成学习算法(杨腾杰等,2025;万雨勤等,2026),通过迭代构建多棵浅层决策树,以加法模型逐步最小化含预测误差项与正则化项的目标函数,其性能高度依赖学习率、树最大深度等超参数的配置,传统调参方法易陷入局部最优或效率低下问题。而NRBO基于牛顿-拉夫逊方法改进而来,利用目标函数的一阶和二阶导数信息,通过迭代实现快速收敛,同时引入陷阱避免算子(Trap Avoidance Opera,TAO),有效降低陷入局部最优的风险,具备强大的全局寻优能力。因此该算法通过NRBO的精准寻优特性弥补了XGBoost的参数敏感性缺陷,同时保留了XGBoost并行计算、正则化、缺失值处理等固有优势,在结构化数据回归、分类等任务中展现出更快的收敛速度与更高的预测精度。总目标损失函数的计算公式如下:
式中:L(θ)表示总目标损失函数,θ为参数向量;
2.2.2 可解释机器学习模型
NRBO-XGBoost作为融合牛顿-拉夫逊优化与梯度提升框架的改进模型,虽通过NRBO的全局寻优提升了超参数适配性与预测精度,但仍存在集成模型固有的“黑箱”属性,而SHAP(Lundberg et al.,2020;聂卉和吴晓燕,2024)的引入为其构建了完整的可解释性体系,既保留模型性能优势,又实现决策逻辑的量化拆解与可视化呈现。从解释逻辑来看,SHAP将NRBO-XGBoost的预测过程转化为特征贡献的公平分配问题,以所有样本的平均预测值为基准,单个样本的最终预测结果可拆解为基准值与各输入特征SHAP值的加和,其中每一项SHAP精准量化了对应特征在NRBO优化后的XGBoost集成树中对预测结果偏离基准值的贡献程度,且严格遵循沙普利值的有效性、对称性等公理,确保贡献分配的合理性。本文具体以过火面积和地形因素作为自变量进行扑火资源需求建模和分析,通过SHAP方法深入理解每个变量对于雷击火扑火人数的影响程度。
3 雷击火地形因素影响分析
3.1 雷击火点在高程上的分布特征
雷击火点在高程上呈现“中低海拔集中、高/低海拔稀疏”的梯度特征(图2),83.06%的雷击火灾发生区间为500~1 000 m(表2),远超其面积占比(68.73%);76.34%的过火面积发生在500~1 000 m区间,与雷击火灾次数分布高度一致,说明该高程区间不仅是火灾高发区,也是火灾蔓延的主要区域。1 000~1 500 m中高海拔区主要分布在南部、中部局部山地,雷击火点数量较少,火点数约为核心区的1/3~1/2,呈“零散斑块”分布;该区间雷击火灾次数占比略低于面积占比,过火面积占比略高于其雷击火灾次数占比,暗示该区间一旦发生火灾,可能更容易扩散。东部低海拔区域雷击火灾影响较小,尽管面积占比为13.80%,但雷击火灾次数占比仅为2.69%,过火面积占比仅为4.02%,说明该区间火灾风险低、蔓延能力弱。南部山地高海拔区域(1 500 m以上)几乎无雷击火灾。
图2
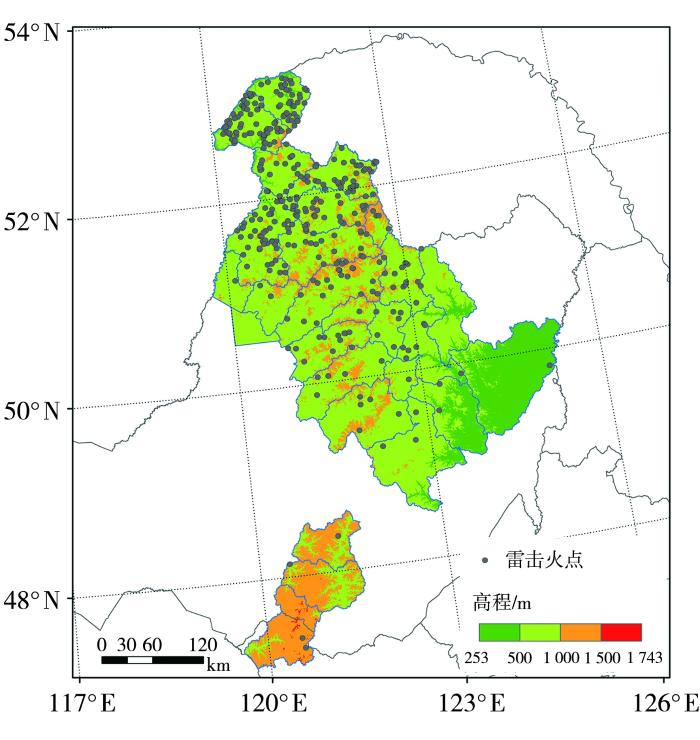
图2
雷击火点在不同高程上的空间分布
Fig.2
Spatial distribution of lightning-ignited fire points at different elevations
表2 雷击火灾次数及过火面积在不同高程区间的占比 单位:%
Tab.2
| 高程/m | 面积占比 | 雷击火灾次数占比 | 过火面积占比 |
|---|---|---|---|
| [200,500) | 13.80 | 2.69 | 4.02 |
| [500,1 000) | 68.73 | 83.06 | 76.34 |
| [1 000,1 500) | 17.32 | 14.25 | 19.64 |
| [1 500,2 000) | 0.15 | 0 | 0 |
图3为雷击火灾次数和过火面积随高程的变化曲线,可见雷击火灾次数整体呈“先增后减”的单峰分布:在300~700 m火灾次数随高程上升而增加,600~700 m达到峰值(77次),700~1 400 m火灾次数随高程上升持续下降,尤其在1 000 m以上下降趋势显著,1 200 m后火灾次数已非常少。过火面积随高程的变化呈现“多峰型”,且峰值位置与火灾次数不重合;300~500 m过火面积整体较小(<1 000 hm2);600~1 100 m过火面积出现多个峰值,其中900 m多达最大峰值(7 524.2 hm2);此外在600、800、1 100 m左右过火面积为1 000~3 000 hm2,1 200 m后降至极低水平(200 hm2以下)。
图3
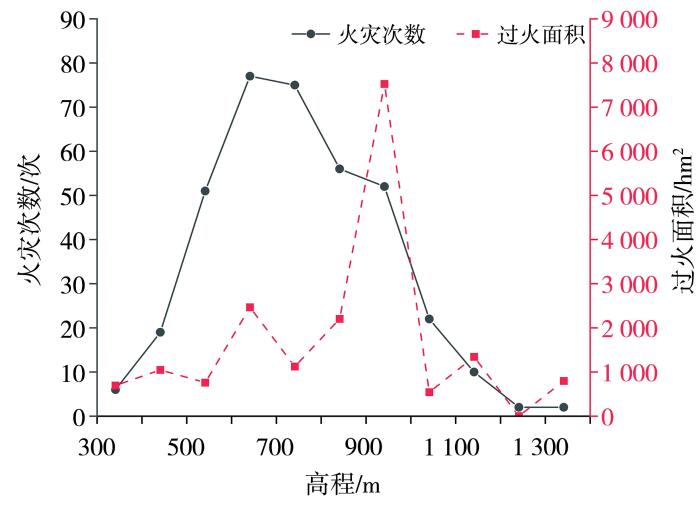
图3
雷击火灾次数和过火面积随高程的变化
Fig.3
The variation of lightning-ignited fire occurrences and burned areas with elevation
雷击火灾次数与过火面积两者无简单线性关联,体现出“火灾频率高≠过火面积大”的特征。火灾次数峰值高程区间(600~700 m)过火面积仅为中等水平(<3 000 hm2),说明该高程带火灾虽频繁,但单次火灾的烧毁面积较小;过火面积峰值区(900 m多)火灾次数仅为中等水平(约50次),说明该高程带火灾虽不频繁,但单次火灾的烧毁面积极大。在高程小于300 m和大于1 200 m时,火灾次数与过火面积均处于极低水平,反映这些高程带雷击火灾活动微弱。
图4是雷击火灾次数和过火面积的热力分布图。可见,雷击火点频次最高的区域集中在52.5°N—53.0°N和120.5°E—122.5°E,具有明显的空间异质性;火点频次最大值达30次,出现在52.5°N、121.0°E和53.0°N、121.5°E附近。从雷击火点的纬向变化看,在47.0°N—49.0°N雷击火点频次极低,几乎为零,仅个别点有值为1;在49.5°N—51.0°N雷击火点频次随着纬度升高逐步增多,在51.5°N—53.0°N火点频次最高,是主要火点活动区;53.5°N以北火点频次降至2以下。从经向变化看,120.0°E雷击火点较少;120.5°E—123.0°E是火点密集区;123.5°E—125.5°E火点频次迅速下降,值多为0或1,表明火点活动很少延伸至东部。
图4
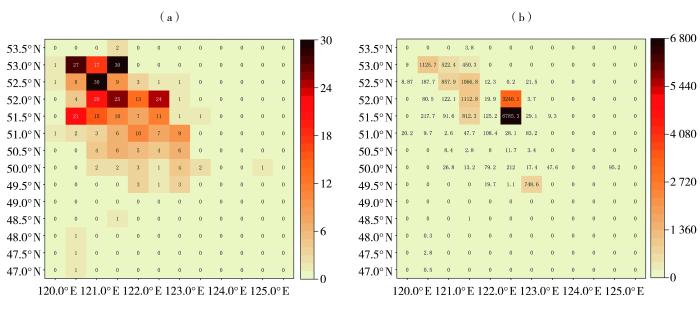
图4
雷击火灾次数(a,单位:次)和过火面积(b,单位:hm2)热力分布图
Fig.4
The heat maps of lightning-ignited fire occurrences (a, Unit: times) and burned areas (b, Unit: hm2)
与火点频次热力图不同,过火面积的绝对高值区出现在更偏南的纬度,在51.5°N、122.5°E处其值高达6 785.3 hm2,这是一个异常突出的峰值。此外,52.0°N、122.5°E处也存在一个非常大的过火面积(3 240.1 hm2),53.0°N、120.5°E处也有一个高值区(1 125.7 hm2)。可见51.5°N—53.0°N、120.5°E—122.5°E区域的火点频次高发区与过火面积高值区基本重合,与火点频次的活动中心(52.5°N、53.0°N)对比,过火面积的灾害中心南移(51.5°N)。因此,防灾减灾的关注点不能仅停留在雷击火点最密集的地方,更要警惕那些可能发生大型雷击火的区域。
3.2 雷击火点在坡度上的分布特征
由图5和表3可知,雷击火点主要集中在5.0°~35.0°的中坡度区域,低坡度(<5.0°)和高坡度(>35.0°)火点极少。火点主要分布在北部、中部的中坡度林区,东部低坡度区和南部区域火点稀疏。雷击火点核心区间为[5.0°,15.0°),这是面积占比(52.87%)最大的坡度区间,也是雷击火发生最频繁的区间(占56.72%);火点集中度略大于1(1.07),说明该区间的火点发生率与面积占比基本匹配,是雷击火的背景高发区。雷击火点高集中度区间为[15.0°,35.0°),该区间面积占比仅为9.53%,却贡献了15.86%的雷击火,火点集中度高达1.66,是所有坡度区间中最高的,表明单位面积上的雷击火风险最高;该坡度区间为“高发低燃”区,虽然雷击火发生频率高,但过火面积占比很低(4.30%),过火强度仅为0.27;说明该坡度带雷击风险高,但不易形成大火。[2.0°,5.0°)坡度区间是火灾蔓延的“高危区”,虽然只发生了17.47%的雷击火,但其过火面积占比高达37.83%,过火强度(2.16)远高于其他区间,一旦发生火灾,极易蔓延成灾。
图5
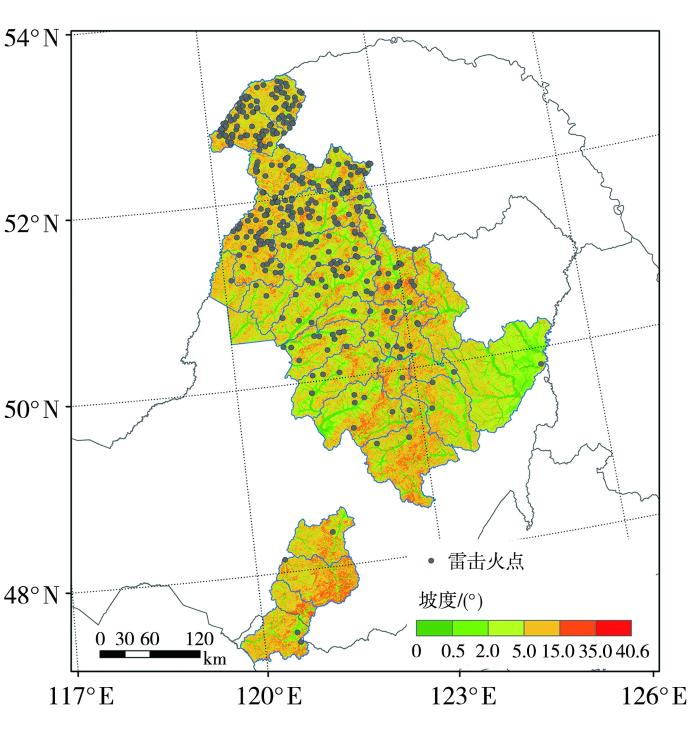
图5
雷击火点在不同坡度上的空间分布
Fig.5
The spatial distribution of lightning-ignited fire points at different slopes
表3 雷击火灾次数及过火面积在不同坡度区间的占比 单位:%
Tab.3
| 坡度/(°) | 面积占比 | 雷击火灾次数占比 | 过火面积占比 |
|---|---|---|---|
| [0,0.5) | 4.05 | 2.69 | 4.49 |
| [0.5,2.0) | 11.97 | 7.26 | 2.01 |
| [2.0,5.0) | 21.58 | 17.47 | 37.83 |
| [5.0,15.0) | 52.87 | 56.72 | 51.37 |
| [15.0,35.0) | 9.53 | 15.86 | 4.30 |
| [35.0,55.0) | 0 | 0 | 0 |
图6为雷击火灾频次和过火面积随坡度的变化曲线,可见火灾频次随坡度增加呈多峰分布:高发坡度大致为0°~14°,此区间内火灾频次始终维持高位,在坡度6°处达到峰值;坡度大于15°的陡坡区域,火灾频次迅速下降,说明中等坡度是雷击火最易发生的环境。过火面积随坡度变化也呈现多峰分布,但峰值出现的位置与火灾频次完全不同:在0°~12°的缓坡范围内,过火面积总体较高,在坡度约3°处出现一个极其突出的峰值,远高于其他任何坡度;当坡度超过13°后,过火面积急剧下降;坡度大于15°的地区,尽管火灾频次较高,但过火面积始终维持在很低的水平;可见最容易着火的地方,并不是最容易烧成大火的地方。雷击火发生环节可能由雷电物理机制和可燃物分布主导,在中坡度最活跃;蔓延环节可能由地形和可燃物连续性主导,在极缓坡最危险。
图6
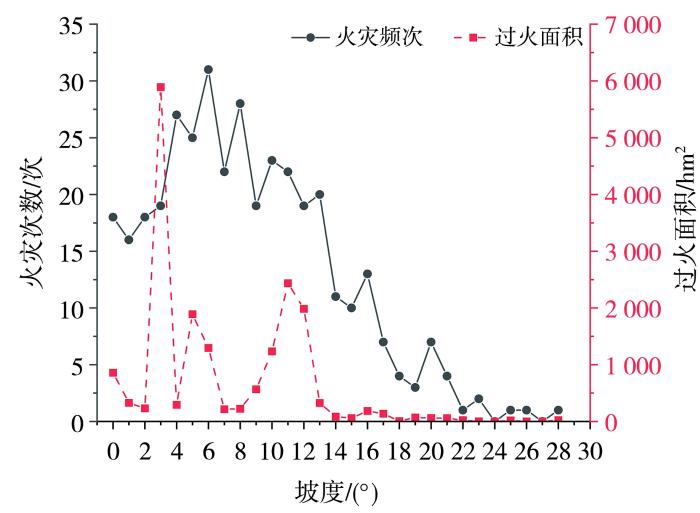
图6
雷击火灾频次和过火面积随坡度的变化
Fig.6
The change of lightning-ignited fire occurrences and burned areas with slope
3.3 雷击火点在地形起伏度上的分布特征
图7
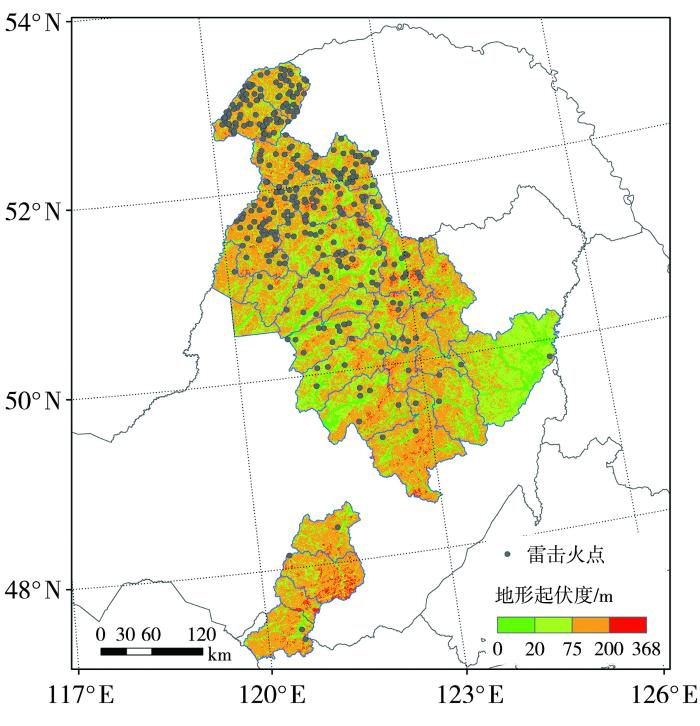
图7
雷击火点在不同地形起伏度上的空间分布
Fig.7
The spatial distribution of lightning-ignited fire points on different terrain relief degrees
表4 雷击火灾次数及过火面积在不同地形起伏度区间上的占比 单位:%
Tab.4
| 地形起伏度/m | 面积占比 | 雷击火灾次数占比 | 过火面积占比 |
|---|---|---|---|
| [0,20) | 7.96 | 5.65 | 2.14 |
| [20,75) | 30.45 | 19.62 | 38.48 |
| [75,200) | 59.41 | 70.97 | 47.67 |
| [200,600) | 2.18 | 3.76 | 11.71 |
过火面积的“异常区间”为[20,75)m,虽然只发生了19.62%的雷击火灾,但其过火面积占比高达38.48%,仅次于[75,200)m区间;火灾蔓延效率(1.96)4个区间中最高,表明平均每一次雷击火灾所烧毁的面积远大于其他区域。[200,600)m高起伏区间面积占比仅2.18%,雷击火灾次数占比(3.76%)略高于其面积占比,但其过火面积占比(11.71%)远超火灾次数,表明在极高起伏地区,虽然雷击火发生的绝对数量不多,但很容易发展成难以控制的大火,原因可能是地形极其复杂,救火力量难以抵达,火势可以在人迹罕至的山谷中自由发展;该区间蔓延效率(3.11)最高,印证了这一点。[0,20)m平坦区间火灾次数和过火面积占比均远低于其面积占比,在所有地形中最安全,说明平坦地区不易形成局地雷暴,即使发生火灾也易于发现和扑救。
由图8可知,雷击火点次数与过火面积的高值区是错位的,火点次数在50~170 m的地形起伏度区间维持相对高值,在高于170 m的区域,火点次数迅速下降。过火面积在40 m的缓起伏区达到了一个非常突出的高值,而在高起伏区过火面积虽然绝对量不高,但相对于极少的火点次数,其单场火灾的规模非常大。
图8
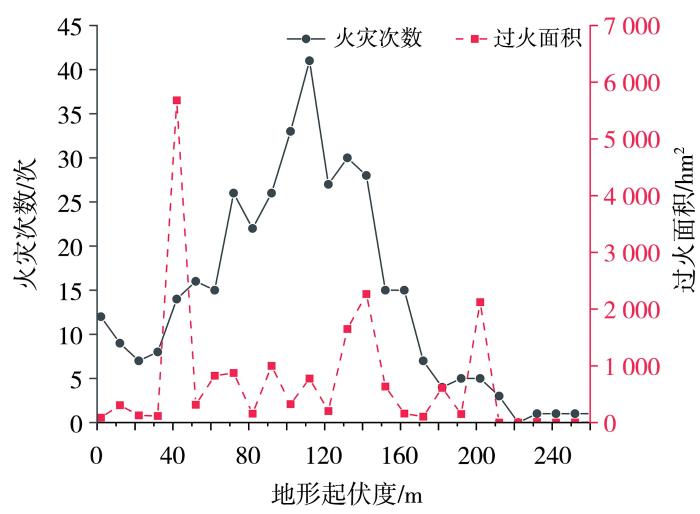
图8
雷击火灾次数和过火面积随地形起伏度的变化
Fig.8
The variation of the number of lightning-ignited fires and burned area with terrain relief degree
3.4 雷击火点在坡向上的分布特征
图9和表5揭示了雷击火的发生与坡向密切相关,并且火灾次数和过火面积在不同坡向上呈现出复杂且不完全一致的特征。雷击火灾最频繁的坡向为南坡(16.67%)、西南坡(15.86%)、东南坡(15.59%),表明阳坡是雷击火最易发生的区域;其次为西坡(13.17%)、东坡(11.83%)、东北坡(11.56%),西北坡(9.68%),北坡(5.65%)火灾次数明显减少,平地上几乎没有雷击火灾。西坡过火面积占比最大(30.08%),远超其他所有坡向,是火灾破坏最严重的区域;北坡(16.20%)、西北坡(13.69%)、东南坡(11.53%)、东坡(11.35%)为次严重区,西南坡(6.99%)、东北坡(5.34%)、南坡(4.81%)过火面积相对较小。可见火灾易发区(南坡、西南坡)不一定是火灾重灾区,而某些火灾次数中等的坡向(如西坡、北坡)一旦起火,燃烧面积却非常大。可能原因是西坡午后气温最高,植被经过一天日照后最为干燥,火势一旦发生,极易迅速蔓延;北坡虽然不易起火,但通常植被茂密、可燃物载量大,且湿度较高可能导致燃烧不完全、持续时间长的阴燃,一旦起风易转为树冠火,导致过火面积巨大。
图9
图9
雷击火点在不同坡向上的空间分布
Fig.9
The spatial distribution of lightning-ignited fire points on different slope aspects
表5 雷击火灾次数及过火面积在不同坡向上的占比 单位:%
Tab.5
| 坡向 | 面积占比 | 雷击火灾次数占比 | 过火面积占比 |
|---|---|---|---|
| 平地 | 0.59 | 0 | 0 |
| 北坡 | 11.37 | 5.65 | 16.20 |
| 东北坡 | 13.06 | 11.56 | 5.34 |
| 东坡 | 13.49 | 11.83 | 11.35 |
| 东南坡 | 12.50 | 15.59 | 11.53 |
| 南坡 | 11.78 | 16.67 | 4.81 |
| 西南坡 | 12.48 | 15.86 | 6.99 |
| 西坡 | 12.71 | 13.17 | 30.08 |
| 西北坡 | 12.03 | 9.68 | 13.69 |
4 基于NRBO-XGBoost模型的雷击火扑火因素预测
4.1 NRBO-XGBoost模型回归结果
进一步分析雷击火扑火因素的影响特征,依据2015—2024年雷击火灾数据建立的371例样本,选取扑火人数作为因变量,过火面积和地形因素作为自变量,建立基于NRBO-XGBoost的雷击火扑火预测模型。为使模型在训练集和测试集上具备一致性能表现,采用随机拆分策略将数据集按7∶3比例分配为训练集与测试集。
为评估样本的代表性及模型的泛化能力,首先对全量样本数据进行Z-score标准化处理,随后通过主成分分析提取关键特征。结果显示前两个主成分累计解释了原始数据57.6%的方差信息(图10),其中主成分1的方差贡献率为35.2%,主成分2为22.4%,表明二维投影空间可有效保留原始数据的核心结构特征,为后续分析提供了可靠的降维基础。由图10可知,测试集样本未形成孤立聚类,而是均匀散布并嵌入于训练集样本构成的分布区域内部,且两类样本的特征空间跨度基本一致;这一现象表明,测试集的特征分布模式主要落在模型已学习的知识边界内,所采用的随机划分策略能够有效保证训练集与测试集的分布同质性,为模型泛化性能的公正评估提供了数据支撑。值得注意的是,尽管部分样本处于数据分布的稀疏区域,但模型在整体测试集上仍维持了较低的均方根误差。这一结果证实,经NRBO算法优化后的XGBoost模型具备优良的拟合平滑性,即便在特征分布的边界区域也能做出鲁棒性推断,未出现因过拟合导致的边界预测性能崩塌问题,进一步验证了模型泛化能力的可靠性。
图10
采用NRBO算法对XGBoost模型的参数进行寻优,XGBoost模型主要优化参数取值范围:迭代树数量为[75,200],树的最大深度为[2,8],学习率为[0.01,0.20],正则化系数为[0.1,5.0],最小叶子节点权重为[1,10];NRBO算法的种群规模为30,最大迭代次数为50。确定扑火人数预测的最优参数组合:树数量为254、最大树深为8、学习率为0.18、正则化系数为3.34、最小叶子节点权重为1,寻优迭代曲线见图11。可以看出适应度值在迭代初期迅速下降,并在第9次迭代后趋于稳定,表明算法具有较强的全局搜索能力,成功避免了陷入局部最优,找到了最佳参数组合。模型预测结果如图12所示。
图11
图12
图12
训练集(a)和测试集(b)模型预测结果
Fig.12
The prediction results of the model for the training set (a) and the test set (b)
图13
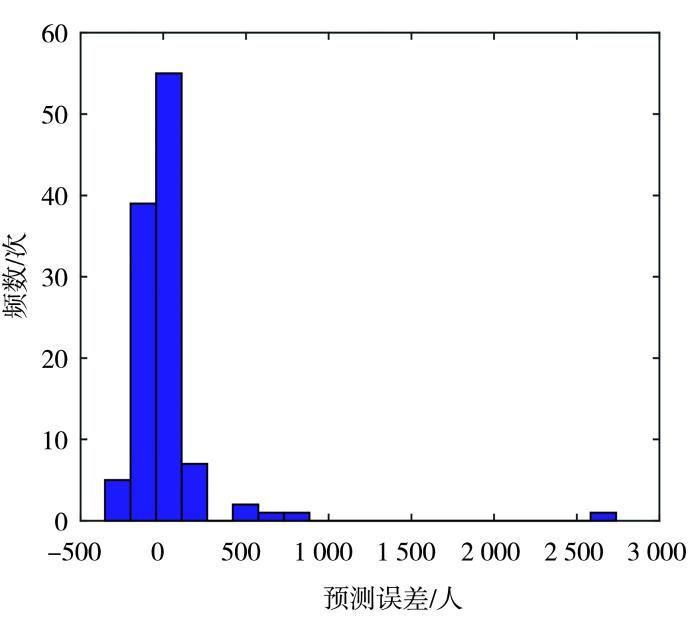
图14
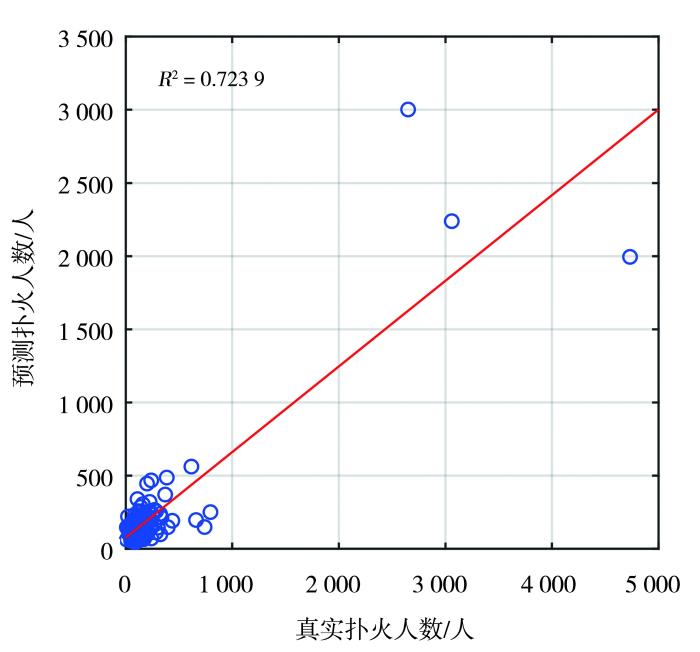
图15
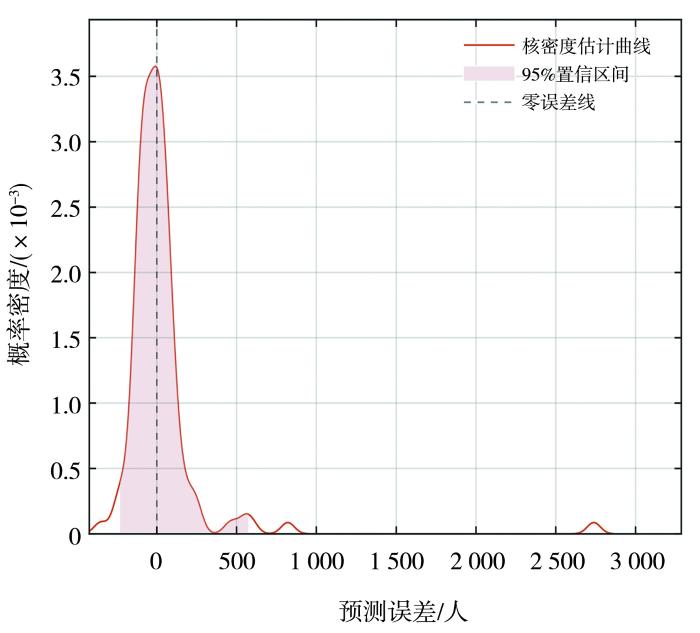
图15
区间预测的核密度估计曲线
Fig.15
The kernel density estimation curve of interval prediction
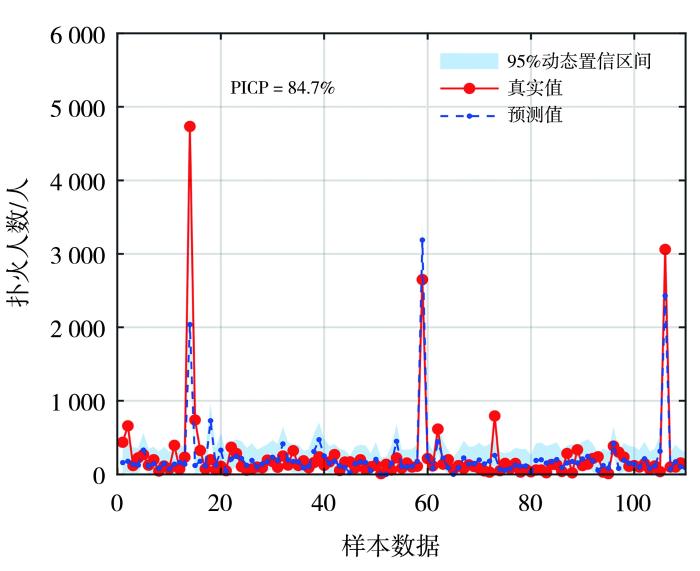
图16
4.2 基于SHAP的模型解释结果
图17为扑火影响因素SHAP值分布及重要性排序,可知各特征因子重要性排序为过火面积>高程>起伏度>坡度>坡向,表明在当前数据集下,过火面积是主导因素,其贡献度显著高于其他指标。高程和起伏度的影响也较明显,坡向和坡度的影响则相对较小。过火面积的SHAP值大部分为正值,且特征值越高SHAP值越大,表明过火面积对扑火人数存在显著正向影响;高程的低SHAP值集中分布在0附近,而高SHAP值集中分布于正半轴,意味着低高程对预测值影响较弱,而高高程倾向于提升预测值;起伏度的SHAP值大部分分布于正半轴,总体呈正相关趋势,即地形越崎岖,越倾向于需要更多人;坡度和坡向的SHAP值集中分布在0附近且波动极小,说明两者重要性最低且对预测结果几乎没有明显影响。
图17
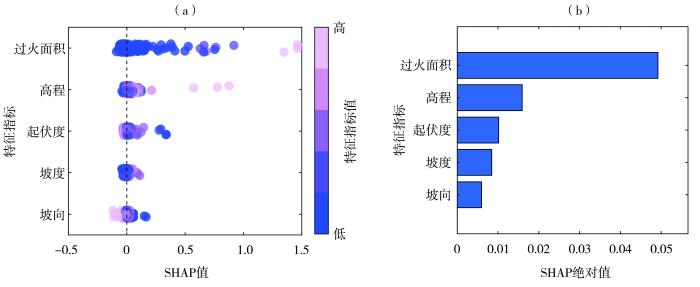
图17
扑火影响因素SHAP值分布(a)及重要性排序(b)
Fig.17
The SHAP value distribution (a) and importance ranking (b) of wildfire suppression influencing factors
为了进一步量化不同地形与火险因子间的非线性交互对过火面积预测模型输出的贡献强度,图18给出了扑火影响因素对应目标特征-交互特征组合的SHAP交互作用值,其中坡度与起伏度的交互强度最高,交互值达0.43;坡向与起伏度之间也存在极强的内部交互,交互值达0.28,可见起伏度是地形多因子协同的核心。在地形因子与过火面积的交互中,起伏度与过火面积的交互强度最高,交互值达0.33,揭示了地形复杂性对火灾空间范围的直接调控作用。
图18
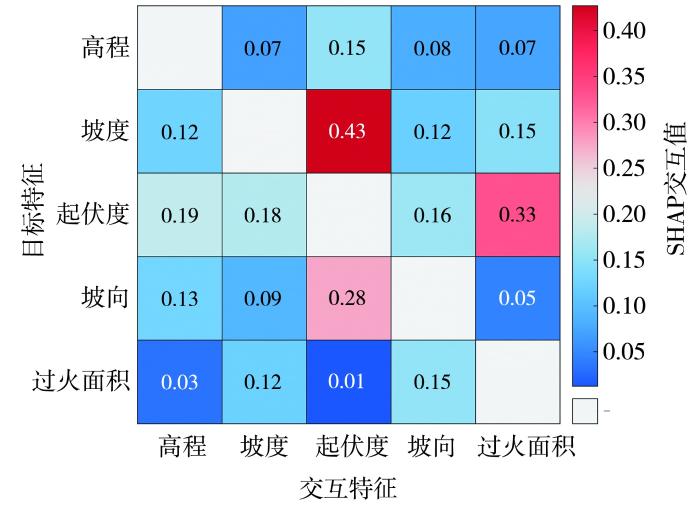
图18
扑火影响因素全局SHAP 特征交互矩阵
Fig.18
Global SHAP feature interaction matrix for wildfire suppression influencing factors
5 结论与讨论
本文采用内蒙古大兴安岭重点国有林区2015—2024年雷击火灾历史数据和高精度地形数据,运用数理统计方法分析了地形对雷击火的影响特征,并基于NRBO-XGBoost-SHAP方法进行了雷击火扑火需求模型的建模和分析,得到如下具体结论。
1)500~1 000 m中低海拔区覆盖研究区中部、北部主体区域,且是雷击火点的高密度分布带,53.0°N区域是“高频次、大面积”火灾风险区。
2)雷击火高频着火区集中在6°左右坡度,而大火蔓延区集中在3°左右坡度。陡坡(>15°)存在雷击火高发生风险,低蔓延风险;缓坡(<10°,尤其是3°)一旦着火,即具高蔓延风险。
3)[75,200)m中等起伏地形是发生雷击火的“最优”环境,[20,75)m的缓起伏地形和[200,600)m的高起伏地形表现出“单次火灾过火面积更大”的特点。
4)南坡(面积占比11.78%)贡献了16.67%的火灾,属于火灾高风险区;西坡(面积占比12.71%)贡献了30.08%的过火面积,属于火灾高影响区。
5)过火面积对扑火人数的影响幅度较大且以正向影响为主,高程和起伏度的影响幅度也较明显,坡向和坡度的影响幅度则相对较小。
本研究仅聚焦地形因子对雷击火分布及扑火人数的影响,未纳入雷电活动、气象要素、可燃物等其他影响因素,可能对雷击火发生机制及影响因素的解释不够全面。此外,模型建立未考虑扑火时机、装备水平、交通条件等人为因素,后续将融合雷电、气象多源数据及应急管理业务数据,探究多要素协同作用机制,进而建立雷击火风险预警与扑火资源优化配置模型,进一步提升研究的实践指导价值。
参考文献
结合梯度提升树算法与可解释机器学习模型SHAP的抑郁症影响因素研究
[J].
【目的】本研究旨在探讨构建抑郁严重度预测模型及其解释性问题,通过分析互联网用户生成的内容,进一步发展抑郁症风险预测研究,从而提高抑郁症自动检测模型的可靠性和实用性。【方法】通过收集“好大夫在线”平台上的抑郁症医疗咨询文本记录,构建了一个语料库。利用心理学词典,从中提取了患者的心理特征,并采用梯度提升树算法预测患者的病情,同时引入可解释机器学习方法SHAP解读模型,借助SHAP独特的可视化图表剖析患者年龄、性别、认知、情感、感知、社会家庭及个人得失与抑郁症发生之间的复杂关系。【结果】抑郁症患者心理状态能反馈患者病况,利用从患者问诊记录中提取的心理特征能够有效检测重度抑郁,准确率达到86%。可解释机器学习模型SHAP解释了模型的预测结果,揭示出患者各层面心理特征对抑郁症发生产生的多重效应。【局限】受语料集所限,仅利用单次问诊记录对抑郁程度做预测;而模型特征基于心理学词典,更多与抑郁症发生风险有关的要素可纳入建模考虑中。【结论】影响抑郁症产生及发展的因素复杂。个体差异致使各项特征对于疾病预测产生不同效应。构建抑郁症的自动诊断模型,不仅要关注模型的精准度,更需增强对模型预测的理解。
基于NRBO-XGBoost和ABKDE融合可解释模型的TBM掘进速度预测
[J].
Impact of anthropogenic climate change on wildfire across western US forests
[J].
Fire in the Earth system
[J].Fire is a worldwide phenomenon that appears in the geological record soon after the appearance of terrestrial plants. Fire influences global ecosystem patterns and processes, including vegetation distribution and structure, the carbon cycle, and climate. Although humans and fire have always coexisted, our capacity to manage fire remains imperfect and may become more difficult in the future as climate change alters fire regimes. This risk is difficult to assess, however, because fires are still poorly represented in global models. Here, we discuss some of the most important issues involved in developing a better understanding of the role of fire in the Earth system.
Modeling forest lightning fire occurrence in the Daxinganling Mountains of northeastern China with MAXENT
[J].
Estimation of wildfire size and risk changes due to fuels treatments
[J].Human land use practices, altered climates, and shifting forest and fire management policies have increased the frequency of large wildfires several-fold. Mitigation of potential fire behaviour and fire severity have increasingly been attempted through pre-fire alteration of wildland fuels using mechanical treatments and prescribed fires. Despite annual treatment of more than a million hectares of land, quantitative assessments of the effectiveness of existing fuel treatments at reducing the size of actual wildfires or how they might alter the risk of burning across landscapes are currently lacking. Here, we present a method for estimating spatial probabilities of burning as a function of extant fuels treatments for any wildland fire-affected landscape. We examined the landscape effects of more than 72 000 ha of wildland fuel treatments involved in 14 large wildfires that burned 314 000 ha of forests in nine US states between 2002 and 2010. Fuels treatments altered the probability of fire occurrence both positively and negatively across landscapes, effectively redistributing fire risk by changing surface fire spread rates and reducing the likelihood of crowning behaviour. Trade offs are created between formation of large areas with low probabilities of increased burning and smaller, well-defined regions with reduced fire risk.
Dynamic risk assessment of wildfire based on integrating multi-source data and a random forest algorithm: A case study of Chongqing, China
[J].
Comparison of six generalized linear models for occurrence of lightning-induced fires in northern Daxing’an Mountains, China
[J].
Spatial controls of historical fire regimes: A multiscale example from the interior west, USA
[J].
A review of machine learning applications in wildfire science and management
[J].Artificial intelligence has been applied in wildfire science and management since the 1990s, with early applications including neural networks and expert systems. Since then, the field has rapidly progressed congruently with the wide adoption of machine learning (ML) methods in the environmental sciences. Here, we present a scoping review of ML applications in wildfire science and management. Our overall objective is to improve awareness of ML methods among wildfire researchers and managers, as well as illustrate the diverse and challenging range of problems in wildfire science available to ML data scientists. To that end, we first present an overview of popular ML approaches used in wildfire science to date and then review the use of ML in wildfire science as broadly categorized into six problem domains, including (i) fuels characterization, fire detection, and mapping; (ii) fire weather and climate change; (iii) fire occurrence, susceptibility, and risk; (iv) fire behavior prediction; (v) fire effects; and (vi) fire management. Furthermore, we discuss the advantages and limitations of various ML approaches relating to data size, computational requirements, generalizability, and interpretability, as well as identify opportunities for future advances in the science and management of wildfires within a data science context. In total, to the end of 2019, we identified 300 relevant publications in which the most frequently used ML methods across problem domains included random forests, MaxEnt, artificial neural networks, decision trees, support vector machines, and genetic algorithms. As such, there exists opportunities to apply more current ML methods — including deep learning and agent-based learning — in the wildfire sciences, especially in instances involving very large multivariate datasets. We must recognize, however, that despite the ability of ML models to learn on their own, expertise in wildfire science is necessary to ensure realistic modelling of fire processes across multiple scales, while the complexity of some ML methods such as deep learning requires a dedicated and sophisticated knowledge of their application. Finally, we stress that the wildfire research and management communities play an active role in providing relevant, high-quality, and freely available wildfire data for use by practitioners of ML methods.
Climate-induced variations in global wildfire danger from 1979 to 2013
[J].Jolly, W. Matt; Freeborn, Patrick H. US Forest Serv, Rocky Mt Res Stn, Fire Sci Lab, Missoula, MT 59803 USA. Cochrane, Mark A.; Freeborn, Patrick H. S Dakota State Univ, GSCE, Brookings, SD 57007 USA. Holden, Zachary A. US Forest Serv Reg 1, Missoula, MT 59802 USA. Brown, Timothy J. Western Reg Climate Ctr, DRI, Reno, NV 89512 USA. Williamson, Grant J.; Bowman, David M. J. S. Univ Tasmania, Sch Biol Sci, Hobart, Tas 7001, Australia.
From local explanations to global understanding with explainable AI for trees
[J].Tree-based machine learning models such as random forests, decision trees, and gradient boosted trees are popular non-linear predictive models, yet comparatively little attention has been paid to explaining their predictions. Here, we improve the interpretability of tree-based models through three main contributions: 1) The first polynomial time algorithm to compute optimal explanations based on game theory. 2) A new type of explanation that directly measures local feature interaction effects. 3) A new set of tools for understanding global model structure based on combining many local explanations of each prediction. We apply these tools to three medical machine learning problems and show how combining many high-quality local explanations allows us to represent global structure while retaining local faithfulness to the original model. These tools enable us to i) identify high magnitude but low frequency non-linear mortality risk factors in the US population, ii) highlight distinct population sub-groups with shared risk characteristics, iii) identify non-linear interaction effects among risk factors for chronic kidney disease, and iv) monitor a machine learning model deployed in a hospital by identifying which features are degrading the model's performance over time. Given the popularity of tree-based machine learning models, these improvements to their interpretability have implications across a broad set of domains.
Modeling the influence of topographic roughness on fire spread
[J].
Spatial bottom-up controls on fire likelihood vary across western North America
[J].
Modeling the spatial variation of the explanatory factors of human-caused wildfires in Spain using geographically weighted logistic regression
[J].
A mathematical model for predicting fire spread in wildland fuels
[R].
Stop explaining black box machine learning models for high stakes decisions and use interpretable models instead
[J].Black box machine learning models are currently being used for high stakes decision-making throughout society, causing problems throughout healthcare, criminal justice, and in other domains. People have hoped that creating methods for explaining these black box models will alleviate some of these problems, but trying to black box models, rather than creating models that are in the first place, is likely to perpetuate bad practices and can potentially cause catastrophic harm to society. There is a way forward - it is to design models that are inherently interpretable. This manuscript clarifies the chasm between explaining black boxes and using inherently interpretable models, outlines several key reasons why explainable black boxes should be avoided in high-stakes decisions, identifies challenges to interpretable machine learning, and provides several example applications where interpretable models could potentially replace black box models in criminal justice, healthcare, and computer vision.
Interpretable artificial intelligence models for predicting lightning prone to inducing forest fires
[J].
Newton-Raphson-based optimizer: A new population-based metaheuristic algorithm for continuous optimization problems
[J].
Predicting spatial patterns of fire on a southern California landscape
[J].Humans influence the frequency and spatial pattern of fire and contribute to altered fire regimes, but fuel loading is often the only factor considered when planning management activities to reduce fire hazard. Understanding both the human and biophysical landscape characteristics that explain how fire patterns vary should help to identify where fire is most likely to threaten values at risk. We used human and biophysical explanatory variables to model and map the spatial patterns of both fire ignitions and fire frequency in the Santa Monica Mountains, a human-dominated southern California landscape. Most fires in the study area are caused by humans, and our results showed that fire ignition patterns were strongly influenced by human variables. In particular, ignitions were most likely to occur close to roads, trails, and housing development but were also related to vegetation type. In contrast, biophysical variables related to climate and terrain (January temperature, transformed aspect, elevation, and slope) explained most of the variation in fire frequency. Although most ignitions occur close to human infrastructure, fires were more likely to spread when located farther from urban development. How far fires spread was ultimately related to biophysical variables, and the largest fires in southern California occurred as a function of wind speed, topography, and vegetation type. Overlaying predictive maps of fire ignitions and fire frequency may be useful for identifying high-risk areas that can be targeted for fire management actions.
Assessment of wildfire susceptibility and wildfire threats to ecological environment and urban development based on GIS and multi-source data: A case study of Guilin, China
[J].The frequent occurrence and spread of wildfires pose a serious threat to the ecological environment and urban development. Therefore, assessing regional wildfire susceptibility is crucial for the early prevention of wildfires and formulation of disaster management decisions. However, current research on wildfire susceptibility primarily focuses on improving the accuracy of models, while lacking in-depth study of the causes and mechanisms of wildfires, as well as the impact and losses they cause to the ecological environment and urban development. This situation not only increases the uncertainty of model predictions but also greatly reduces the specificity and practical significance of the models. We propose a comprehensive evaluation framework to analyze the spatial distribution of wildfire susceptibility and the effects of influencing factors, while assessing the risks of wildfire damage to the local ecological environment and urban development. In this study, we used wildfire information from the period 2013–2022 and data from 17 susceptibility factors in the city of Guilin as the basis, and utilized eight machine learning algorithms, namely logistic regression (LR), artificial neural network (ANN), K-nearest neighbor (KNN), support vector regression (SVR), random forest (RF), gradient boosting decision tree (GBDT), light gradient boosting machine (LGBM), and eXtreme gradient boosting (XGBoost), to assess wildfire susceptibility. By evaluating multiple indicators, we obtained the optimal model and used the Shapley Additive Explanations (SHAP) method to explain the effects of the factors and the decision-making mechanism of the model. In addition, we collected and calculated corresponding indicators, with the Remote Sensing Ecological Index (RSEI) representing ecological vulnerability and the Night-Time Lights Index (NTLI) representing urban development vulnerability. The coupling results of the two represent the comprehensive vulnerability of the ecology and city. Finally, by integrating wildfire susceptibility and vulnerability information, we assessed the risk of wildfire disasters in Guilin to reveal the overall distribution characteristics of wildfire disaster risk in Guilin. The results show that the AUC values of the eight models range from 0.809 to 0.927, with accuracy values ranging from 0.735 to 0.863 and RMSE values ranging from 0.327 to 0.423. Taking into account all the performance indicators, the XGBoost model provides the best results, with AUC, accuracy, and RMSE values of 0.927, 0.863, and 0.327, respectively. This indicates that the XGBoost model has the best predictive performance. The high-susceptibility areas are located in the central, northeast, south, and southwest regions of the study area. The factors of temperature, soil type, land use, distance to roads, and slope have the most significant impact on wildfire susceptibility. Based on the results of the ecological vulnerability and urban development vulnerability assessments, potential wildfire risk areas can be identified and assessed comprehensively and reasonably. The research results of this article not only can improve the specificity and practical significance of wildfire prediction models but also provide important reference for the prevention and response of wildfires.

