

0 引言
干旱指数是开展干旱监测与评估的重要工具,目前已被广泛应用于干旱持续时间、强度及空间范围的研究(李淑萍等,2015;高婧等,2024)。现有干旱指数在理论基础和数据依赖方面各有侧重:标准化降水指数(Standardized Precipitation Index,SPI)(McKee et al.,1993)仅依赖降水数据,计算简单,且能反映不同时间尺度的干旱特征(王辉等,2025);帕默尔干旱指数(Palmer Drought Severity Index,PDSI)(Palmer,1965)基于水量平衡原理,更适用于长期干旱监测;标准化降水蒸散指数(Standardized Precipitation Evapotranspiration Index,SPEI)(Vicente-Serrano et al.,2010)在计算中引入蒸散发,其结果对蒸散发计算方法较为敏感;国家气候中心发布的气象综合干旱指数(Meteorological Composite Index,MCI)(全国气候与气候变化标准化技术委员会,2017)已实现逐日干旱监测应用,但计算中季节尺度降水权重较大,导致干旱时空变化响应相对滞后。
尽管SPI指数在干旱研究中应用广泛,但仍存在一定局限性,难以满足高时空分辨率监测需求。首先,现有SPI研究主要集中在月尺度以上,日尺度SPI数据集在干旱时空变化特征研究和业务监测中的应用仍有不足(Zhang et al.,2023);其次,月、季、年尺度SPI虽能有效表征长期干旱过程,但时间分辨率较低,对降水异常的响应存在滞后性,难以捕捉骤旱及旱涝急转快速演变过程(Moreira et al.,2015;谢五三等,2019)。针对上述不足,Zhang等(2023)基于中国区域地面气象要素驱动数据集(China Meteorological Forcing Dataset,CMFD)开发了适用于中国区域的高时空分辨率(水平分辨率0.1°×0.1°)日尺度SPI数据集。尽管该数据集在部分地区受观测站点稀缺的影响,但经过改进在识别长期和短期干旱方面表现良好,对骤旱过程具有更高敏感性。相关研究表明,高分辨率日尺度SPI在干旱时空演变过程中对于捕捉干旱事件的起始时间及演变过程具有明显优势(Wang et al.,2022)。
基于此,本文利用欧洲中期天气预报中心的ERA5日降水再分析资料计算逐日SPI,并采用卷积神经网络(Convolutional Neural Network,CNN)方法进行空间降尺度处理,以提升数据的空间分辨率和原位适用性,构建中国区域高时空分辨率(水平分辨率0.05°×0.05°)SPID-ERA5数据集,并以黄河中上游地区为研究区域,基于地面气象站观测资料对SPID-ERA5数据集在干旱时空演变特征的适用性进行评估,旨在为区域气象干旱监测与预警,以及农业、生态环境和水资源管理提供可靠的数据支撑和科学依据。
1 研究区域、数据来源与研究方法
图1
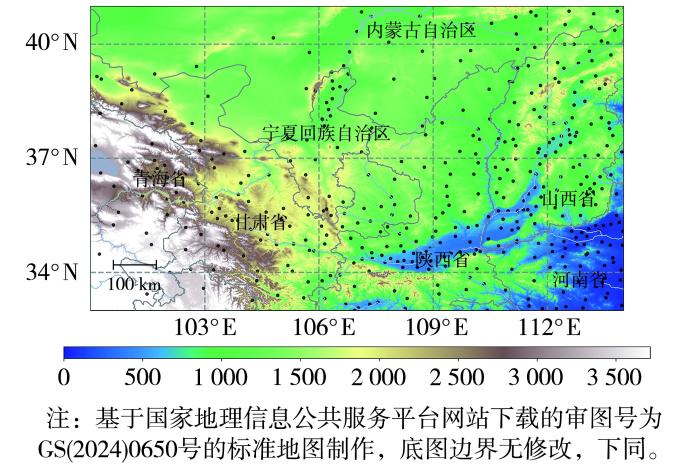
图1
黄河中上游地区地形高度(填色,单位:m)及气象观测站点分布(黑色圆点)
Fig.1
The topography of the middle and upper reaches of the Yellow River (the color shaded,Unit: m) and distribution of meteorological stations (black circles)
1.1 数据来源
所用数据包括:1)国家气象信息中心提供的1979—2021年黄河中上游地区420个气象站SPI月数据及287站MCI日数据。其中,逐月SPI用于识别黄河中上游地区的典型干旱事件,逐日MCI用于对比分析干旱过程的演变特征。2)欧洲中期天气预报中心提供的1979—2024年ERA5日降水再分析数据(Hersbach et al.,2020),水平分辨率为0.25°×0.25°;以及ERA5-Land月平均蒸发再分析数据集(Muñoz-Sabater et al.,2021),水平分辨率为0.1°×0.1°。3)英国东安格利亚大学气候研究单位(Climatic Research Unit,CRU)提供的月尺度气温和降水数据集(Harris et al.,2020),水平分辨率为0.5°×0.5°。
1.2 研究方法
计算该指数时,首先选取同一时间尺度的降水序列,并采用概率分布函数对其进行拟合。随后,根据给定降水量对应的累积概率,将其映射到标准正态分布空间,其对应的正太分布分位值即为标准化降水指数。在SPI计算中,伽马分布因能较好刻画降水量的非负性和偏态特征,通常被作为首选拟合分布,其概率密度函数表达式如下:
式中:g(x)为伽马分布的概率密度函数;x为降水量,单位为mm;α是形状参数;β是尺度参数;
对降水密度函数积分,得到降水分布函数G(x),表达式如下:
式中:s是积分变量,物理意义与x一致;G(x)表示降水量小于或等于x的概率。由于实际月降水量存在为0的值,因此需要对降水分布函数进行修正,修正后的分布函数如下:
式中:q为降水为0的概率。根据标准正态分布,概率分布函数如下:
式中:Φ(t)是随机变量小于或等于t的概率;
表1 标准化降水指数干旱等级划分
Tab.1
| SPI数值范围 | 干旱等级 |
|---|---|
| SPI≥2.0 | 极端湿润 |
| 1.5≤SPI<2.0 | 重度湿润 |
| 1.0≤SPI<1.5 | 中度湿润 |
| 0.5<SPI<1.0 | 轻度湿润 |
| -0.5≤SPI≤0.5 | 正常 |
| -1.0≤SPI<-0.5 | 轻度干旱 |
| -1.5≤SPI<-1.0 | 中度干旱 |
| -2.0≤SPI<-1.5 | 重度干旱 |
| SPI≤-2.0 | 极端干旱 |
值得注意的是,日尺度SPI与传统的月尺度SPI存在差异,其计算采用的是30 d滑动时间窗口向前累积的降水量,而非固定自然月的总降水量。该方法能够生成连续的逐日SPI序列,时间分辨率更高,更有利于识别突发干旱事件。
1.2.1 气象干旱综合指数
表2 气象干旱综合指数干旱等级划分
Tab.2
| MCI数值范围 | 干旱等级 |
|---|---|
| MCI>-0.5 | 无旱 |
| -1.0<MCI≤-0.5 | 轻度干旱 |
| -1.5<MCI≤-1.0 | 中度干旱 |
| -2.0<MCI≤-1.5 | 重度干旱 |
| MCI≤-2.0 | 极度干旱 |
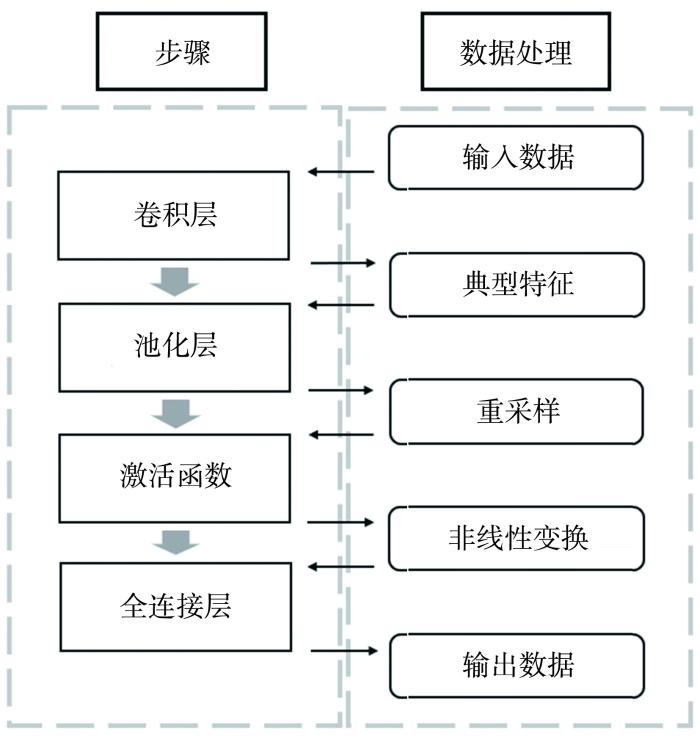
1.2.2 降尺度方法
CNN在气象数据空间降尺度研究中表现突出,能有效学习气候变量的空间结构特征,不仅可以较好再现季节平均气候及季节循环的地理分布特征,还能显著减小温度和降水在平均值及极端百分位数上的系统偏差,并在校准期与独立验证期之间表现出较高的稳定性。此外,CNN在刻画温度季节变化特征和重建日降水频率分布方面也具有明显优势(Sun and Lan,2021)。
本文采用基于CNN的方法对初步获得的格点干旱指数进行空间降尺度处理(图2)。模型基于PyTorch深度学习框架构建具有3个隐藏层的神经网络结构,并采用修正线性单元(Rectified Linear Unit,ReLU)作为激活函数。CNN通过卷积层对输入格点数据进行卷积运算,以提取数据的空间特征信息;随后通过池化层对特征进行重采样,减少数据维度并保留关键特征;在此过程中将干旱指数加载并转化成Pandas DataFrame,随后对其进行排序并预处理成神经网络训练所需的格式。每个站点的模型参数都通过随机梯度下降优化器进行优化,损失函数选用均方误差(Mean Squared Error,MSE)衡量预测值与真实值之间的偏差。通过上述过程,实现ERA5驱动的逐日SPI在空间尺度上的精细化表达(Cai et al.,2024)。
图2
2 研究区干旱时空演变特征
2.1 典型干旱事件
基于1979—2021年黄河中上游地区420个气象站逐月SPI资料,选取1997年和2001年两个典型干旱年份,对SPI在区域干旱过程中的适用性进行评估[图3(a)、(b)]。1997年4—10月及2001年3—8月黄河中上游地区均出现较长时间的干旱过程,其中1997年6月、8月和10月,以及2001年3月和5月干旱程度相对较重;对应月份中,SPI达到轻度干旱(SPI≤-0.5)及以上等级的站点比例明显较高,且其变化趋势与区域平均SPI基本一致,表明干旱演变过程同时体现在干旱强度增强和干旱影响范围扩大两个方面。
图3
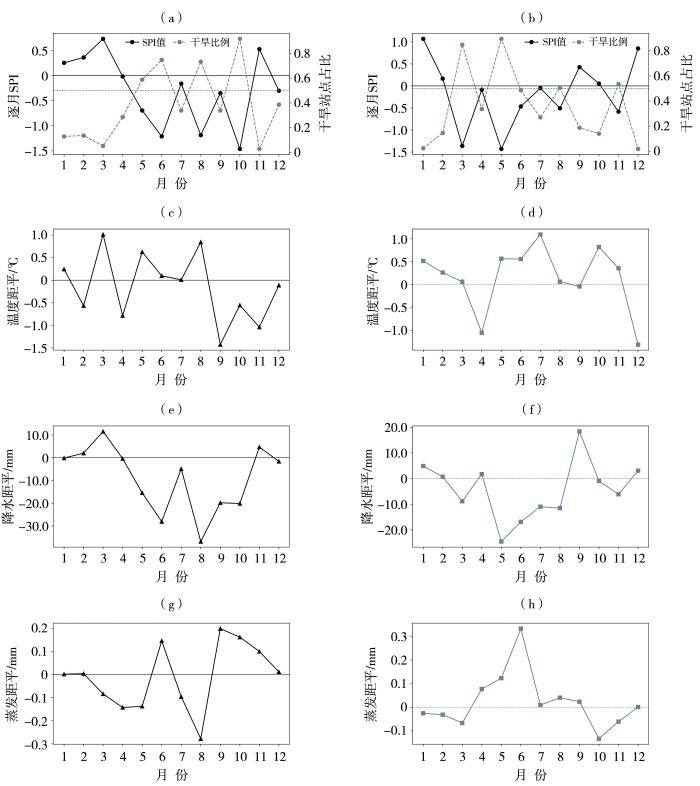
图3
1997(a、c、e、g)、2001(b、d、f、h)年黄河中上游地区SPI月均值与轻旱以上等级站点占比(a、b)及温度(c、d)、降水(e、f)和蒸发(g、h)的距平
Fig.3
Monthly mean SPI and the percentage of stations with mild drought or above (a,b),and the anomalies of temperature (c,d),precipitation (e,f),and evaporation (g,h) in the middle and upper reaches of the Yellow River in 1997 (a,c,e,g) and 2001 (b,d,f,h)
进一步对1997年和2001年各月的气温、降水和蒸发进行近30 a气候态距平分析[图3(c)~(h)],结果显示,这两年中气温和蒸发距平整体波动幅度较小,未表现出明显的异常特征。1997年4—10月降水距平持续为负,其变化趋势及极值出现月份与SPI变化基本一致;2001年3—8月,除4月降水略偏多以外,其余月份降水均为负距平,且极值月份与SPI极值对应关系较好。上述结果表明,SPI能有效响应降水异常变化,对降水主导型干旱事件具有较强的指示能力。
从空间演变特征来看,1997年黄河中上游地区干旱呈现明显阶段性变化(图4)。1—3月,研究区大部地区处于湿润状态,仅甘肃中东部局地出现轻到中旱;4月,甘肃东部干旱缓解并转为湿润,而河南西部和内蒙古南部出现干旱;5—6月,干旱迅速发展并扩展至黄河中上游大部分地区,其中甘肃东部、宁夏、陕西及山西大部地区干旱程度达到中旱及以上;7月,36°N以北区域干旱缓解并转为湿润,干旱主要集中于陕西南部和河南西部;8月,干旱范围再次扩大且强度增强,影响区域向黄河中下游扩展;9月,研究区大部地区干旱明显缓解,仅甘肃及内蒙古中部仍存在干旱;10月,研究区干旱再次发展,多数区域达到中旱及以上等级;11月,干旱明显缓解,区域整体转为湿润状态;12月,陕西和山西局地出现轻旱及以上程度的干旱。
图4
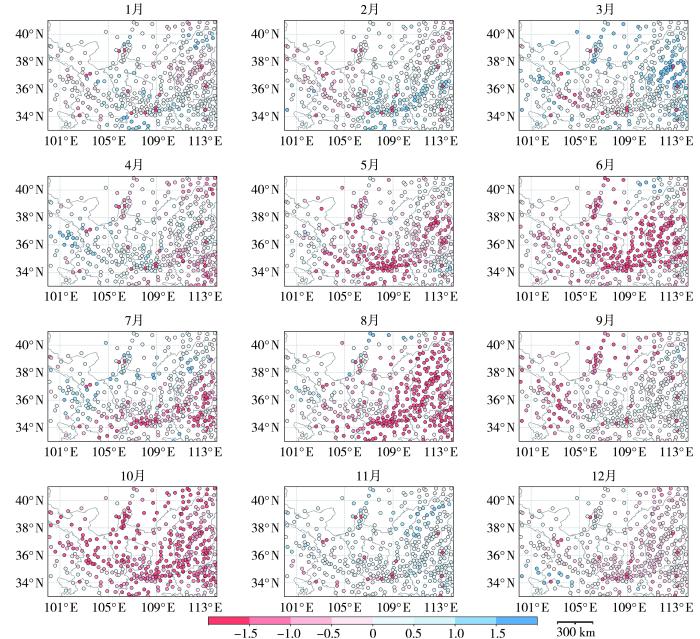
图4
1997年1—12月黄河中上游地区SPI空间分布
Fig.4
Spatial distribution of SPI in the middle and upper reaches of the Yellow River from January to December 1997
2001年黄河中上游地区干旱过程同样表现出明显的阶段性特征(图5)。1—2月,研究区大部地区以湿润为主,仅36°N以北局地出现轻度干旱;3月,干旱覆盖大部分区域,尤其在34°N—36°N之间的部分地区达到重度干旱;4月,干旱明显缓解,甘肃东部和陕西北部转为湿润状态,但5月干旱再次发展,对山西及其周边地区造成较为严重的影响;6—7月,河南西部干旱缓解并转为湿润状态,干旱主要集中于陕西北部和甘肃西部;8月,河南西部和山西局地干旱强度达到中度以上等级;9月,山西干旱缓解并转为湿润;10月,甘肃东部和山西北部再次出现干旱;11月,干旱范围进一步扩大,影响到河南西部等区域,部分地区达到重度干旱;12月,黄河中上游地区整体转为湿润状态。
图5
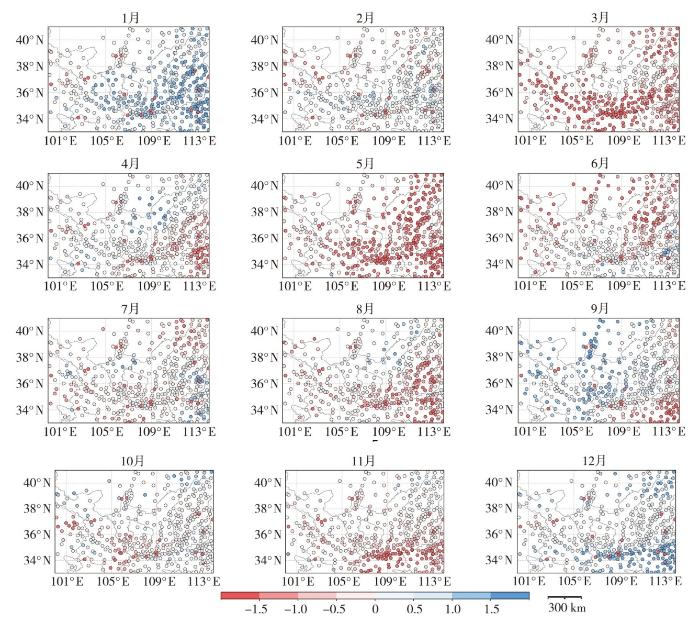
图5
2001年1—12月黄河中上游地区SPI空间分布
Fig.5
Spatial distribution of SPI in the middle and upper reaches of the Yellow River from January to December 2001
尽管基于观测站点的月尺度SPI数据能够识别出黄河中上游地区典型干旱事件,并反映月平均的干旱空间分布特征,但月尺度SPI在时间分辨率上存在局限性,难以及时捕捉干旱事件的发生与快速发展过程,尤其对骤旱等突发性强且演变迅速的干旱类型敏感性不足(Wu et al.,2007)。因此,亟需构建高时空分辨率的SPI数据集,以更加精细地刻画干旱时空演变过程。
2.2 SPID-ERA5对干旱演变过程的适用性评估
2.2.1 1997年干旱事件的时空演变特征
图6为1997年4—10月黄河中上游地区逐日干旱空间演变特征,为便于对比研究,选取的是每月的1、5、10、15、20、25日(下同)。4月初至5月中旬,研究区总体湿润,仅局地出现轻微干旱;5月20日至6月25日,陕西中部干旱强度加剧,干旱范围向北由约35°N扩展至40°N,影响内蒙古、宁夏、陕西北部及甘肃北部等地区,同时向东由约109°E扩展至113°E,覆盖山西及河南西北部;6月25日干旱强度达到最大,大部分区域处于轻、中度干旱,山西中部出现重度以上干旱;7月初至8月中旬,干旱范围收缩至110°E以东,强度减弱,宁夏及内蒙古地区转为明显湿润状态;8月下旬,陕西南部、山西及河南西北部再次出现干旱,干旱范围及强度于9月5日达到峰值,对陕西、山西及宁夏等地造成严重影响,随后干旱逐渐减弱;10月中下旬,河南西北部、陕西、山西、宁夏、甘肃东部及内蒙古等地区干旱范围扩大、强度增强,形成新的干旱过程。相比基于站点的月尺度SPI数据,高分辨率SPID-ERA5能够更精确地捕捉干旱的空间动态变化,清晰显示4—10月的3次干旱事件在范围和强度上的演变细节。
图6
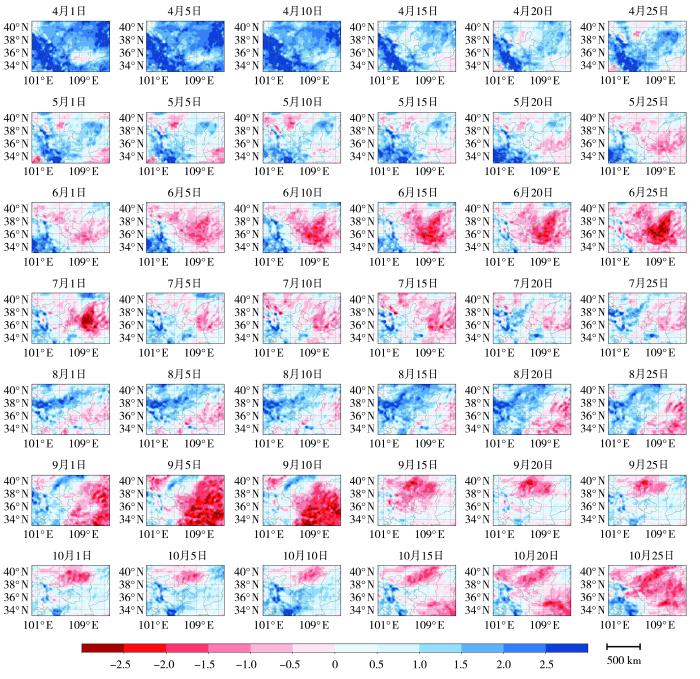
图6
1997年4—10月黄河中上游地区SPID-ERA5空间分布
Fig.6
Spatial distribution of SPID-ERA5 in the middle and upper reaches of the Yellow River from April to October 1997
为进一步评估SPID-ERA5对干旱时空演变特征刻画的可靠性,图7给出了1997年黄河中上游地区287个气象站逐日MCI空间分布特征。总体而言,MCI可综合反映区域水分收支状况,但其对1997年4—10月3次干旱过程在空间范围和强度变化上的刻画相对粗略。逐日MCI结果显示,4月中旬至5月下旬,陕西北部和河南西部以轻旱为主;6月至9月上旬,黄河中上游地区大部为中旱以上;9月中旬至10月下旬,研究区大部均为轻旱。MCI计算中引入了90 d和150 d的累积降水,其对短期干旱过程的动态响应存在一定滞后。相比之下,SPID-ERA5能够较好反映干旱范围及强度的演变过程,具有更高的时间敏感性。
图7
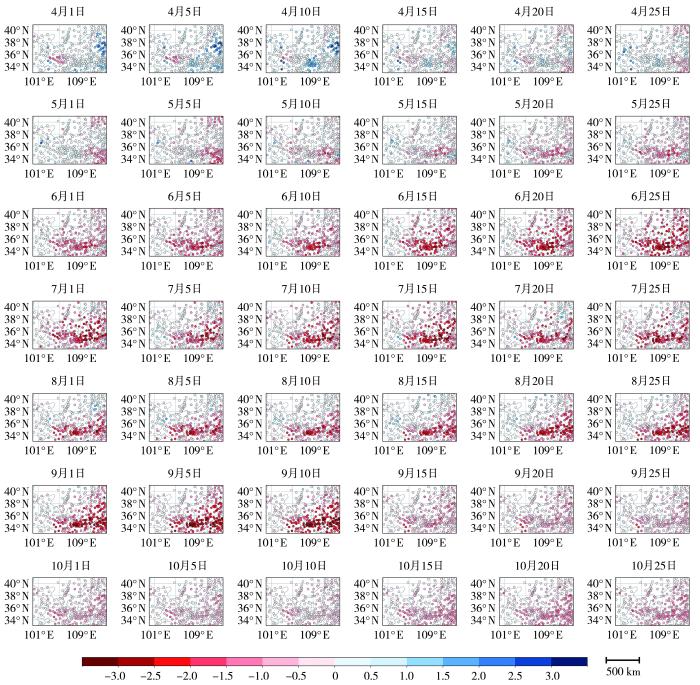
图7
1997年4—10月黄河中上游地区MCI空间分布
Fig.7
Spatial distribution of MCI in the middle and upper reaches of the Yellow River from April to October 1997
2.2.2 2001年干旱事件的空间演变特征
由2001年3—8月SPID-ERA5分布特征(图8)可见,黄河上游地区经历了一次典型的起始、扩张、加重、减弱的干旱过程。5月中旬起,该次干旱过程开始呈现东部起旱、向西向北扩展、全域强旱、局地缓解的阶段性演变特征。3月中旬,干旱首先在甘肃及内蒙古一带出现,SPID-ERA5迅速降至-1.0左右;3月下旬,旱情扩展至山西和陕西中部,并持续至4月中旬后初步缓解;5月中下旬,干旱范围进一步向西扩展,覆盖甘肃东部、宁夏、陕北及山西北部;6月,研究区大部出现显著旱情;6月下旬起,干旱范围向北收缩;7月初,干旱主要分布于黄河以北地区,并于7月中旬达到干旱强度峰值;8月,研究区旱情明显缓解。相比2001年逐月SPI站点数据所反映的演变特征,SPID-ERA5格点数据集能够更精准地刻画3—8月干旱在空间范围和强度上的连续变化过程。
图8
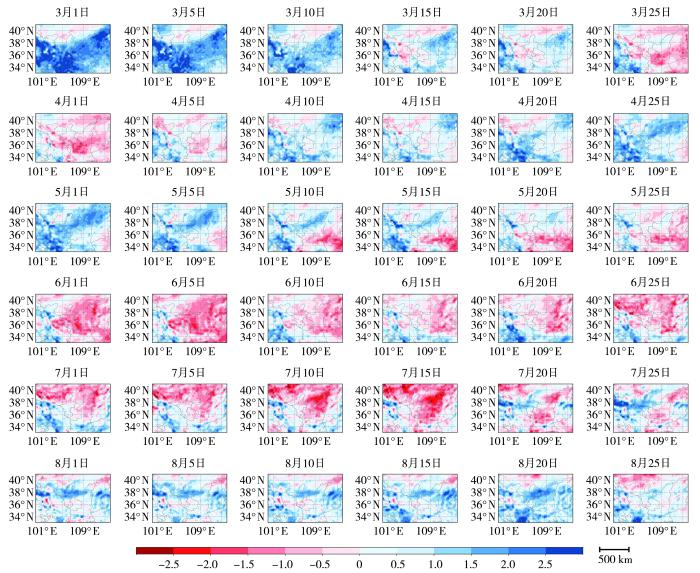
图8
2001年3—8月黄河中上游地区SPID-ERA5空间分布
Fig.8
Spatial distribution of SPID-ERA5 in the middle and upper reaches of the Yellow River from March to August 2001
图9
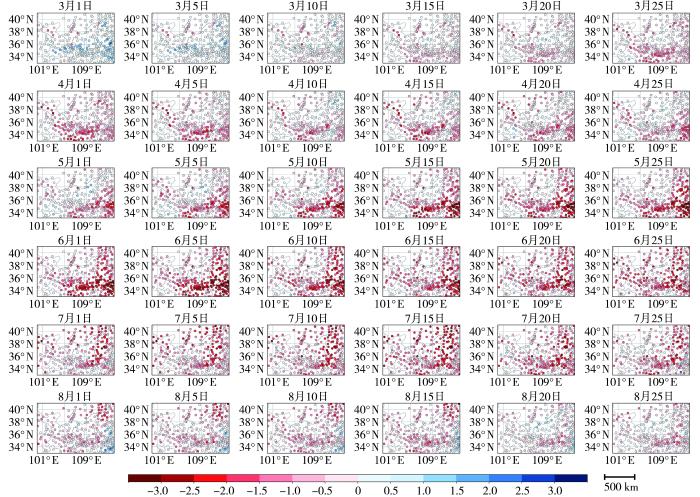
图9
2001年3—8月黄河中上游地区MCI空间分布
Fig.9
Spatial distribution of MCI in the middle and upper reaches of the Yellow River from March to August 2001
2.3 SPID-ERA5时间序列适用性评估
为比较SPID-ERA5与逐日MCI站点数据,采用最近邻插值方法将SPID-ERA5格点数据插值到站点,并对1997年和2001年逐日MCI与插值后的SPID-ERA5进行对比分析,统计轻旱以上的站点比例(图10)。从整体变化趋势来看,SPID-ERA5与MCI的趋势线在大多数时段表现出较高一致性,表明两种指数对主要干旱过程具有相近的指示能力。然而,SPID-ERA5曲线波动较频繁,尤其在夏季局部起伏更加明显,而MCI曲线相对平缓,这与其在计算中综合考虑了前期降水累积效应有关。值得注意的是,在大部分趋势线极值点处,SPID-ERA5与MCI趋势线的对应日期高度重合,说明两者均能较好地描述强干旱特征。而对于小范围干旱事件,MCI与SPID-ERA5的干旱监测结果差异较大,反映出MCI对弱干旱特征监测的敏感性不高。
图10
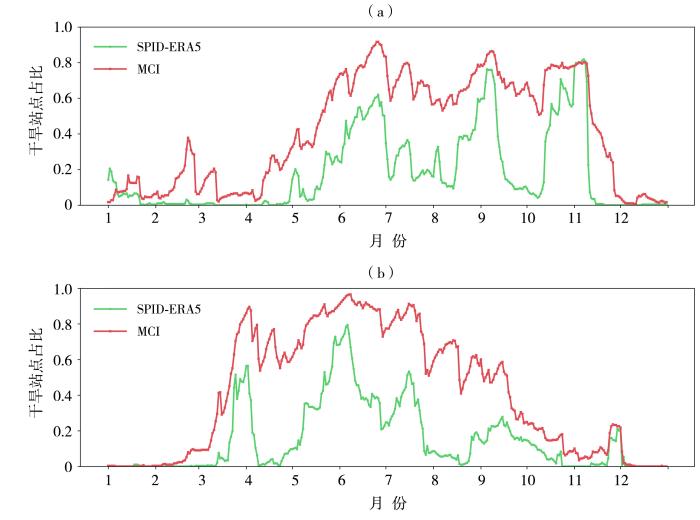
图10
1997(a)、2001(b)年黄河中上游地区SPID-ERA5与MCI轻旱以上站点占比的逐月变化
Fig.10
Monthly variations in the proportion of stations with mild drought or above based on SPID-ERA5 and MCI in the middle and upper reaches of the Yellow River in 1997 (a) and 2001 (b)
总体而言,尽管MCI能够有效描述干旱演变的总体过程,但SPID-ERA5在干旱细节刻画方面表现更突出,尤其在响应短期干旱强度变化、捕捉干旱过程中的快速波动及阶段性转折方面更为灵敏,更符合实际干旱“发生、发展、缓解”过程中强弱交替的演变特征。在快速演变干旱过程的监测与分析中,将MCI与对短期变化敏感的SPI类指数相结合,有助于发挥各自优势,提升干旱监测的全面性与精细化水平。
图11为1997、2001年SPID-ERA5与MCI在黄河中上游地区的符号一致率及空间相关系数的箱线图。干旱高发季节(3—8月),两种指数对干湿状态的判别具有较高一致性。1997年3—8月符号一致率中位数均超过0.5,其中3、4、6、8月超过0.6;2001年3月及5—7月符号一致率中位数也超过0.5。相比之下,1997年11—12月及2001年11月符号一致率中位数较低且四分位距较大,表明此阶段两种指数的一致性相对较弱,而其余月份一致性总体较好。过渡季(9—10月),1997年和2001年的符号一致率中位数仍保持较高水平,但1997年四分位距偏大,表明该时期区域干湿状态空间差异较明显。空间相关系数的月变化特征与符号一致率基本一致,进一步验证了SPID-ERA5与MCI在典型干旱年份对干湿状态刻画上具有一定一致性。
图11
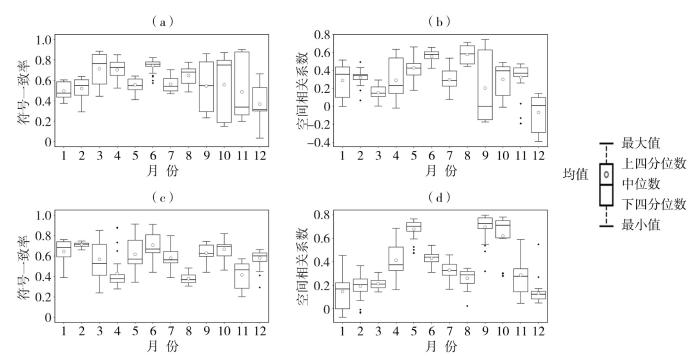
图11
1997(a、b)、2001(c、d)年黄河中上游地区SPID-ERA5和逐日MCI正负号一致率(a、c)及空间相关系数(b、d)的箱线图
Fig.11
Box plots of the SPID-ERA5 and daily MCI positive-negative sign agreement rates (a,c) and spatial correlation coefficients (b,d) for the middle and upper reaches of the Yellow River in 1997 (a,b) and 2001 (c,d)
3 结论与讨论
基于ERA5再分析降水数据计算逐日SPI,并利用CNN方法进行空间降尺度,本文构建了高时空分辨率逐日干旱数据集SPID-ERA5,并选取1997年和2001年两个典型干旱年,评估SPID-ERA5在黄河中上游地区干旱时空演变过程中的适用性,得到以下主要结论。
1)两个典型干旱年,SPID-ERA5均能准确刻画干旱发生、发展、扩张、减弱及下一轮干旱形成的全过程,清晰反映干旱核心区演变、影响范围的扩张与收缩以及干旱峰值时段与区域分布。相比之下,逐日MCI对干旱演变的响应相对滞后,其更侧重水分亏缺的累积效应,且受空间分辨率限制,对干旱范围和强度的空间变化刻画能力不足。
2)SPID-ERA5与逐日MCI的时间演变特征具有较好一致性。两者极值点对应日期高度重合,符号一致率和相关系数整体较高且变化趋势相似,说明高时空分辨率SPID-ERA5能够捕捉干旱范围与强度的时间变化,而逐日MCI充分考虑前期降水的贡献,但对弱干旱监测的敏感性不高。
3)站点逐月SPI受时间分辨率和站点分布限制,难以反映干旱的短期变化;逐日MCI对中长期降水依赖性较强,响应速度偏慢。高时空分辨率SPID-ERA5凭借日尺度时间分辨率和高分辨率格点分布,能够更全面、连续地刻画干旱强度波动与过程转折,在空间完整性和一致性方面表现更好。
相较于以往单一数据源的产品评估研究,本文通过多类型干旱指标的综合对比,降低了评价结果的片面性(王荣江等,2021)。然而,现有干旱监测产品在时空分辨率和精度方面仍存在不足,尤其在干旱高发阶段,数据精度与覆盖度仍是制约因素。此外,MCI在短期干旱响应方面仍有改进空间。SPID-ERA5为逐日干旱过程监测与干旱预警提供了新的思路和可靠的数据支撑,但仍存在局限性:一方面,其基于ERA5再分析降水资料构建,受模式算法和观测站点分布影响,局地降水仍可能存在一定偏差;另一方面,该数据对前期降水累积效应考虑不足,更适用于短期干旱过程监测,在长期干旱演变刻画方面仍有提升空间。
参考文献
ERA5-Land降水产品在黄河流域干旱监测中的适用性研究
[J].
ERA5-Land再分析产品作为全球重要的地表要素数据,其在干旱监测中的误差评估对进一步提升干旱预警能力和降低灾害风险具有重要意义。利用1981—2020年国家气象信息中心逐日降水格网数据,结合标准化降水指数(Standardized Precipitation Index, SPI),定量评价欧洲中期天气预报中心(European Centre for Medium-Range Weather Forecasts, ECMWF)的第五代再分析陆地产品(Land component of the Fifth Generation of European Reanalysis, ERA5-Land)降水资料在黄河流域及其子流域干旱监测中的误差特征,探讨ERA5-Land降水产品在不同地区和不同时间尺度下对降水的高(低)估以及对干旱特征的描述能力。结果表明:ERA5-Land降水产品在黄河流域对降水量存在明显高估现象,上游地区降水量高估误差最大,中游次之,而下游相对较低。在不同时间尺度下,ERA5-Land降水产品对干湿状况的反映能力存在明显差异,并随时间尺度的增加,差异也增加。针对黄河流域干旱事件,ERA5-Land降水产品存在明显的干旱频次高估和干旱历时低估。上游地区主要以干旱烈度和严重度高估为主,中下游则存在明显的干旱烈度和严重度低估现象。虽然ERA5-Land降水产品能够有效捕获典型干旱事件的空间分布,但对不同等级干旱面积的描述并不准确。因此,使用ERA5-Land降水产品数据进行干旱监测时,需特别注意其高估或低估现象。
新安江流域气象干旱和水文干旱特征及两者之间的关系研究
[J].新安江流域是传统丰水区,对该区域进行干旱演变规律以及气象-水文干旱传播特征及其响应关系的研究,对于流域水资源的调度和管理具有重要科学意义。基于新安江流域近63 a的降水和径流数据,利用标准化降水指数(Standardized Precipitation Index,SPI)和标准化径流指数(Standardized Runoff Index,SRI),研究不同时间尺度的新安江气象干旱和水文干旱的演变规律,并分析流域水文干旱对气象干旱的时滞效应。结果表明:(1)1960—2022年新安江流域的气象干旱和水文干旱主要发生在20世纪60年代、70年代末到80年代中期以及21世纪初,2010年至今新安江整体处于水资源丰盈状态,其余时段则干旱与湿润交替发生。(2)近63 a的数据显示,新安江流域总体呈现变湿趋势,干旱事件有所减少。其中冬季和夏季变湿最为明显,且水文角度变湿趋势比气象角度更为明显。(3)新安江流域的水文干旱与气象干旱显著相关,通常在气象干旱发生后1~3个月出现。水文干旱对气象干旱在汛期的相关性和响应速度均高于非汛期。因此,应更加关注汛期的流域干旱并采取针对性措施。
Kilometer-scale precipitation forecasting utilizing convolutional neural networks: A case study of Jiangsu’s coastal regions
[J].
Version 4 of the CRU TS monthly high-resolution gridded multivariate climate dataset
[J].CRU TS (Climatic Research Unit gridded Time Series) is a widely used climate dataset on a 0.5° latitude by 0.5° longitude grid over all land domains of the world except Antarctica. It is derived by the interpolation of monthly climate anomalies from extensive networks of weather station observations. Here we describe the construction of a major new version, CRU TS v4. It is updated to span 1901-2018 by the inclusion of additional station observations, and it will be updated annually. The interpolation process has been changed to use angular-distance weighting (ADW), and the production of secondary variables has been revised to better suit this approach. This implementation of ADW provides improved traceability between each gridded value and the input observations, and allows more informative diagnostics that dataset users can utilise to assess how dataset quality might vary geographically.
The ERA5 global reanalysis
[J].
Determining the start, duration, and strength of flood and drought with daily precipitation: Rationale
[J].
The relationship of drought frequency and duration to time scales: Proceedings of the Eighth Conference on Applied Climatology
[C].
Assessing drought cycles in SPI time series using a Fourier analysis
[J].
ERA5-Land: A state-of-the-art global reanalysis dataset for land applications
[J].. Framed within the Copernicus Climate Change Service (C3S) of the European Commission,\nthe European Centre for Medium-Range Weather Forecasts (ECMWF) is producing an enhanced global dataset for the land component of the fifth generation of European ReAnalysis (ERA5), hereafter referred to as ERA5-Land. Once completed, the period covered will span from 1950 to the present, with continuous updates to support land monitoring applications. ERA5-Land describes the evolution of the water and energy cycles over land in a consistent manner over the production period, which, among others, could be used to analyse trends and anomalies.\nThis is achieved through global high-resolution numerical integrations of the ECMWF land surface model driven by the downscaled meteorological forcing from the ERA5 climate reanalysis, including an elevation correction for the thermodynamic near-surface state. ERA5-Land shares with ERA5\nmost of the parameterizations that guarantees the use of the state-of-the-art land surface modelling applied to numerical weather prediction (NWP) models.\nA main advantage of ERA5-Land compared to ERA5 and the older ERA-Interim is the horizontal resolution, which is enhanced globally to 9 km compared to 31 km (ERA5) or 80 km (ERA-Interim), whereas the temporal resolution\nis hourly as in ERA5. Evaluation against independent in situ observations\nand global model or satellite-based reference datasets shows the added value\nof ERA5-Land in the description of the hydrological cycle, in particular\nwith enhanced soil moisture and lake description, and an overall better agreement of\nriver discharge estimations with available observations. However, ERA5-Land snow depth fields present a mixed performance when compared to those of ERA5, depending on geographical location and altitude.\nThe description of the\nenergy cycle shows comparable results with ERA5. Nevertheless, ERA5-Land reduces the global averaged root mean square error of the skin temperature, taking as\nreference MODIS data, mainly due to the contribution of\ncoastal points where spatial resolution is important.\nSince January 2020, the ERA5-Land period available has extended from January 1981 to the near present, with a\n2- to 3-month delay with respect to real time. The segment prior to 1981 is in production, aiming for a release of the whole dataset in summer/autumn 2021.\nThe high spatial and temporal resolution of ERA5-Land, its extended period, and the consistency of the fields produced makes it a valuable dataset to support hydrological studies,\nto initialize NWP and climate models,\nand to support diverse applications dealing with water resource, land, and environmental management. The full ERA5-Land hourly (Muñoz-Sabater, 2019a) and monthly (Muñoz-Sabater, 2019b) averaged datasets presented in this paper are available through the C3S Climate Data Store at https://doi.org/10.24381/cds.e2161bac and https://doi.org/10.24381/cds.68d2bb30, respectively.
Statistical downscaling of daily temperature and precipitation over China using deep learning neural models: Localization and comparison with other methods
[J].
A multiscalar drought index sensitive to global warming: The standardized precipitation evapotranspiration index
[J].The authors propose a new climatic drought index: the standardized precipitation evapotranspiration index (SPEI). The SPEI is based on precipitation and temperature data, and it has the advantage of combining multiscalar character with the capacity to include the effects of temperature variability on drought assessment. The procedure to calculate the index is detailed and involves a climatic water balance, the accumulation of deficit/surplus at different time scales, and adjustment to a log-logistic probability distribution. Mathematically, the SPEI is similar to the standardized precipitation index (SPI), but it includes the role of temperature. Because the SPEI is based on a water balance, it can be compared to the self-calibrated Palmer drought severity index (sc-PDSI). Time series of the three indices were compared for a set of observatories with different climate characteristics, located in different parts of the world. Under global warming conditions, only the sc-PDSI and SPEI identified an increase in drought severity associated with higher water demand as a result of evapotranspiration. Relative to the sc-PDSI, the SPEI has the advantage of being multiscalar, which is crucial for drought analysis and monitoring.
Spatiotemporal evolution and driving force analysis of drought characteristics in the Yellow River Basin
[J].
An improved daily standardized precipitation index dataset for mainland China from 1961 to 2018
[J].The standardized precipitation index (SPI), one of the most commonly used drought indicators, is widely used in the research areas of drought analysis and drought prediction in different fields such as meteorology, agriculture, and hydrology. However, its main disadvantage is the relatively coarse time resolution of one month. To improve the time resolution of SPI to identify flash droughts, we have refined the traditional SPI calculation method and developed a new multi-scale daily SPI dataset based on data from 484 meteorological stations in mainland China from 1961 to 2018. SPI data from three different sites (located in Henan, Yunnan, and Fujian Provinces) at the three-month timescale were analyzed by comparing with historically recorded drought events. We found that the new multi-scale daily SPI can effectively capture drought events in different periods and locations and identify the specific start and end times of drought events. In short, our SPI dataset appears reasonable and capable of facilitating drought research in different fields.© 2022. The Author(s).
Appropriate application of the standardized precipitation index in arid locations and dry seasons
[J].

