

0 引言
在全球变暖背景下,极端气候事件的频率与强度显著增加,对自然生态系统及人类社会构成了严峻挑战(Hao et al.,2022)。IPCC第六次评估报告指出,2011—2020年全球地表温度较1850—1900年上升约1.09 ℃(IPCC,2021)。相较于单一事件,复合型极端事件往往叠加多种灾害效应,造成更严重的社会经济冲击(余荣和翟盘茂,2021;Wang et al.,2021;孙蕊等,2023)。已有研究表明,全球多个地区复合高温干旱事件呈现增强趋势(Hao et al.,2018;Collins,2022;Ridder et al.,2022;Tripathy et al.,2023;杨英杰等,2024;Wang et al.,2024)。然而,此类事件的形成机制具有显著区域差异性,如2022 年欧洲夏季复合高温干旱事件主要受异常反气旋控制(Herrera-Lormendez et al.,2023),而中国东部的复合高温干旱事件则表现出显著的土壤湿度-大气反馈特征(Chen and Wang,2024)。因此,揭示特定区域复合事件的形成机制,对于提升科学认知与区域防灾减灾能力具有重要意义。长江流域作为中国人口稠密、经济活跃的核心区域,其粮食安全与水资源保障对国家战略至关重要。该流域位于东亚季风区,对气候变化响应极度敏感。近年来,长江流域复合高温干旱事件频发,特别是2022年的极端事件造成了严重的经济损失(高洁等,2023;Qian et al.,2024)。既往研究已从大气内部变率(Wang et al.,2023b;Zhou et al.,2023)、遥相关作用(Tang et al.,2023)及人类活动强迫(Hua et al.,2021)等角度探讨其成因。例如,西太平洋副热带高压(简称西太副高)的异常维持(段欣妤等,2024)、中纬度反气旋引发的下沉增温效应(Yin et al.,2023)及人为温室气体排放(Chen et al.,2024)均被视为关键因子。此外,亚欧大陆波列传播与热带对流活动亦对区域极端气候具有重要作用(Chen and Zhai,2015)。
继2022年极端高温后,2024年中国再次经历自1961年以来最热夏季,长江流域尤其是川渝地区遭遇了持续至9月的罕见复合高温干旱事件(Zhou et al.,2025)。与2022年盛夏事件不同,本次事件跨越夏末秋初,表现出持续时间长、干热强度高及时空演变复杂等典型“秋老虎”特征。目前,基于固定格点或站点的识别方法易忽略复合高温干旱事件的时空连续性,且对跨季节事件的成因认识尚显不足。因此,本研究采用三维连接组件算法结合日尺度干旱指数,从三维视角识别2024年的复合高温干旱事件,系统分析其时空演变特征及“秋老虎”阶段的环流成因,旨在通过揭示中高纬波列与低纬对流的交互作用,深化对跨季节复合极端事件形成机制的理解,为完善区域极端事件监测预测及防灾减灾工作提供科学依据。
1 研究区域概况与研究数据
1.1 研究区域概况
1.2 数据来源
本文研究采用的逐日最高温度(Tmax)和日降水量(Pre)资料来源于美国国家海洋大气管理局(National Oceanic and Atmospheric Administration,NOAA)气候预测中心(Climate Prediction Center,CPC)全球逐日格点监测数据集,空间分辨率为0.5°×0.5°;逐日大气环流资料来自欧洲中期天气预报中心(European Centre for Medium-Range Weather Forecasts,ECMWF)的第五代大气再分析数据集(ERA5),选取范围包括925~100 hPa共24层的位势高度、风场、垂直速度、比湿、总云量及向下短波辐射,空间分辨率为1°×1°。CPC与ERA5数据集在长江流域的极端气候研究中已得到广泛应用并被验证具有高度可靠性(Huang et al.,2021)。此外,本文还使用NOAA提供的逐日平均向外长波辐射(Outgoing Longwave Radiation,OLR)资料(空间分辨率1°×1°)进行对流活动特征分析(杨含雪等,2018)。研究时段为1979—2024年的6—9月。OLR数据在1985年全年及2024年8月8日存在数据缺测,剔除缺测时段。
2 研究方法
2.1 三维视角下时空连续复合高温干旱事件的定义与识别
采用两步式识别复合高温干旱事件:首先利用三维连接组件(3-D Connected Component,CC3D)算法识别时空连续的热浪事件;随后结合气象干旱指数,从识别出的热浪事件中筛选出干旱强度达标的样本,从而判定为一次复合高温干旱事件。
2.1.1 三维连续高温热浪事件的定义
传统热浪识别算法多关注孤立的格点,易忽略极端事件的时空连续性。使用源于图像处理中的二维连通分量标注(Connected Components Labeling,CCL)技术的CC3D算法,通过以下流程提取三维热浪结构:
②二进制转换:将原始三维(纬度×经度×时间)Tmax数据转化为二进制矩阵,格点当日Tmax超过高温阈值记为“1”,否则为“0”。
图1
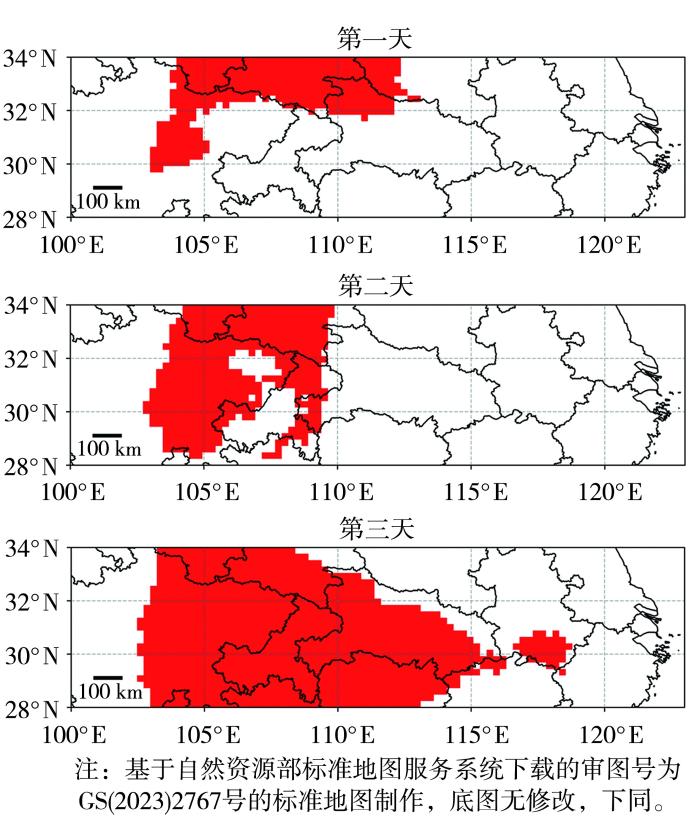
图1
2008年长江流域一次时空连续高温热浪事件三维演变过程
Fig.1
Three-dimensional evolution of a spatiotemporal continuous heat wave event in the Yangtze River Basin in 2008
2.1.2 基于修正SPI指数的干旱判定
在识别出的热浪事件基础上,进一步引入气象干旱指数以判定复合特征。相比其他指数,标准化降水指数(Standardized Precipitation Index,SPI)具有多时间尺度特性,广泛应用于干旱监测,能有效反映干旱的强度和持续时间等。本文参考Shan等(2024)的改进方案,基于伽马分布计算正降水量的累积概率分布,并结合平均降水量资料计算逐日SPI值,其计算公式如下:
式中:m为1979—2024年共46 a的年份序号(m=1,2,…,46);i、j为6—9月日序(i=1,2,…,122;j=1,2,…,122);SPm,i为第m年第i天在累计窗口Nd内的累计降水量,单位为mm;
2.1.3 复合高温干旱事件判定
2.2 时空连续的复合高温干旱事件
时空连续的复合高温干旱事件在三维坐标系(纬度×经度×时间)中表现为独立的三维时空体。选取持续时间、高温强度(事件覆盖格点Tmax与高温热浪阈值之差的平均值)、最大覆盖面积(格点数)及干旱强度SPI30 4个指标全面评估复合高温干旱事件的演变特征。
2.3 统计方法
采用多变量经验正交函数(Multivariate Empirical Orthogonal Function,MVEOF)分解方法,提取长江流域Tmax与平均降水量协同分布的主导模态,并以此构建复合高温干旱指数序列。在成因分析阶段,利用合成分析与线性回归分析定量评估研究时段内各气象要素的分布特征及其与复合指数的关系,并对所有时间序列进行去趋势处理。此外,通过相关分析验证气象要素场之间的物理联系,所有统计分析均基于t检验进行显著性判断。使用K均值聚类(K-Means Clustering)算法对关键区的大气环流变量进行聚类分析,用于识别不同气候背景下的主导模式。该算法是广泛使用的无监督机器学习方法,通过最大化簇内相似度与簇间差异性,能有效抓取并区分长江流域内的典型环流模式。
3 复合极端事件时空特征与环流背景
3.1 时空演变特征
根据CC3D算法识别结果,1979—2024年6—9月,长江流域共发生51次复合高温干旱事件,其中,2013、2016、2022及2024年发生的事件空间覆盖广、持续时间长,影响显著(表1)。相比2022年,2024年事件的平均强度与干旱程度略低,但持续时间长达65 d,且表现出明显的跨季节延续特征(延续到9月);空间范围上,两次事件最大覆盖面积覆盖全流域。
表1 1979—2024年长江流域典型复合高温干旱事件的特征
Tab.1
| 起始时间 | 结束时间 | 持续时间/d | 高温强度/℃ | 最大覆盖面积/格点数 | SPI30 |
|---|---|---|---|---|---|
| 1981-06-11 | 1981-06-27 | 17 | 1.55 | 474 | -0.54 |
| 2013-07-22 | 2013-08-30 | 40 | 1.57 | 517 | -0.76 |
| 2016-08-11 | 2016-08-29 | 16 | 1.76 | 516 | -0.71 |
| 2022-07-28 | 2022-08-30 | 34 | 2.59 | 517 | -1.03 |
| 2024-07-28 | 2024-09-30 | 65 | 2.10 | 517 | -0.63 |
图2为2024年复合高温干旱事件的时空演变过程。该次事件经历了由长江中下游向四川盆地逐步推进的过程。初始阶段,事件质心位于安徽、湖北交界,随后向西迁移至重庆、四川一带,覆盖面积逐渐增大,并在后期稳定滞留于四川盆地东部,呈现出显著的“西移、增强、滞留”特征。在此过程中,事件高温强度从初期约1.0 ℃攀升至2.5 ℃以上,并最终在四川盆地达到峰值。这一演变特征与夏季西太副高的西伸加强过程密切相关。事件初期西太副高主体控制长江中下游,导致中东部高温;随后副高系统西伸北抬,其控制下的下沉增温与晴空辐射增强区向西推进,驱动高温事件同步西移。
图2
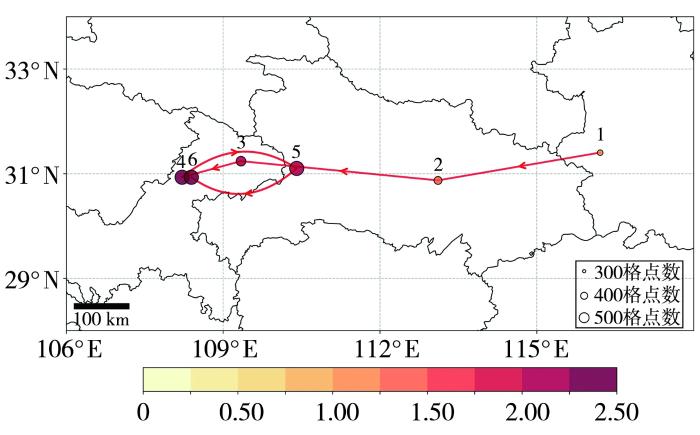
图2
2024年长江流域复合高温干旱事件空间演变轨迹(红色箭头线)和高温强度加权质心分布(填色气泡,单位:℃)
[红色箭头线连接每10 d(末段为15 d)的高温强度加权质心,气泡大小表示该时间段事件最大覆盖面积]
Fig.2
Spatial evolution track (red arrowed line) and hot intensity-weighted centroid distribution (colored bubbles,Unit: °C) of the compound hot and drought event over the Yangtze River Basin in 2024
(The red arrowed line connects the hot intensity-weighted centroids at 10-day intervals (15 days for the final segment); bubble size indicates the maximum affected area during each period)
图3为2024年长江流域复合高温干旱事件高温、干旱强度逐日演变及1979—2024年7月28日—9月30日区域平均Tmax逐日演变。此次事件自7月28日开始,至9月30日结束,持续65 d,具有明显阶段性差异。盛夏(7月28日—8月20日),高温强度为0.51~2.09 ℃(均值1.18 ℃);而夏末秋初(8月21日—9月20日),高温强度为1.28~3.86 ℃(均值2.26 ℃),表现出显著而持久的高温特征,其相对炎热程度明显高于盛夏期。9月21日高温强度出现明显回落后短暂减弱,随后再次增强,并于9月27日前后形成次级峰值;进入10月后高温强度迅速减弱,长江流域逐步转入秋季气候。8月21日之前的大部分时段,流域平均Tmax相对于历史同期并不突出;8月21日—9月20日,除8月28日、9月16日外,其余日期的流域平均Tmax均位于历史同期前5位,反映出显著的异常高温特征。盛夏阶段,事件的平均干旱强度为0.10,并未呈现干旱状态;而在夏末秋初阶段,平均干旱强度为-0.96,已接近中度干旱水平。
图3
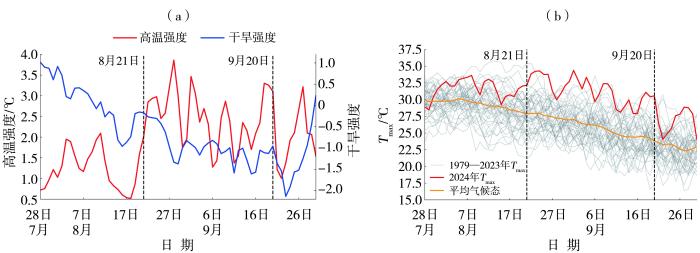
图3
2024年7月28日—9月30日长江流域复合高温干旱事件高温强度、干旱强度(a)及1979—2024年同期区域平均Tmax(b)的逐日演变
Fig.3
Daily variation of the hot intensity and SPI30 (a) of the compound hot and drought event from July 28 to September 30, 2024 and the regional average Tmax at the same period from 1979 to 2024 (b)
图4为1979—2024年盛夏期和夏末秋初两个时段长江流域区域平均Tmax异常与平均日降水量异常的时间序列,以及2024年盛夏期和夏末秋初两个时段Tmax及降水量异常的空间分布。夏末秋初阶段,2024年流域平均Tmax正异常达4.91 ℃(P<0.05),处于历史同期的极端高位,相比之下,盛夏期2024年流域平均Tmax正异常为2.24 ℃(P<0.05),仅为历史同期第4高位。从空间分布上看,尤其是在长江中上游的川西高原、四川盆地、湖北西部和湖南北部,8月21日—9月20日的Tmax正异常明显大于盛夏时段,表明该阶段流域大部分地区的炎热程度要强于盛夏时段。日降水量异常的演变特征与高温过程呈明显的协同变化。夏末秋初阶段,2024年流域平均日降水量负异常为-1.61 mm(P<0.05),为1998年以来同期最高,而盛夏期2024年流域平均日降水量负异常仅为-0.83 mm(P<0.05),虽具有统计显著性,但相较历史同期并不突出。从空间分布来看,四川盆地、湖北、湖南北部、江西北部及河南南部在8月21日—9月20日表现出更为显著的降水量负异常。相比之下,东部沿海及四川西南部部分区域,可能受台风活动及其他中小尺度对流系统影响,8月21日—9月20日出现了日降水量正异常。
图4
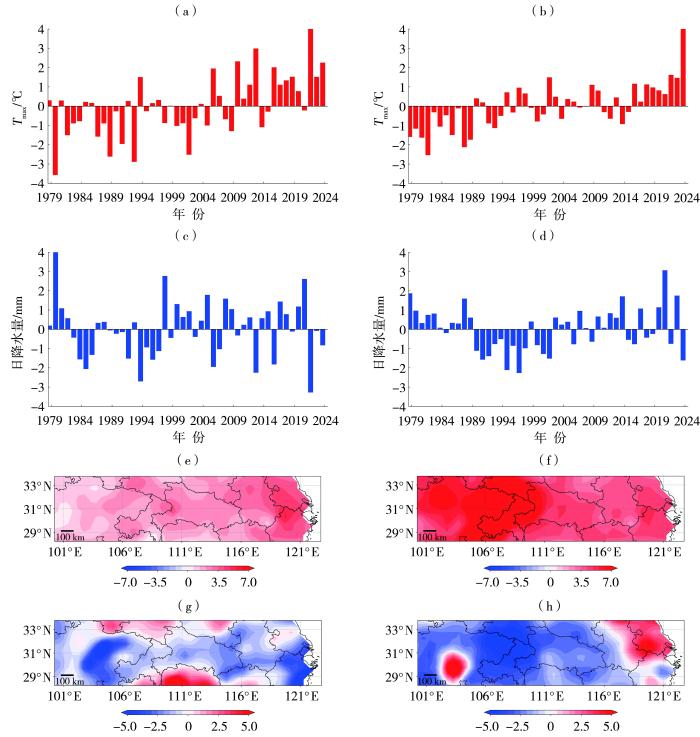
图4
1979—2024年7月28日—8月20日(a、c)、8月21日—9月20日(b、d)长江流域平均Tmax(a、b)、平均降水量(c、d)异常年际变化及2024年7月28日—8月20日(e、g)、8月21日—9月20日(f、h)Tmax异常场(单位:℃)(e、f)、降水量异常场(单位:mm)(g、h)空间分布
Fig.4
Interannual variation of mean Tmax anomalies (a, b) and mean precipitation anomalies (c, d) from 28 July to 20 August (a, c) and 21 August to 20 September (b, d) during 1979-2024, and spatial distribution of anomaly fields of Tmax (Unit: ℃) (e, f) and precipitation (Unit: mm) (g, h) from 28 July to 20 August (e, g) and 21 August to 20 September (f, h) 2024 in the Yangtze River Basin
综上,在2024年夏秋复合极端高温干旱事件中,夏末秋初阶段的相对炎热程度和干旱强度均显著高于盛夏阶段。因此,后续分析将重点聚焦于这一持续近一个月,具有史无前例特征的“秋老虎”复合极端事件。
3.2 “秋老虎”事件期间环流场特征
此次“秋老虎”事件期间,东亚地区的大尺度环流异常构成了维持复合高温干旱过程的重要背景条件。图5为该时段区域平均环流场结构特征。500 hPa位势高度场和风场中,东亚中高纬度地区受强大的正压型反气旋系统控制,系统中心位于华北,空间尺度大、结构稳定,长江流域处于该反气旋系统南缘,盛行偏东气流。该反气旋系统在垂直方向上表现出明显的深厚性,呈高低层气压场一致性,指示大气层结稳定性显著增强,是导致天气持续晴热的关键环流配置。同时,西太副高明显西伸北抬,控制范围覆盖整个长江流域,其主导的下沉运动为高温天气的维持提供了有力动力条件。500 hPa垂直速度场可看出,在副高边缘偏东气流引导下,长江流域中高层垂直速度普遍为正值,说明存在大范围持续下沉运动,其中对流层中层(500 hPa)尤为显著。该下沉运动导致空气绝热增温,有效抑制对流发展,减少降水,同时减少云量,进一步增强地表增温趋势。总云量距平表明,长江流域云量显著偏低,区域呈大范围负异常,其中四川盆地负异常最为明显。下沉运动对云量的抑制不仅限制了水汽上升和云团生成,还进一步增强了晴空辐射,使得日照强度和持续时间均明显增强。地表向下短波辐射通量在流域范围内普遍呈现正异常,尤其在云量异常偏少的四川盆地,辐射增强更加显著,为地表快速升温提供了直接的能量来源。
图5
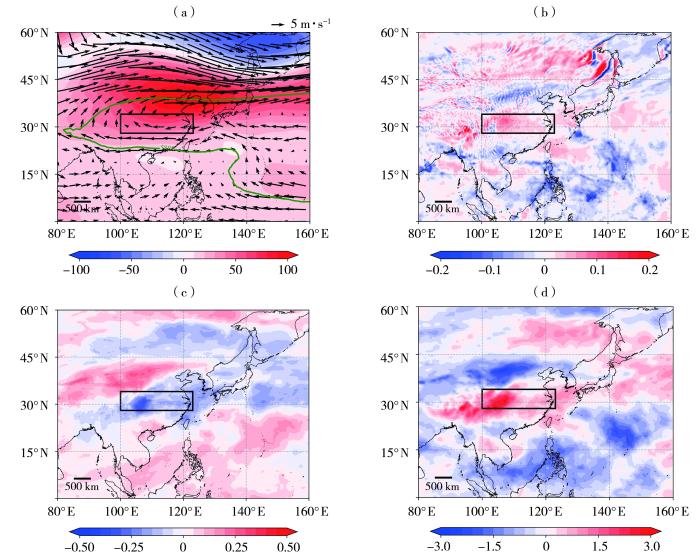
图5
2024年8月21日—9月20日500 hPa位势高度场距平(填色,单位:gpm)和风场(矢量,单位:m·s-1)(a)、500 hPa垂直速度异常场(负值表示上升运动,单位:Pa·s-1)(b)、总云量异常场(c)、向下短波辐射异常场(单位:106 J·m-2)(d)
(绿色线为5 880 gpm,黑色矩形为长江流域)
Fig.5
The 500 hPa geopotential height anomalies (the color shaded, Unit: gpm), and wind field (vectors, Unit: m·s-1) (a), 500 hPa vertical velocity anomalies (negative value indicates upward motion, Unit: Pa·s-1) (b), total cloud cover anomalies (c), and downward shortwave radiation anomalies (Unit: 10⁶ J·m-2) (d) during 21 August to 20 September 2024
(The green line denotes 5 880 gpm, the black rectangle indicates the Yangtze River Basin)
综上所述,此次“秋老虎”型复合高温干旱事件的环流异常可概括为中高纬深厚反气旋控制→中层显著下沉运动增强→云量显著减少→短波辐射显著增强→地表升温持续强化。这一清晰而完整的环流反馈链条揭示了典型复合高温干旱事件得以维持和强化的大尺度大气环流背景。
4 “秋老虎”事件成因分析
4.1 指数构建
然而,在以8月21日—9月20日作为整体时间段构建复合指数并开展成因回归分析时发现,上述两类遥相关机制在统计上均未表现出显著响应特征,难以有效识别其具体的作用机制及相对主导性。这一结果表明,不同遥相关模态在事件演变过程中可能具有明显阶段性差异,其驱动作用并非在整个“秋老虎”期间始终一致。因此,有必要进一步细化时间分段,以揭示不同动力、热力机制在事件不同阶段中的相对贡献。基于此,将2024年8月21日—9月20日划分为3个旬尺度阶段:8月21—31日为第一旬,9月1—10日为第二旬,9月11—20日为第三旬。针对每一旬,将区域历史同期的Tmax与平均降水量进行联合MVEOF分解,并提取各自的第一模态(MVEOF1)及对应时间系数(PC1)(图6)。3个时段中,MVEOF1的解释方差分别为30.83%、33.28%和26.24%,能够较好地刻画区域复合高温干旱事件的主导变化特征。3旬中Tmax的第一模态在整个长江流域均呈现一致的正值分布;而平均降水量的第一模态除第三旬在四川西南部及东部沿海部分区域出现正值外,其余地区均表现为一致的负值分布,其余两旬的降水特征向量在研究区也以负值为主。以上表明,夏末秋初长江流域大部分地区Tmax与平均降水量呈明显反相关分布,即当Tmax偏高时,区域降水普遍偏少,反映出高温和干旱发生的空间一致性。MVEOF1对应的PC1可用来表征各旬尺度内长江流域复合高温干旱强度的年际变化特征,3个旬尺度的PC1在2024年均表现为显著正异常,且在历史序列中均位居前列,表明在2024年夏末秋初的3个阶段内,长江流域复合高温干旱事件强度均异常偏强。
图6
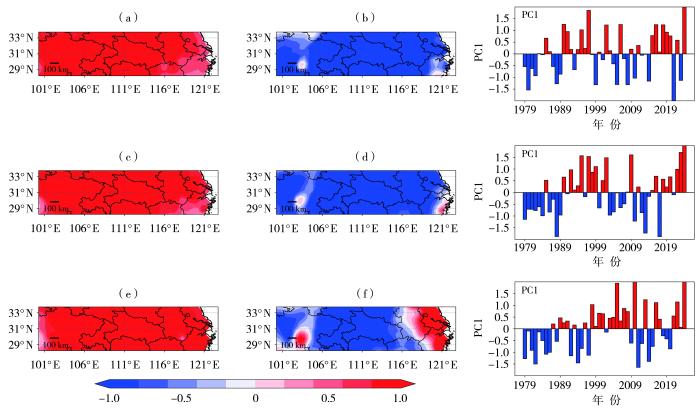
图6
1979—2024年8月21日—9月20日第一旬(a、b)、第二旬(c、d)及第三旬(e、f)平均Tmax(a、c、e)及平均降水量(b、d、f)联合MVEOF1的空间分布及其对应的共同PC1
Fig.6
Spatial distribution of average Tmax (a, c, e) and average precipitation (b, d, f) combined with MVEOF1 and their corresponding common PC1 for the first (a, b), second (c, d), and third (e, f) ten-day periods from August 21 to September 20 during 1979-2024
4.2 成因分析
为揭示上述遥相关模态对2024年长江流域复合高温干旱事件的影响机制,对各旬PC1序列分别与对应时段内的亚欧大陆200 hPa位势高度及赤道西太平洋区域OLR进行线性回归分析(图7)。从位势高度回归结果来看,第一、第二旬,亚欧大陆中高纬度上空呈现出典型的“+-+”三极型结构:欧洲东北部至新地岛之间为显著正回归区,俄罗斯西部至中亚地区为显著负回归区,而东亚地区30°N—45°N再次出现正回归信号。该波列结构沿亚洲急流带呈西北—东南走向,构成“两脊一槽”的典型高空环流形态,类似丝绸之路遥相关模态或不列颠—鄂霍次克遥相关模态(Xu et al.,2022)的一部分。该模态有利于在东亚维持高空反气旋系统,增强下沉运动与晴热控制,成为长江流域复合高温干旱事件形成的重要背景。第三旬,该波列结构显著减弱甚至消失,波列影响亦趋于减弱。在OLR回归场中,第二、第三旬分别在南海至菲律宾西部、菲律宾东北部至西太平洋一带出现大范围显著负回归区,其北侧中国南方地区对应为正回归区,呈现出类似东亚—太平洋遥相关模态的特征(Chen et al.,2019)。这表明,第二、第三旬的热带对流异常活跃可能通过经圈环流引发其北侧的补偿下沉运动,从而维持长江流域的干热异常;而在第一旬,南海—菲律宾—西太平洋(10°N—20°N,105°E—135°E)区域的热带对流信号不显著。
图7
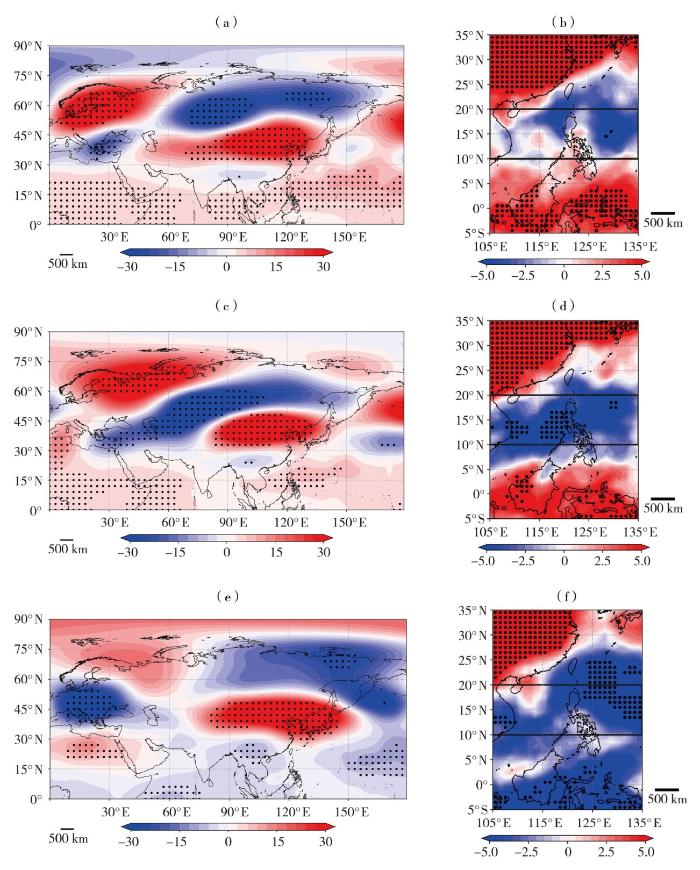
图7
1979—2024年8月21日—9月20日第一旬(a、b)、第二旬(c、d)及第三旬(e、f)PC1与亚欧大陆200 hPa位势高度(单位:gpm)(a、c、e)及南海—菲律宾—西太平洋区域OLR(单位:W·m-2)(b、d、f)回归系数的空间分布
[打点区域通过显著性检验(P≤0.05),下同;黑色矩形为南海—菲律宾—西太平洋区域]
Fig.7
Spatial distribution of regression coefficients of PC1 onto the 200 hPa geopotential height over the Eurasian continent (Unit: gpm) (a, c, e) and OLR (Unit: W·m-2) over the south China Sea-Philippines-western Pacific region (b, d, f) for the first (a, b), second (c, d), and third (e, f) ten-day periods during August 21-September 20, 1979-2024
(The dotted area passed significance test (P≤0.05), the same as below; the black rectangle denotes the south China Sea-Philippines-western Pacific region)
综上所述,2024年8月21日—9月20日,长江流域复合高温干旱可能受到亚欧大陆中高纬波列扰动与热带对流异常的交替、叠加影响:第一旬主要受中高纬波列调控,第二旬波列影响持续的同时热带对流开始显现,两类机制叠加驱动高温干旱的持续发展;第三旬波列强迫减弱,热带对流可能成为事件的主导因素。
图8为2024年“秋老虎”复合高温干旱事件中不同时段的关键环流特征,包括中高纬罗斯贝波列和低纬热带对流过程。第一旬,欧亚中高纬度呈典型的东传型罗斯贝波列,流函数距平场显示正负涡旋交替分布,波作用通量自欧洲延伸至东亚,形成连续“+-+”型结构。在蒙古高原至华北形成能量汇聚区,显著增强区域反气旋环流。同期中国南方中高层存在明显下沉,而南海—菲律宾—西太平洋上升运动较弱,表明下沉主要受中高纬波列强迫主导,热带对流作用有限。第二旬,罗斯贝波列结构稳定并略有加强,波作用通量更集中并持续向东传输。同时,南海—菲律宾—西太平洋对流显著增强,其北侧中国南方形成补偿性下沉气流,呈现局地哈德莱经圈环流结构。对流、下沉协同增强进一步强化长江流域反气旋性异常,支撑事件的持续发展。第三旬,罗斯贝波列逐渐减弱并发生模态转换,东传型结构被破坏,波作用通量零散。低纬上升运动较第二旬略弱且中心南移,长江流域仍有残余下沉,表明经圈环流机制在事件维持中仍发挥重要作用。
图8
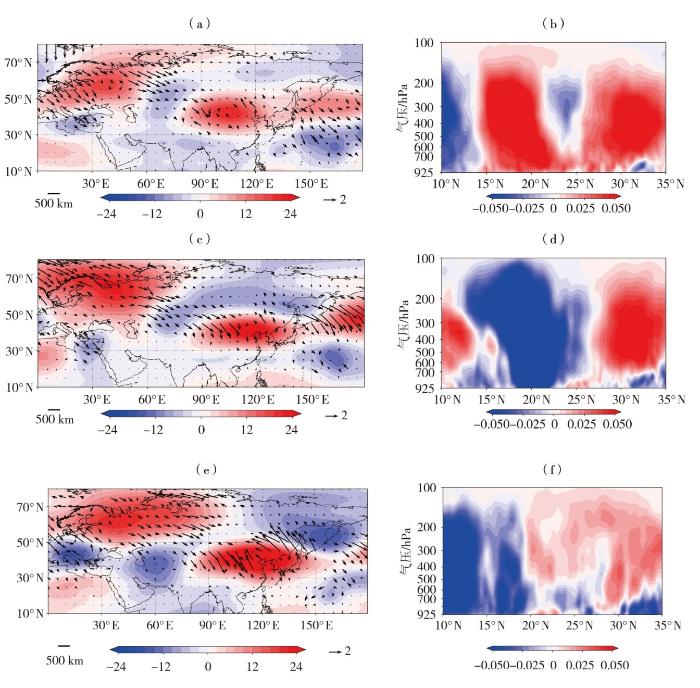
图8
2024年8月21日—9月20日第一旬(a、b)、第二旬(c、d)及第三旬(e、f)200 hPa流函数距平场(填色,单位:106 m2·s-1)和T-N波作用通量(矢量,单位:m²·s-2)(a、c、e),及105°E—120°E经向平均垂直速度剖面(负值表示上升运动,单位:Pa·s-1)(b、d、f)
Fig.8
Anomalous 200 hPa stream function (the color shaded, Unit: 106 m2·s-1) and T-N wave activity flux (vectors, Unit: m²·s-2) (a, c, e) and the meridional mean vertical velocity cross section averaged over 105°E—120°E (negative values indicate upward motion, Unit: Pa·s-1) (b, d, f) for the first (a, b), second (c, d), and third (e, f) ten-day periods during August 21-September 20 in 2024
综上,2024年夏末秋初,长江流域极端高温干旱事件呈现中高纬波列遥相关与热带对流引发的局地环流交替、叠加共同作用的特征:第一旬以波列强迫为主,第二旬波列与对流协同增强,第三旬以热带对流维持为主。两种机制在时间上具有阶段性,在空间上可能协同增强东亚反气旋系统,维持和发展复合高温干旱事件(图9)。
图9
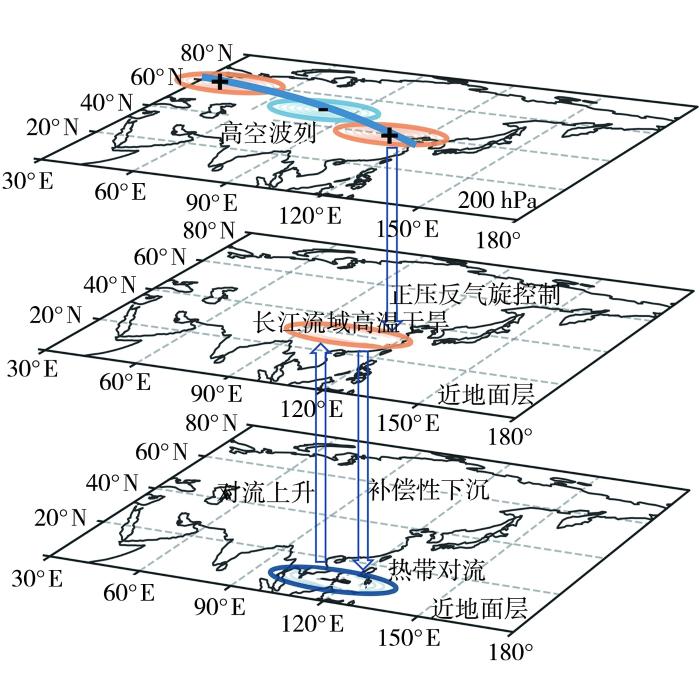
图9
2024年长江流域“秋老虎”型复合高温干旱事件机理示意图
Fig.9
A schematic diagram of the mechanism of “autumn tiger” event in the Yangtze River Basin in 2024
为进一步定量验证遥相关模态对复合高温干旱事件的影响,选取涵盖欧洲、中亚及东亚的关键区域,利用K均值聚类方法对区域内1979—2024年8月21日—9月20日的200 hPa位势高度异常场进行聚类分析,识别出典型的“+-+”型波列模态(Cluster 1)[图10(a)]。图10(b)显示,2024年8月21日—9月20日该模态出现频次为历史同期最高,31 d中有28 d属于Cluster 1型,定量表明该波列模态在本次事件中发挥了重要作用。图10(c)为8月21日—9月20日南海—菲律宾—西太平洋区域的OLR异常时间序列,结果显示2024年该区域对流异常强烈,OLR负距平达-17.6 W·m-2,为1979年以来同期第二强。图10(d)显示,南海—菲律宾—西太平洋OLR异常与长江流域(除西部高原山地外)500 hPa垂直速度呈显著负相关,表明该区域对流增强时,长江流域中层下沉运动同步增强,定量印证了热带对流在事件维持中的关键作用。
图10
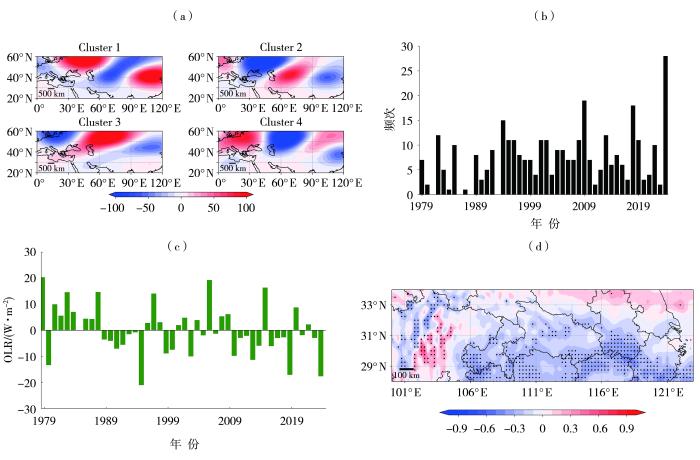
图10
1979—2024年8月21日—9月20日200 hPa位势高度距平场(单位:gpm)K均值聚类结果(a),Cluster 1型模态频次(b)及南海—菲律宾—西太平洋平均OLR异常(c)年际变化,南海—菲律宾—西太平洋平均OLR异常与长江流域500 hPa垂直速度异常的相关系数空间分布(d)
Fig.10
The K-means clustering results of the 200 hPa geopotential height anomaly field (Unit: gpm) (a), interannual variation of Cluster 1 mode frequency (b) and mean OLR anomaly over the south China Sea-Philippines-Western Pacific region (c), and spatial distribution of the correlation coefficients between mean OLR anomaly over the south China Sea-Philippines-Western Pacific region and 500 hPa vertical velocity anomaly in the Yangtze River Basin (d) from August 21 to September 20 during 1979-2024
5 结论
本研究聚焦于2024年7月28日—9月30日长江流域发生的一次持续65 d、覆盖范围广泛的极端复合高温干旱事件及其中的一次极端“秋老虎”事件,基于多源再分析资料,结合CC3D算法与日尺度标准化降水指数,使用MVEOF、线性回归等方法得出以下主要结论。
1)该复合事件整体高温强度达2.1 ℃,干旱强度为-0.64,最大影响范围覆盖517个格点,几乎涵盖整个长江流域,并呈现由长江中下游平原向四川盆地推进、强度随西移增强的空间演变特征。与盛夏阶段相比,夏末秋初阶段流域高温干旱显著加剧,Tmax正距平达到历史同期极值,平均降水量负距平为1998年以来同期最强,川西高原、四川盆地、鄂西及湘北等区域尤为突出,构成一次异常强烈的“秋老虎”事件。
2)“秋老虎”事件的形成和持续受中高纬波列扰动与低纬热带对流活动交替叠加驱动。第一旬,亚欧中高纬对流层上层形成典型“+-+”型罗斯贝波列结构,波作用通量向东南传播,显著增强东亚反气旋性异常,引发长江流域持续下沉、云量减少及短波辐射增强,触发复合高温干旱;第二旬,高纬波列持续稳定,同时南海—菲律宾—西太平洋热带对流显著增强,通过局地哈德莱型经圈环流在其北侧维持长江流域的下沉运动,低纬热力与高纬动力协同作用,进一步加剧高温干旱;第三旬,中高纬波列减弱并发生模态转换,远程动力影响减弱,而低纬热带对流仍活跃,局地经圈环流成为主导机制,持续维持高温干旱异常。
总体而言,中高纬动力过程与低纬热力过程时间上交替主导、空间上协同作用,是此次持续一个月的极端“秋老虎”事件形成与维持的关键环流背景。本研究进一步加深了对“秋老虎”型复合极端高温干旱事件的成因理解,为长江流域相关极端事件的监测、预报与风险评估提供了理论依据。
参考文献
中亚复合高温干旱事件识别与特征分析
[J].
由于复合高温干旱事件造成的综合效应远超普通干旱事件,复合高温干旱日益受到人们关注。基于中亚地区1981—2020年欧洲中期天气预报中心的第五代再分析陆地产品(Land Component of the Fifth Generation of European Reanalysis,ERA5-Land)的逐小时温度数据、月尺度潜在蒸散量数据和日尺度多源集成降水产品,计算标准化降水蒸散指数(Standardized Precipitation Evapotranspiration Index,SPEI)和日最高温度,识别复合高温干旱事件并分析其特征,得到以下结论:(1)复合高温干旱事件在中亚各地区空间分布上呈非集中趋势,1980年代、1990年代、2000年代和2010年代发生频次较高的区域分别位于东南部、北部、西北部和西部;(2)这些事件的时间分布表现出由大波动变为平稳小波动的趋势,且2020年之后将维持此平稳状态;(3)分析1984、1993、2010、2020年4个复合高温干旱事件典型年份,发现1984年高温干旱主要集中在中亚东南部,1993年仅零星地区偶发,2010年北部多发复合高温干旱事件,2020年则集中于西部地区。
湖北省区域性高温、干旱及其复合事件变化特征及危险性评估
[J].为评估气候变化对农业的潜在影响并科学地制定应对策略,本文基于1994—2023年湖北省76个国家级气象观测站逐日气温、降水等资料,根据区域性高温天气过程等级划分标准及干旱过程监测评估方法,识别和分析了湖北省区域性高温、干旱事件及其复合事件的变化特征和农业致灾危险性。结果表明,湖北省区域性高温事件平均每年发生4.3次,总体呈增加趋势,其中61.2%的特强和强高温事件集中在7—8月;区域性干旱事件平均每年发生1.5次,2010年前呈减少趋势,之后转为增加,冬春季的发生频次略高于夏秋季;区域性高温干旱复合事件多发生在6—8月,2010年后发生频次明显增加。区域性高温和干旱事件的强度及其农业致灾危险性的空间分布基本相似,高温事件的高强度和高危险区主要位于湖北省东部,而低值区位于西南部;干旱事件则以中部偏东区域为高值区,并向周围递减;高温干旱复合事件的致灾危险性从东部向西部递减。区域性高温、干旱及其复合事件分布最广的危险等级区域分别为高危险区、中危险区和极高危险区,其面积分别占湖北省总面积的37.6%、53.8%、46.6%。在全球气候变暖和极端天气事件频发的背景下,湖北省东部区域性极端高温、干旱及其复合事件的发生概率及致灾危险性预计将会增加。
Contribution of anthropogenic influence to the 2022-like Yangtze River valley compound heatwave and drought event
[J].In August 2022, an unprecedented compound heatwave and drought event (CHDE) lasting 24 days occurred in the Yangtze River valley (YRV), leading to a severe reduction of the crop, fresh water, and power supply. We constructed a joint cumulative probability distribution of heatwave and drought intensity, and found that the lowest probability-based index (PI) of 0.06 in 2022 was estimated as a 1-in-662-year event over the 1961–2022 climate. We then detected the fingerprint of greenhouse gas forcing to the observed PI in a generalized extreme value framework, but not the aerosol forcing, suggesting the leading contribution of greenhouse gas forcing on such extreme CHDE. Furthermore, anthropogenic influence had increased the probability of such CHDE by more than 10 times compared to the counterfactual climate. Also, the PI decreased from about 0.30 at the present climate to about 0.14 at the 3 °C global warming level, indicating that CHDE will become more extreme over YRV.
Role of land-atmosphere coupling in persistent extreme climate events in Eastern China in summer 2022
[J].
Persistent precipitation extremes in the Yangtze River Valley prolonged by opportune configuration among atmospheric teleconnections
[J].
Synoptic-scale precursors of the East Asia/Pacific teleconnection pattern responsible for persistent extreme precipitation in the Yangtze River Valley
[J].
Frequency of compound hot-dry weather extremes has significantly increased in Australia since 1889
[J].
Changes in the severity of compound drought and hot extremes over global land areas
[J].
Compound droughts and hot extremes: Characteristics, drivers, changes, and impacts
[J].
European summer synoptic circulations and their observed 2022 and projected influence on hot extremes and dry spells
[J].
Reconciling human and natural drivers of the tripole pattern of multidecadal summer temperature variations over Eurasia
[J].
Interannual variability of mid-summer heat wave frequency over the Sichuan Basin
[J].
Climate change 2021: The physical science basis
[R].
An observational investigation of spatiotemporally contiguous heatwaves in China from a 3D perspective
[J].
Anthropogenic forcing has increased the risk of longer-traveling and slower-moving large contiguous heatwaves
[J].Heatwaves are consecutive hot days with devastating impacts on human health and the environment. These events may evolve across both space and time, characterizing a spatiotemporally contiguous propagation pattern that has not been fully understood. Here, we track the spatiotemporally contiguous heatwaves in both reanalysis datasets and model simulations and examine their moving patterns (i.e., moving distance, speed, and direction) in different continents and periods. Substantial changes in contiguous heatwaves have been identified from 1979 to 2020, with longer persistence, longer traveling distance, and slower propagation. These changes have been amplified since 1997, probably due to the weakening of eddy kinetic energy, zonal wind, and anthropogenic forcing. The results suggest that longer-lived, longer-traveling, and slower-moving contiguous heatwaves will cause more devastating impacts on human health and the environment in the future if greenhouse gas emissions keep rising and no effective measures are taken immediately. Our findings provide important implications for the adaption and mitigation of globally connected extreme heatwaves.
Understanding changes in heat waves, droughts, and compound events in Yangtze River Valley and the corresponding atmospheric circulation patterns
[J].Heat waves, droughts, and compound drought and heat waves (CDHWs) have received extensive attention because of their disastrous impacts on agriculture, ecosystems, human health, and society. Here, we computed the heat wave magnitude index (HWMI), drought magnitude index (DMI), and compound drought and heat wave magnitude index (CDHMI) for Yangtze River Valley (YRV) from July to August during 1961–2022. We compared the large-scale atmospheric circulation characteristics of different extreme events based on these indexes. The results show that the positive center with sink motion in East Asia provides a favorable circulation background for heat wave events. Drought events are mainly affected by the zonal wave train dominated by a significant negative anomaly in Siberia and a high-pressure anomaly upstream, and a anticyclonic water vapor with strong divergence over the Yangtze River basin. During CDHW events, both anomalous systems that affect heat waves and droughts appear and strengthen simultaneously. Specifically, in the middle and upper troposphere, the positive height anomaly center in YRV expands abnormally, and the “+–+” wave train over the northern 50° N region of East Asia becomes more obvious. Therefore, the positive anomaly and water vapor anomaly brought by the two circulation patterns at different latitudes are superimposed over the YRV, leading to severe CDHWs. At the same time, the warm positive eddy center and cold negative eddy center in high latitudes exhibit more stable positive pressure features, which are conducive to the persistent development and strengthening of CDHWs. In addition, the anomalous warm sea surface temperature in western Pacific moderating the favorable circulation patterns may also promote the occurrence of CDHWs in the YRV during the same period.
Increased occurrence of high impact compound events under climate change
[J].While compound weather and climate events (CEs) can lead to significant socioeconomic consequences, their response to climate change is mostly unexplored. We report the first multi-model assessment of future changes in return periods for the co-occurrence of heatwaves and drought, and extreme winds and precipitation based on the Coupled Model Intercomparison Project (CMIP6) and three emission scenarios. Extreme winds and precipitation CEs occur more frequently in many regions, particularly under higher emissions. Heatwaves and drought occur more frequently everywhere under all emission scenarios examined. For each CMIP6 model, we derive a skill score for simulating CEs. Models with higher skill in simulating historical CEs project smaller increases in the number of heatwaves and drought in Eurasia, but larger numbers of strong winds and heavy precipitation CEs everywhere for all emission scenarios. This result is partly masked if the whole CMIP6 ensemble is used, pointing to the considerable value in further improvements in climate models.
Identification of compound drought and heatwave events on a daily scale and across four seasons
[J].. Compound drought and heatwave (CDHW) events can result in intensified damage to ecosystems, economies, and societies, especially on a warming planet. Although it has been reported that CDHW events in the winter season can also affect insects, birds, and the occurrence of wildfires, the literature generally focuses exclusively on the summer season. Moreover, the coarse temporal resolution of droughts as determined on a monthly scale may hamper the precise identification of the start and/or end dates of CDHW events. Therefore, we propose a method to identify CDHW events on a daily scale that is applicable across the four seasons. More specifically, we use standardized indices calculated on a daily scale to identify four types of compound events in a systematic way. Based on the hypothesis that droughts or heatwaves should be statistically extreme and independent, we remove minor dry or warm spells and merge mutually dependent ones. To demonstrate our method, we make use of 120 years of daily precipitation and temperature information observed at Uccle, Brussels-Capital Region, Belgium. Our method yields more precise start and end dates for droughts and heatwaves than those that can be obtained with a classical approach acting on a monthly scale, thereby allowing for a better identification of CDHW events. Consistent with existing literature, we find an increase in the number of days in CDHW events at Uccle, mainly due to the increasing frequency of heatwaves. Our results also reveal a seasonality in CDHW events, as droughts and heatwaves are negatively dependent on one another in the winter season at Uccle, whereas they are positively dependent on one another in the other seasons. Overall, the method proposed in this study is shown to be robust and displays potential for exploring how year-round CDHW events influence ecosystems.
Linkages of unprecedented 2022 Yangtze River Valley heatwaves to Pakistan flood and triple-dip La Niña
[J].In July-August 2022, Yangtze River Valley (YRV) experienced unprecedented hot summer, with the number of heatwave days exceeding climatology by four standard deviations. The heatwaves and associated severe droughts affected about 38 million people and caused devastating economic losses of about five billion US dollars. Here we present convergent empirical and modelling evidence to show that the record-breaking Pakistan rainfall, along with the 2022 tripe-dip La Niña, produces anomalous high pressure over YRV, causing intense heatwaves. The La Niña-induced second-highest sea surface temperature gradient in the equatorial western Pacific suppresses western Pacific convection and extends the subtropical high westward. More importantly, the tremendous diabatic heating associated with the unprecedented Pakistan rainfall reinforces the downstream Rossby wave train, extending the upper-level South Asia High eastward and controlling the entire YRV. The overlay of the two high-pressure systems sustains sinking motion and increases solar radiation reaching the ground, causing recurrent heat waves.
Climate change will accelerate the high-end risk of compound drought and heatwave events
[J].
Characteristic changes in compound drought and heatwave events under climate change
[J].
Persistent meteorological drought in the Yangtze River Basin during summer-autumn 2022: Relay effects of different atmospheric internal variabilities
[J].During the summer–autumn (July–October, Jul–Oct) period of 2022, the Yangtze River Basin (YRB) of China experienced an extreme meteorological drought, with Jul–Oct containing the lowest precipitation in the YRB since 1979. The possible causes of this drought were analyzed in the present study. Surprisingly, unlike many previous drought events, we found that this event was not characterized by a consistent atmospheric circulation anomaly regime throughout the entire drought period. Instead, two distinct circulation patterns were responsible for the precipitation deficit in two different stages, i.e., July–August (Jul–Aug) and September–October (Sep–Oct). In Jul–Aug, the YRB precipitation deficit primarily resulted from an intensified and northward-shifted East Asian subtropical jet, which allowed for an extremely northwestward shift of western Pacific subtropical highs, leading to an anomalous descending motion. Such circulation patterns in Jul–Aug originated from the dispersion of Rossby waves upstream from central Asia and Europe. Meanwhile, in Sep–Oct, the YRB drought was primarily attributed to a low-level cyclonic anomaly over the western North Pacific, which was closely associated with frequent tropical cyclones traveling across this region. Observational analysis and a model ensemble hindcast suggest that atmospheric internal variabilities dominated the drought process, while the SSTA, particularly the La Niña event, played a limited role. Therefore, this long-lasting extreme YRB meteorological drought was largely driven by the relay effects of different atmospheric internal variabilities in Jul–Aug and Sep–Oct, respectively, which shows limited model predictability and poses a great challenge for operational climate predictions.
Likelihood of compound dry and hot extremes increased with stronger dependence during warm seasons
[J].
Different mechanisms for the extremely hot central-eastern China in July-August 2022 from a Eurasian large-scale circulation perspective
[J].
Standardized precipitation index user guide (WMO-No. 1090)
[R].
Emerging interannual variability of compound heat waves over the Yangtze River valley since 2000
[J].The variability of daytime–nighttime compound heat waves (CHWs) is a highly concerning issue due to severe impacts on human and natural systems. Although several studies surveyed physical processes for the CHW occurrence, its interannual variability and associated mechanisms have not been well understood. Focusing on CHWs in the Yangtze River valley (YRV, a hotspot across China), this paper indicates an emergence of enlarged interannual variability after entering into the twenty-first century, before which the interannual variability was quite small. The possible mechanism underlying the high interannual variability is further explored in terms of atmospheric and oceanic backgrounds. The results show that the atmospheric background associated with higher-than-normal CHWs over the YRV features anticyclonic circulation anomalies tilting southeastward from the north of the YRV in the upper troposphere to the western Pacific in the lower troposphere. Accordingly, the upper-tropospheric easterly and lower-tropospheric southwesterly anomalies dominate the YRV, causing anomalous subsidence and increased humidity in situ, respectively, which benefit the increase in CHWs. The tripole (positive–negative–positive) sea surface temperature (SST) anomalies in the North Atlantic (NA) and the positive SST anomalies in the Maritime Continent (MC) also play roles in increasing the YRV CHWs by influencing the above atmospheric circulations. The NA tripole SST anomalies tend to affect the upper- and midtropospheric anticyclonic anomalies through the eastward-propagating wave train across Eurasia. The warming of the MC SSTs can impact the lower-tropospheric anticyclonic anomaly over the western Pacific via local meridional circulation. The opposite situations are applicable for decreased CHWs over the YRV.
The British-okhotsk corridor pattern and its linkage to the silk road pattern
[J].Based on observation and reanalysis datasets, numerical experiments with a simple dynamical model, and climate model outputs, this study investigates the second leading waveguide teleconnection along the summer polar front jet (PFJ) over Eurasia on the interannual time scale, the British–Okhotsk Corridor (BOC) pattern. The BOC pattern explains 20.8% of the total variance over northern Eurasia, which is only slightly lower than the first leading teleconnection, the British–Baikal Corridor pattern. It consists of four zonally oriented action centers over the British Isles, western Russia, northern Siberia, and the Sea of Okhotsk. It is primarily confined to northern Eurasia and leads to wavelike temperature and precipitation anomalies along its routine. Besides, it is occasionally coupled to the dominant waveguide teleconnection along the subtropical jet (STJ), the Silk Road pattern (SRP). A bifurcated wavelike pattern appears over Eurasia when the coupling is strong, with two branches of waves over the PFJ and the STJ, respectively. The fluctuations of the BOC–SRP linkage play a profound role in shaping the dominant climate variability modes over Eurasia. Numerical experiments with a simple dynamical model suggest that the basic flow cannot directly influence the BOC–SRP linkage by affecting the propagation condition of Rossby waves. Nevertheless, the basic flow can indirectly influence the linkage by changing the exciting locations of the BOC pattern through modulating the wave–mean flow interaction at the exit of the Atlantic jet stream. The climate model INMCM4.0 can reproduce the observed BOC–SRP linkage and its time-varying characteristics, supporting the observation and the proposed mechanism.
Prevalent atmospheric and oceanic signals of the unprecedented heatwaves over the Yangtze River Valley in July-August 2022
[J].
The extreme heat wave in China in August 2022 related to extreme northward movement of the eastern center of SAH
[J].

