The impact of mid-latitude atmospheric circulation anomalies on wildfires caused by California drought in summer 2024
YANG Yaoxian,1,2, YAO Yubi,1, YANG Rengui1, GAO Yubin1, ZHANG Weiwei1,6, DENG Mengyu3,4, XIAO Miaoyuan5
1. Lanzhou Resources & Environment Voc-Tech University, Lanzhou 730021, China
2. Nagqu Plateau Climate and Environment Observation and Research Station of Tibet Autonomous Region, Northwest Institute of Eco-Environment and Resources, Chinese Academy of Sciences, Nagqu 852000, Xizang, China
3. Sichuan Provincial Meteorological Observatory, Chengdu 610072, China
4. Heavy Rain and Drought-Flood Disasters in Plateau and Basin Key Laboratory of Sichuan Province, Chengdu 610072, China
5. Engineering Design & Research Institute of Sichuan University Co. Ltd., Chengdu 610065, China
6. Tiedong District Meteorological Bureau of Siping City, Jilin Province, Siping 136000, Jilin, China
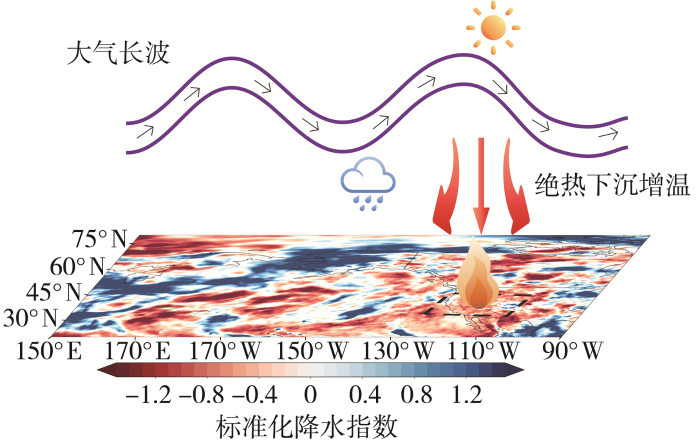
随着全球气候变暖,北半球夏季山林火灾事件频发,严重威胁生态环境。本文利用1980—2024年欧洲中期天气预报中心(European Center for Medium-Range Weather Forecasts,ECMWF)的ERA5逐日大气再分析资料与欧洲森林火灾信息系统(European Forest Fire Information System)的2024年夏季逐日火灾天气指数资料,基于天气尺度瞬变扰动的物理分解原理和大气长波活动诊断分析方法,对季节内和天气瞬变扰动两个时间尺度上的环流异常特点及影响2024年夏季美国加利福尼亚州(简称“加州”)山林火灾的机制进行了分析研究。结果表明:1)2024年7月上旬,北太平洋上空的准定常Rossby波能量向东传播,有助于北美大陆西岸异常高压反气旋的加强与维持,并通过绝热下沉增温,有利于山林火灾的爆发与蔓延。2)天气尺度瞬变扰动流场促使加州上空异常高压反气旋增强,进一步加强副热带高压,并提升山林火灾发生的风险。3)天气尺度瞬变扰动分解的结果表明,瞬变天气扰动场由于包含了天气尺度瞬变扰动过程中的纬向非对称性特征,其对区域性山林火灾发生的气象条件与风险指示意义明确,因此,天气尺度瞬变扰动场的分析可在山林火灾事件的预报预警中发挥作用。
关键词:加利福尼亚州;
山林火灾;
干旱;
环流异常;
天气尺度瞬变扰动
Abstract
Summer wildfires in the Northern Hemisphere occur more and more frequently under global warming, posing a serious threat to the ecological environment. This study utilized ERA5 daily atmospheric reanalysis data spanning from 1980 to 2024 and daily fire weather index data from the European Forest Fire Information System, and analyzed the causes of wildfire events in California in summer 2024 from the perspective of anomalous circulation in mid-high latitudes both on transient and intraseasonal timescales through the physical decomposition principle of transient asymmetric anomaly and diagnosis of wave activity. The results are as follows: 1) In early July 2024, the energy of quasi-steady Rossby waves over the North Pacific propagated eastward, which strengthened and maintained the anomalous anticyclone off the west coast of the North American continent. The temperature increase caused by adiabatic downward motion favored the occurrence and spread of wildfires. 2) The transient asymmetric anomalous flows indicate that the anomalous anticyclone over California has strengthened the subtropical high and increased the risk of wildfires. 3) The decomposition results of transient asymmetric anomaly show that the transient asymmetric anomalous flows can indicate the meteorological conditions and risk of wildfires more clearly. Therefore, the prediction of transient asymmetric flows should play a key role in the forecast and early warning for extreme weather events.
YANG Yaoxian, YAO Yubi, YANG Rengui, GAO Yubin, ZHANG Weiwei, DENG Mengyu, XIAO Miaoyuan. The impact of mid-latitude atmospheric circulation anomalies on wildfires caused by California drought in summer 2024[J]. Arid Meteorology, 2025, 43(5): 655-666 DOI:10.11755/j.issn.1006-7639-2025-05-0655
0 引言
在全球变暖背景下,干旱状况加剧,区域性高温干旱事件频发(Trenberth et al.,2015;林纾等,2022;李春华等,2024;颜鹏程等,2024;张强等,2025),全球易燃区域增加了29%,导致北半球暖季山林火灾事件频发,过火面积扩张(Senande-Rivera et al., 2022; Luo et al., 2024; Luo et al., 2025)。作为地球系统变化不可或缺的一部分,山林火灾不仅对社会经济、能源部门、人类健康、生态系统和生物多样性构成了严重威胁,而且还会通过释放温室气体和气溶胶以及改变区域下垫面类型和植被条件,从而对气候系统变化产生影响(Mack et al., 2011;Turetsky et al., 2015;Bowring et al., 2022)。例如,中高纬度地区的夏季山林火灾事件已成为全球火灾CO2排放的主要组成部分(Zheng et al., 2023)。已有研究表明,暖季山林火灾的发生受天气和气候因素复杂相互作用的驱动。在具备可燃植被的前提下,引发火灾的主要气象条件与风险因子包括地表温度升高、水汽压亏损增加、大气对流不稳定增强、闪电活动频发以及大风天气等(Sedano and Randerson, 2014; Pinto et al., 2020; Jain et al., 2022)。美国加利福尼亚州(简称“加州”)夏季常受副热带高压环流系统控制,主导下沉气流,炎热干燥,为山林火灾的发生提供了有利的气候背景(田永丽和王秋华,2019)。近年来,受气温变暖、降水减少及极端天气气候事件的影响,加州山林火灾频发,且蔓延速度快、过火面积大、破坏性强(田永丽和王秋华,2019;刘洋鹏等,2025),其中,2024年夏季,发生在当地时间6月15日的洛杉矶山林火灾(简称“6·15火灾”)过火面积达80 km2以上,一度导致公路关闭。此外,受高温天气影响,7月24日加州山林火灾,过火面积达1 616 km2(简称“7·24火灾”)。
高温与干旱等极端天气气候事件作为山林火灾发生的主要原因,研究分析其所对应的大气环流异常特征是评估分析山林火灾爆发与蔓延的气象条件与风险的必要环节。大气运动的根本原因是其对太阳辐射强迫的日、年、年际、年代际及更长时间尺度变化的响应。在空间上,又可以表示为行星尺度、天气尺度和中小尺度涡旋系统的叠加。当这些系统的强度和位置明显偏离气候平均状态时,极易引发极端天气事件,因此,对极端天气事件的预报分析本质上是对天气系统异常状态的识别与预报分析。钱维宏基于上述物理框架,提出了天气尺度瞬变扰动的物理分解法(钱维宏,2012)。该方法可将大气变量在时空域内物理分解成4个部分:前两项分别受季节演变的太阳辐射和海陆热力差异强迫,形成稳定的逐日气候态;第三项为年际和季节内尺度上,由热带热力强迫(如海温异常)或极地热力强迫(如极地放大增暖、海冰异常)引起的纬向平均瞬变扰动;第四项为较为复杂的天气尺度瞬变扰动项,受地形、热力强迫及大气内部变率的非线性过程影响。需要说明的是,对天气尺度瞬变扰动也可通过计算时间平均,分析其系统的稳定与持续性。目前,该方法在极端天气事件的预报分析中,已得到应用(钱维宏等,2012;钱维宏和张宗婕,2012)。此外,大气遥相关的多尺度变化也是引发极端天气气候事件的一个重要因子。有研究(Du and Lu, 2021; Du and Lu, 2022)指出,夏季北太平洋上空存在一支季节内遥远相关波列,并通过斜压能转换从气候平均的基本气流中获得扰动能量得以发展和维持,向东传播到北美大陆,因此,该波列可作为北美大陆极端天气气候事件预测的先导信号。
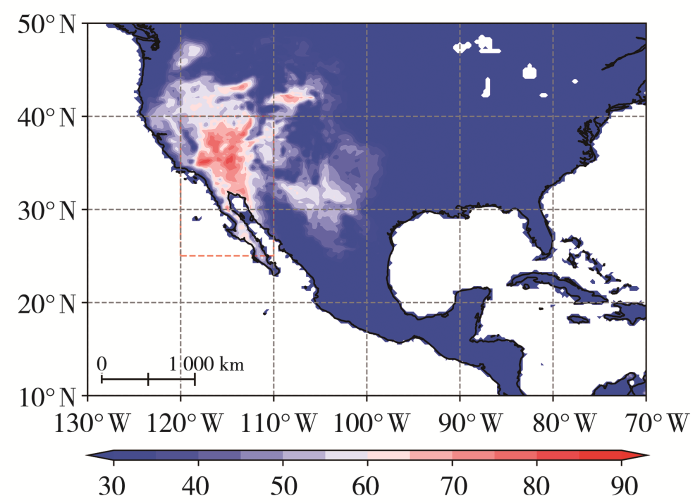
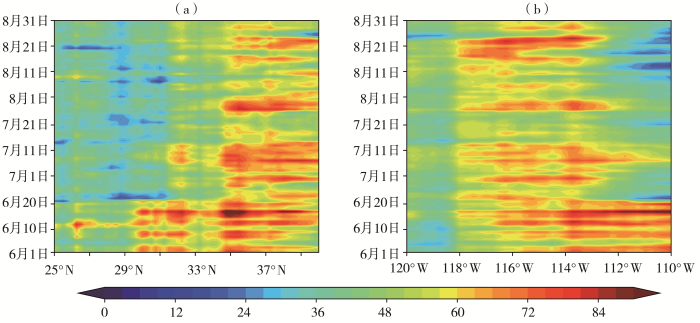
利用1980—2024年夏季欧洲中期天气预报中心(European Center for Medium-Range Weather Forecasts,ECMWF)第五代全球再分析资料(ERA5)的逐日数据(Hersbach et al., 2020),水平分辨率为0.25°×0.25°。所用变量包括不同等压面上的位势高度、纬向风、经向风、垂直速度,以及降水、地表气温和露点温度。此外,利用欧洲森林火灾信息系统(European Forest Fire Information System)的2024年夏季逐日火灾天气指数资料。目前,该指数已在全球山林火灾发生的气象条件与风险评估分析中得到广泛应用(Abatzoglou et al., 2019; Vitolo et al., 2019; Grillakis et al., 2022; Luo et al., 2024)。
饱和水汽压与实际水气压差定义为水汽压亏损(Vapor Pressure Deficit,VPD),该物理量能够综合反映大气的温湿状态,其高值区与高压系统相对应,反映出局地大气高温低湿的状态,有利于山林火灾的爆发(Luo et al., 2025)。因此,该物理量是常用的火灾风险指标,单位为hPa,具体数学表达式(Chiodi et al., 2021;Luo et al., 2025)如下:
全球火灾预报模式以温度、降水、风速和相对湿度为输入数据,结合燃料可用性与植被特征,通过计算细小燃料、腐质层的湿度及干旱状态,得到初始蔓延指数、中间指数和可燃物积累指数。综合3类指数后形成火灾天气指数,该指数综合考虑气温、相对湿度、风速、降水、干旱程度等气象要素的变化,为无量纲量,其核心表征火灾的蔓延速度和燃烧量,数值越大,火灾强度越强(Vitolo et al., 2019;Luo et al., 2024)。
此外,为分析研究区的干旱情况,本文采用标准化降水指数(Standardized Precipitation Index,SPI)来表征干旱状态,若该指数为负,则表明分析时段内干旱少雨。该方法适用于月以上尺度的干旱气候监测(周扬等,2013)。本文还利用集合经验模态分解(Ensemble Empirical Mode Decomposition,EEMD)方法,对大气波动指数进行时间尺度分解(Wu and Huang, 2009; Ji et al., 2014)。
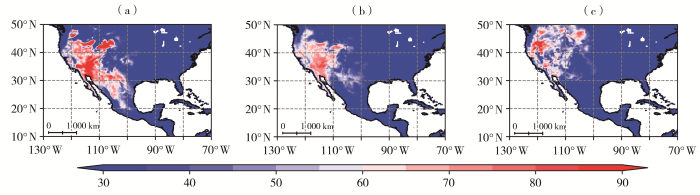
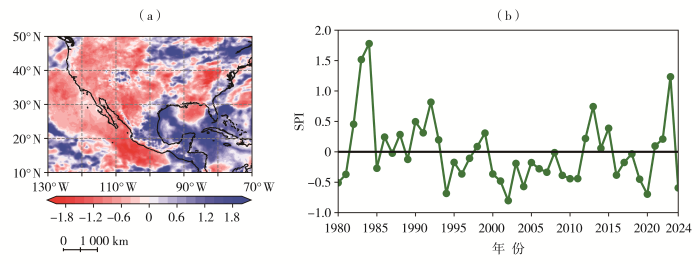
Fig.5
Spatial distribution of standardized precipitation index in the western United States in summer of 2024 (a) and inter-annual variations of the regional mean standardized precipitation index in California in summer from 1980 to 2024 (b)
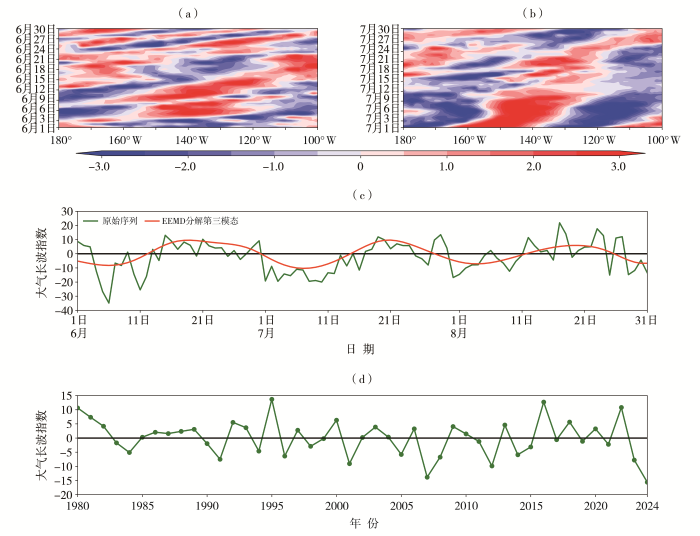
已有研究表明,夏季季节内尺度上,北太平洋上空的纬向波列通过斜压能转换,得以维持和发展,并向东传播,影响北美大陆的天气气候异常(Du and Lu, 2021; Du and Lu, 2022)。图6为2024年6月和7月逐日200 hPa瞬变扰动经向风沿45.75°N的时间-经度剖面以及2024年夏季大气长波指数逐日变化、1980—2024年7月1—11日大气长波指数年际变化。可以看出,2024年6月,大气波动以瞬变过程为主,未出现季节内尺度的定常信号[图6(a)、(c)]。2024年7月上旬,在170°W—160°W、150°W—140°W、120°W—110°W处,瞬变扰动经向风的位相基本不动,分别出现了持续的北风、南风和北风异常信号[图6(b)],结合大气长波指数的原始序列及其EEMD分解后的第三模态序列,发现EEMD分解后的序列呈现出显著的季节内变化特征[图6(c)],且与原始序列的相关系数为0.62,并通过置信水平为95%的显著性检验,且该时段大气波动处于稳定的负位相。此外,该时段平均大气波动指数的年际变化特征显示,2024年大气波动位于负位相最强处[图6(d)],进一步表明2024年7月上旬环流异常信号更为稳定,且扰动更为强烈。
Fig.6
The daily time-longitude sections of transient asymmetric anomalous meridional wind at 200 hPa along 45.75°N in June (a) and July (b) of 2024 (Unit: m·s-1), daily variation of atmospheric long-wave index in summer 2024 (c), and inter-annual variation of atmospheric long-wave index from July 1 to 11 during 1980-2024 (d)
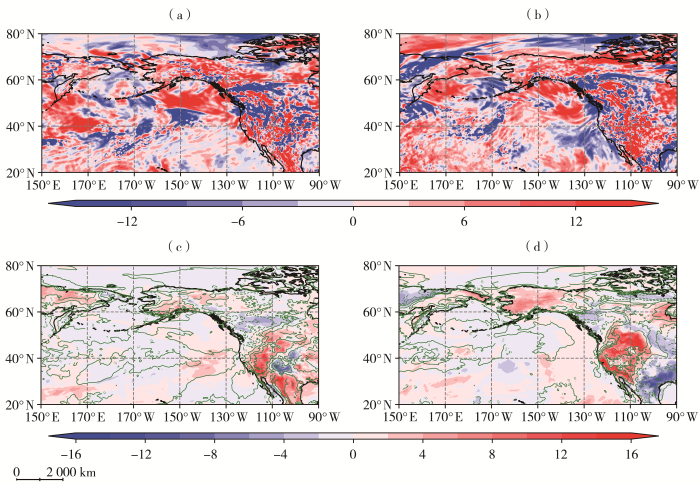
Fig.7
The averaged geopotential height perturbation field (the color shaded, Unit: gpm) and T-N wave activity fluxes (vectors, Unit: m2·s-2) at 200 hPa (a), geopotential height (the color shaded, Unit: gpm) and horizontal winds (vectors, Unit: m·s-1) perturbation field at 500 hPa (b), 500 hPa anomalous vertical velocity (the color shaded, Unit: 0.01 Pa·s-1) (c) and anomalous surface air temperature (green contour lines, Unit: K) and anomalous vapor pressure deficit field (the color shaded, Unit: hPa) (d) from 1 to 11 July 2024
(Yellow solid line and purple solid line represent 5 860 gpm feature line of geopotential height from1 to 11 July 2024 and climatology mean result, respectively)
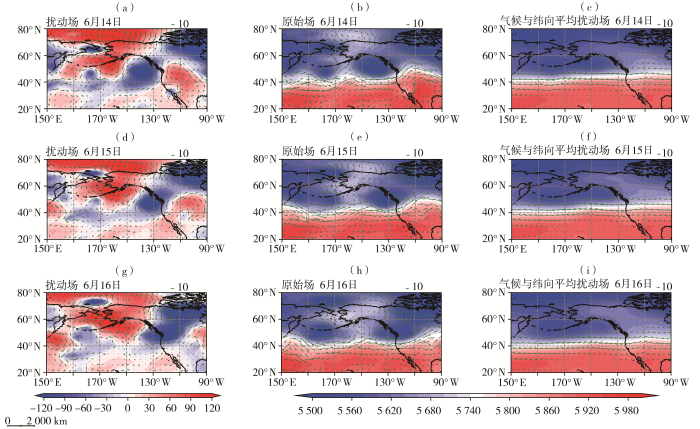
Fig.8
The synoptic-scale transient asymmetric anomalous fields (a, d, g), original fields (b, e, h), and the sum of climatology mean and anomalous zonal mean fields (c, f, i) of geopotential height field (the color shaded, Unit: gpm) and horizontal winds field (vectors, Unit: m·s-1) at 500 hPa from 14 to 16 June 2024
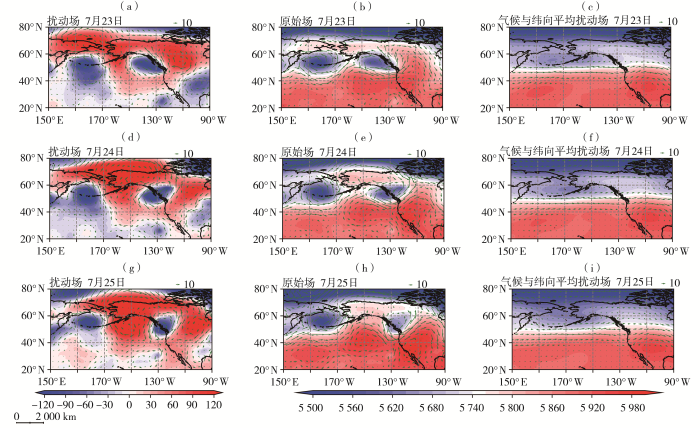
Fig.9
The synoptic-scale transient asymmetric anomalous fields (a, d, g), original fields (b, e, h), and the sum of climatology mean and anomalous zonal mean fields (c, f, i) of geopotential height field (the color shaded, Unit: gpm) and horizontal winds field (vectors, Unit: m·s-1) at 500 hPa from 23 to 25 June 2024
Fig.10
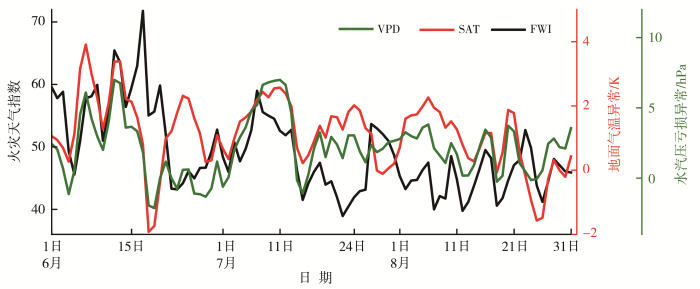
The anomalous vertical velocity at 500 hPa (the color shaded, Unit: 0.01 Pa·s-1) (a, b), anomalous surface air temperature (the green contour lines, Unit: K) and anomalous vapor pressure deficit (the color shaded, Unit: hPa) (c, d) on 15 June (a, c) and 24 July (b, d) 2024
大气环流异常对山林火灾发生及蔓延的影响在已有研究(田永丽和王秋华,2019;Luo et al., 2024; Luo et al., 2025)及本研究中均已表明,异常高压反气旋是引发山林火灾气象风险的主要因子。但受时间尺度、季节背景及山林火灾区域差异影响,异常高压反气旋的强度、位置及形成也存在显著差异。
在气候变暖背景下,2022年夏季我国出现1961年以来平均气温最高和降水量次少的气候异常,并伴有最强的全国性(东北地区除外)高温过程和长江中下游及川渝地区大范围强伏旱。针对这次高温干旱的持续性和极端性,本文基于2022年6—8月全国2162个气象站逐日最高气温和降水量以及NCEP(National Centers for Environmental Prediction)/NCAR(National Center for Atmospheric Research)逐日再分析资料等,分析其时空分布特征及环流形势,将对今后我国南方地区夏季高温干旱不同时间尺度的预报预测有一定参考价值。结果表明:2022年夏季,全国76.0%的站共出现48 198次高温,其中36.6%的站累计出现3001次极端高温事件,20次以上极端高温事件的站点均分布在四川盆地,高温状况远超21世纪以来的典型高温年份。全国性的高温过程从6月13日持续到8月30日,共计79 d,高温最强时段在8月11—24日。按照高温发生站次、持续时间、影响范围、强度等由强到弱综合排序,依次是华东、西南、华中、西北、华北和华南地区,其中西南地区极端性最强,而东北地区未出现高温。干旱时空分布特征与高温基本相似,全国最强干旱时段在8月中旬。2022年夏季,500 hPa欧亚中高纬度呈“两脊一槽”型,尤其在7—8月乌拉尔山和鄂霍次克海附近高压脊形成阶段性阻塞高压,强盛的副热带系统将两高之间活跃的冷空气大部分时段阻挡在50°N以北,造成我国“北涝南旱”的格局;低纬度的伊朗高压异常东伸,西太平洋副热带高压略偏北且异常西伸,两高压长时间贯通形成的高压带控制区气流辐散下沉,并持续阻碍水汽向中纬度输送,不利于长江流域产生降水。同时,对流层高层南亚高压异常偏东,与中层的西太平洋副热带高压相向而行,于8月中下旬在80°E—120°E范围内叠加,致使控制我国大范围的高压系统呈稳定正压结构,中心位于川渝上空,致使川渝地区成为高温日数和极端高温事件次数的高值中心。
Changes in global fire activity are influenced by a multitude of factors including land-cover change, policies, and climatic conditions. This study uses 17 climate models to evaluate when changes in fire weather, as realized through the Fire Weather Index, emerge from the expected range of internal variability due to anthropogenic climate change using the time of emergence framework. Anthropogenic increases in extreme Fire Weather Index days emerge for 22% of burnable land area globally by 2019, including much of the Mediterranean and the Amazon. By the midtwenty-first century, emergence among the different Fire Weather Index metrics occurs for 33-62% of burnable lands. Emergence of heightened fire weather becomes more widespread as a function of global temperature change. At 2 degrees C above preindustrial levels, the area of emergence is half that for 3 degrees C. These results highlight increases in fire weather conditions with human-caused climate change and incentivize local adaptation efforts to limit detrimental fire impacts. Plain Language Summary Observed increases in the frequency and severity of fire weather have been observed across portions of the globe over the past half century. We used climate models to identify where and when anthropogenic climate change causes fire weather conditions to exceed that of natural variability. Modeling results show that emergence for some fire weather indices is already under way for a sizable portion of the globe, including much of southern Europe and the Amazon, and with an expansion of this area with continued warming over the twenty-first century. These findings suggest substantial increases in fire potential in regions where vegetation abundance and ignitions are not limiting, highlighting the urgency to adapt to changes in fire disturbances and hazards.
BOWRINGS P K, JONESM W, CIAISP, et al,2022.
Pyrogenic carbon decomposition critical to resolving fire’s role in the Earth system
Wildfire is an integral part of the Earth system, but at the same time it can pose serious threats to human society and to certain types of terrestrial ecosystems. Meteorological conditions are a key driver of wildfire activity and extent, which led to the emergence of the use of fire danger indices that depend solely on weather conditions. The Canadian Fire Weather Index (FWI) is a widely used fire danger index of this kind. Here, we evaluate how well the FWI, its components, and the climate variables from which it is derived, correlate with observation-based burned area (BA) for a variety of world regions. We use a novel technique, according to which monthly BA are grouped by size for each Global Fire Emissions Database (GFED) pyrographic region. We find strong correlations of BA anomalies with the FWI anomalies, as well as with the underlying deviations from their climatologies for the four climate variables from which FWI is estimated, namely, temperature, relative humidity, precipitation, and wind. We quantify the relative sensitivity of the observed BA to each of the four climate variables, finding that this relationship strongly depends on the pyrographic region and land type. Our results indicate that the BA anomalies strongly correlate with FWI anomalies at a GFED region scale, compared to the strength of the correlation with individual climate variables. Additionally, among the individual climate variables that comprise the FWI, relative humidity and temperature are the most influential factors that affect the observed BA. Our results support the use of the composite fire danger index FWI, as well as its sub-indices, the Build-Up Index (BUI) and the Initial Spread Index (ISI), comparing to single climate variables, since they are found to correlate better with the observed forest or non-forest BA, for the most regions across the globe.
HERSBACHH, BELLB, BERRISFORDP, et al,2020.
The ERA5 global reanalysis
[J]. Quarterly Journal of the Royal Meteorological Society, 146(730):1 999-2 049.
The Fire Weather Index (FWI) is widely used to assess the meteorological fire danger in several ecosystems worldwide. One shortcoming of the FWI is that only surface weather conditions are considered, despite the important role often played by atmospheric instability in the development of very large wildfires. In this work, we focus on the Iberian Peninsula for the period spanning 2004–2018. We show that atmospheric instability, assessed by the Continuous Haines Index (CHI), can be used to improve estimates of the probability of exceedance of energy released by fires. To achieve this, we consider a Generalized Pareto (GP) model and we show that by stepwisely introducing the FWI and then the CHI as covariates of the GP parameters, the model is improved at each stage. A comprehensive comparison of results using the GP with the FWI as a covariate and the GP with both the FWI and CHI as covariates allowed us to then define a correction to the FWI, dependent on the CHI, that we coined enhanced FWI (FWIe). Besides ensuring a better performance of this improved FWI version, it is important to stress that the proposed FWIe incorporates efficiently the effect of atmospheric instability into an estimation of fire weather danger and can be easily incorporated into existing systems.
SEDANOF, RANDERSONJ T,2014.
Multi-scale influence of vapor pressure deficit on fire ignition and spread in boreal forest ecosystems
. Climate-driven changes in the fire regime within boreal forest ecosystems are likely to have important effects on carbon cycling and species composition. In the context of improving fire management options and developing more realistic scenarios of future change, it is important to understand how meteorology regulates different aspects of fire dynamics, including ignition, daily fire spread, and cumulative annual burned area. Here we combined Moderate-Resolution Imaging Spectroradiometer (MODIS) active fires (MCD14ML), MODIS imagery (MOD13A1) and ancillary historic fire perimeter information to produce a data set of daily fire spread maps for Alaska during 2002–2011. This approach provided a spatial and temporally continuous representation of fire progression and a precise identification of ignition and extinction locations and dates for each wildfire. The fire-spread maps were analyzed with daily vapor pressure deficit (VPD) observations from the North American Regional Reanalysis (NARR) and lightning strikes from the Alaska Lightning Detection Network (ALDN). We found a significant relationship between daily VPD and likelihood that a lightning strike would develop into a fire ignition. In the first week after ignition, above average VPD increased the probability that fires would grow to large or very large sizes. Strong relationships also were identified between VPD and burned area at several levels of temporal and spatial aggregation. As a consequence of regional coherence in meteorology, ignition, daily fire spread, and fire extinction events were often synchronized across different fires in interior Alaska. At a regional scale, the sum of positive VPD anomalies during the fire season was positively correlated with annual burned area during the NARR era (1979–2011; R2 = 0.45). Some of the largest fires we mapped had slow initial growth, indicating opportunities may exist for suppression efforts to adaptively manage these forests for climate change. The results of our spatiotemporal analysis provide new information about temporal and spatial dynamics of wildfires and have implications for modeling the terrestrial carbon cycle.\n
Global warming is expected to alter wildfire potential and fire season severity, but the magnitude and location of change is still unclear. Here, we show that climate largely determines present fire-prone regions and their fire season. We categorize these regions according to the climatic characteristics of their fire season into four classes, within general Boreal, Temperate, Tropical and Arid climate zones. Based on climate model projections, we assess the modification of the fire-prone regions in extent and fire season length at the end of the 21st century. We find that due to global warming, the global area with frequent fire-prone conditions would increase by 29%, mostly in Boreal (+111%) and Temperate (+25%) zones, where there may also be a significant lengthening of the potential fire season. Our estimates of the global expansion of fire-prone areas highlight the large but uneven impact of a warming climate on Earth’s environment.
TAKAYAK, NAKAMURAH,2001.
A formulation of a phase-independent wave-activity flux for stationary and migratory quasigeostrophic eddies on a zonally varying basic flow
[J]. Journal of the Atmospheric Sciences, 58(6): 608-627.
This data descriptor documents a dataset containing over 38 years of global reanalysis of wildfire danger. It consists of seven fields to assess fuel moisture as well as fire behavior. The methodology employed to generate these data is based on the Canadian Forest Fire Weather Danger Rating and utilizes weather forcing from ERA-Interim, a global reanalysis dataset produced by the European Centre for Medium-range Weather Forecasts. Global fire danger reanalysis data are used to quantify the climatological expectation of fire danger at a certain time of the year and for any location on the globe. It can be regarded as a complementary product to the fire danger forecasts issued daily by the Global Wildfire Information System (GWIS) under the umbrella of the European Copernicus program.
WUZ H, HUANGN E,2009.
Ensemble empirical mode decomposition:A noise-assisted data analysis method
[J]. Advances in Adaptive Data Analysis, 1(1): 1-41.
A new Ensemble Empirical Mode Decomposition (EEMD) is presented. This new approach consists of sifting an ensemble of white noise-added signal (data) and treats the mean as the final true result. Finite, not infinitesimal, amplitude white noise is necessary to force the ensemble to exhaust all possible solutions in the sifting process, thus making the different scale signals to collate in the proper intrinsic mode functions (IMF) dictated by the dyadic filter banks. As EEMD is a time–space analysis method, the added white noise is averaged out with sufficient number of trials; the only persistent part that survives the averaging process is the component of the signal (original data), which is then treated as the true and more physical meaningful answer. The effect of the added white noise is to provide a uniform reference frame in the time–frequency space; therefore, the added noise collates the portion of the signal of comparable scale in one IMF. With this ensemble mean, one can separate scales naturally without any a priori subjective criterion selection as in the intermittence test for the original EMD algorithm. This new approach utilizes the full advantage of the statistical characteristics of white noise to perturb the signal in its true solution neighborhood, and to cancel itself out after serving its purpose; therefore, it represents a substantial improvement over the original EMD and is a truly noise-assisted data analysis (NADA) method.
ZHENGB, CIAISP, CHEVALLIERF, et al,2023.
Record-high CO2 emissions from boreal fires in 2021
Extreme wildfires are becoming more common and increasingly affecting Earth’s climate. Wildfires in boreal forests have attracted much less attention than those in tropical forests, although boreal forests are one of the most extensive biomes on Earth and are experiencing the fastest warming. We used a satellite-based atmospheric inversion system to monitor fire emissions in boreal forests. Wildfires are rapidly expanding into boreal forests with emerging warmer and drier fire seasons. Boreal fires, typically accounting for 10% of global fire carbon dioxide emissions, contributed 23% (0.48 billion metric tons of carbon) in 2021, by far the highest fraction since 2000. 2021 was an abnormal year because North American and Eurasian boreal forests synchronously experienced their greatest water deficit. Increasing numbers of extreme boreal fires and stronger climate–fire feedbacks challenge climate mitigation efforts.
我国干旱半干旱区近60 a气象干旱气候特征分析
1
2024
... 在全球变暖背景下,干旱状况加剧,区域性高温干旱事件频发(Trenberth et al.,2015;林纾等,2022;李春华等,2024;颜鹏程等,2024;张强等,2025),全球易燃区域增加了29%,导致北半球暖季山林火灾事件频发,过火面积扩张(Senande-Rivera et al., 2022; Luo et al., 2024; Luo et al., 2025).作为地球系统变化不可或缺的一部分,山林火灾不仅对社会经济、能源部门、人类健康、生态系统和生物多样性构成了严重威胁,而且还会通过释放温室气体和气溶胶以及改变区域下垫面类型和植被条件,从而对气候系统变化产生影响(Mack et al., 2011;Turetsky et al., 2015;Bowring et al., 2022).例如,中高纬度地区的夏季山林火灾事件已成为全球火灾CO2排放的主要组成部分(Zheng et al., 2023).已有研究表明,暖季山林火灾的发生受天气和气候因素复杂相互作用的驱动.在具备可燃植被的前提下,引发火灾的主要气象条件与风险因子包括地表温度升高、水汽压亏损增加、大气对流不稳定增强、闪电活动频发以及大风天气等(Sedano and Randerson, 2014; Pinto et al., 2020; Jain et al., 2022).美国加利福尼亚州(简称“加州”)夏季常受副热带高压环流系统控制,主导下沉气流,炎热干燥,为山林火灾的发生提供了有利的气候背景(田永丽和王秋华,2019).近年来,受气温变暖、降水减少及极端天气气候事件的影响,加州山林火灾频发,且蔓延速度快、过火面积大、破坏性强(田永丽和王秋华,2019;刘洋鹏等,2025),其中,2024年夏季,发生在当地时间6月15日的洛杉矶山林火灾(简称“6·15火灾”)过火面积达80 km2以上,一度导致公路关闭.此外,受高温天气影响,7月24日加州山林火灾,过火面积达1 616 km2(简称“7·24火灾”). ...
2022年夏季我国高温干旱特征及其环流形势分析
1
2022
... 在全球变暖背景下,干旱状况加剧,区域性高温干旱事件频发(Trenberth et al.,2015;林纾等,2022;李春华等,2024;颜鹏程等,2024;张强等,2025),全球易燃区域增加了29%,导致北半球暖季山林火灾事件频发,过火面积扩张(Senande-Rivera et al., 2022; Luo et al., 2024; Luo et al., 2025).作为地球系统变化不可或缺的一部分,山林火灾不仅对社会经济、能源部门、人类健康、生态系统和生物多样性构成了严重威胁,而且还会通过释放温室气体和气溶胶以及改变区域下垫面类型和植被条件,从而对气候系统变化产生影响(Mack et al., 2011;Turetsky et al., 2015;Bowring et al., 2022).例如,中高纬度地区的夏季山林火灾事件已成为全球火灾CO2排放的主要组成部分(Zheng et al., 2023).已有研究表明,暖季山林火灾的发生受天气和气候因素复杂相互作用的驱动.在具备可燃植被的前提下,引发火灾的主要气象条件与风险因子包括地表温度升高、水汽压亏损增加、大气对流不稳定增强、闪电活动频发以及大风天气等(Sedano and Randerson, 2014; Pinto et al., 2020; Jain et al., 2022).美国加利福尼亚州(简称“加州”)夏季常受副热带高压环流系统控制,主导下沉气流,炎热干燥,为山林火灾的发生提供了有利的气候背景(田永丽和王秋华,2019).近年来,受气温变暖、降水减少及极端天气气候事件的影响,加州山林火灾频发,且蔓延速度快、过火面积大、破坏性强(田永丽和王秋华,2019;刘洋鹏等,2025),其中,2024年夏季,发生在当地时间6月15日的洛杉矶山林火灾(简称“6·15火灾”)过火面积达80 km2以上,一度导致公路关闭.此外,受高温天气影响,7月24日加州山林火灾,过火面积达1 616 km2(简称“7·24火灾”). ...
广东省森林火灾形势与应对措施探讨: 基于美国加州大火启示分析
1
2025
... 在全球变暖背景下,干旱状况加剧,区域性高温干旱事件频发(Trenberth et al.,2015;林纾等,2022;李春华等,2024;颜鹏程等,2024;张强等,2025),全球易燃区域增加了29%,导致北半球暖季山林火灾事件频发,过火面积扩张(Senande-Rivera et al., 2022; Luo et al., 2024; Luo et al., 2025).作为地球系统变化不可或缺的一部分,山林火灾不仅对社会经济、能源部门、人类健康、生态系统和生物多样性构成了严重威胁,而且还会通过释放温室气体和气溶胶以及改变区域下垫面类型和植被条件,从而对气候系统变化产生影响(Mack et al., 2011;Turetsky et al., 2015;Bowring et al., 2022).例如,中高纬度地区的夏季山林火灾事件已成为全球火灾CO2排放的主要组成部分(Zheng et al., 2023).已有研究表明,暖季山林火灾的发生受天气和气候因素复杂相互作用的驱动.在具备可燃植被的前提下,引发火灾的主要气象条件与风险因子包括地表温度升高、水汽压亏损增加、大气对流不稳定增强、闪电活动频发以及大风天气等(Sedano and Randerson, 2014; Pinto et al., 2020; Jain et al., 2022).美国加利福尼亚州(简称“加州”)夏季常受副热带高压环流系统控制,主导下沉气流,炎热干燥,为山林火灾的发生提供了有利的气候背景(田永丽和王秋华,2019).近年来,受气温变暖、降水减少及极端天气气候事件的影响,加州山林火灾频发,且蔓延速度快、过火面积大、破坏性强(田永丽和王秋华,2019;刘洋鹏等,2025),其中,2024年夏季,发生在当地时间6月15日的洛杉矶山林火灾(简称“6·15火灾”)过火面积达80 km2以上,一度导致公路关闭.此外,受高温天气影响,7月24日加州山林火灾,过火面积达1 616 km2(简称“7·24火灾”). ...
天气尺度瞬变扰动的物理分解原理
3
2012
... 高温与干旱等极端天气气候事件作为山林火灾发生的主要原因,研究分析其所对应的大气环流异常特征是评估分析山林火灾爆发与蔓延的气象条件与风险的必要环节.大气运动的根本原因是其对太阳辐射强迫的日、年、年际、年代际及更长时间尺度变化的响应.在空间上,又可以表示为行星尺度、天气尺度和中小尺度涡旋系统的叠加.当这些系统的强度和位置明显偏离气候平均状态时,极易引发极端天气事件,因此,对极端天气事件的预报分析本质上是对天气系统异常状态的识别与预报分析.钱维宏基于上述物理框架,提出了天气尺度瞬变扰动的物理分解法(钱维宏,2012).该方法可将大气变量在时空域内物理分解成4个部分:前两项分别受季节演变的太阳辐射和海陆热力差异强迫,形成稳定的逐日气候态;第三项为年际和季节内尺度上,由热带热力强迫(如海温异常)或极地热力强迫(如极地放大增暖、海冰异常)引起的纬向平均瞬变扰动;第四项为较为复杂的天气尺度瞬变扰动项,受地形、热力强迫及大气内部变率的非线性过程影响.需要说明的是,对天气尺度瞬变扰动也可通过计算时间平均,分析其系统的稳定与持续性.目前,该方法在极端天气事件的预报分析中,已得到应用(钱维宏等,2012;钱维宏和张宗婕,2012).此外,大气遥相关的多尺度变化也是引发极端天气气候事件的一个重要因子.有研究(Du and Lu, 2021; Du and Lu, 2022)指出,夏季北太平洋上空存在一支季节内遥远相关波列,并通过斜压能转换从气候平均的基本气流中获得扰动能量得以发展和维持,向东传播到北美大陆,因此,该波列可作为北美大陆极端天气气候事件预测的先导信号. ...
... 高温与干旱等极端天气气候事件作为山林火灾发生的主要原因,研究分析其所对应的大气环流异常特征是评估分析山林火灾爆发与蔓延的气象条件与风险的必要环节.大气运动的根本原因是其对太阳辐射强迫的日、年、年际、年代际及更长时间尺度变化的响应.在空间上,又可以表示为行星尺度、天气尺度和中小尺度涡旋系统的叠加.当这些系统的强度和位置明显偏离气候平均状态时,极易引发极端天气事件,因此,对极端天气事件的预报分析本质上是对天气系统异常状态的识别与预报分析.钱维宏基于上述物理框架,提出了天气尺度瞬变扰动的物理分解法(钱维宏,2012).该方法可将大气变量在时空域内物理分解成4个部分:前两项分别受季节演变的太阳辐射和海陆热力差异强迫,形成稳定的逐日气候态;第三项为年际和季节内尺度上,由热带热力强迫(如海温异常)或极地热力强迫(如极地放大增暖、海冰异常)引起的纬向平均瞬变扰动;第四项为较为复杂的天气尺度瞬变扰动项,受地形、热力强迫及大气内部变率的非线性过程影响.需要说明的是,对天气尺度瞬变扰动也可通过计算时间平均,分析其系统的稳定与持续性.目前,该方法在极端天气事件的预报分析中,已得到应用(钱维宏等,2012;钱维宏和张宗婕,2012).此外,大气遥相关的多尺度变化也是引发极端天气气候事件的一个重要因子.有研究(Du and Lu, 2021; Du and Lu, 2022)指出,夏季北太平洋上空存在一支季节内遥远相关波列,并通过斜压能转换从气候平均的基本气流中获得扰动能量得以发展和维持,向东传播到北美大陆,因此,该波列可作为北美大陆极端天气气候事件预测的先导信号. ...
... 高温与干旱等极端天气气候事件作为山林火灾发生的主要原因,研究分析其所对应的大气环流异常特征是评估分析山林火灾爆发与蔓延的气象条件与风险的必要环节.大气运动的根本原因是其对太阳辐射强迫的日、年、年际、年代际及更长时间尺度变化的响应.在空间上,又可以表示为行星尺度、天气尺度和中小尺度涡旋系统的叠加.当这些系统的强度和位置明显偏离气候平均状态时,极易引发极端天气事件,因此,对极端天气事件的预报分析本质上是对天气系统异常状态的识别与预报分析.钱维宏基于上述物理框架,提出了天气尺度瞬变扰动的物理分解法(钱维宏,2012).该方法可将大气变量在时空域内物理分解成4个部分:前两项分别受季节演变的太阳辐射和海陆热力差异强迫,形成稳定的逐日气候态;第三项为年际和季节内尺度上,由热带热力强迫(如海温异常)或极地热力强迫(如极地放大增暖、海冰异常)引起的纬向平均瞬变扰动;第四项为较为复杂的天气尺度瞬变扰动项,受地形、热力强迫及大气内部变率的非线性过程影响.需要说明的是,对天气尺度瞬变扰动也可通过计算时间平均,分析其系统的稳定与持续性.目前,该方法在极端天气事件的预报分析中,已得到应用(钱维宏等,2012;钱维宏和张宗婕,2012).此外,大气遥相关的多尺度变化也是引发极端天气气候事件的一个重要因子.有研究(Du and Lu, 2021; Du and Lu, 2022)指出,夏季北太平洋上空存在一支季节内遥远相关波列,并通过斜压能转换从气候平均的基本气流中获得扰动能量得以发展和维持,向东传播到北美大陆,因此,该波列可作为北美大陆极端天气气候事件预测的先导信号. ...
... 在全球变暖背景下,干旱状况加剧,区域性高温干旱事件频发(Trenberth et al.,2015;林纾等,2022;李春华等,2024;颜鹏程等,2024;张强等,2025),全球易燃区域增加了29%,导致北半球暖季山林火灾事件频发,过火面积扩张(Senande-Rivera et al., 2022; Luo et al., 2024; Luo et al., 2025).作为地球系统变化不可或缺的一部分,山林火灾不仅对社会经济、能源部门、人类健康、生态系统和生物多样性构成了严重威胁,而且还会通过释放温室气体和气溶胶以及改变区域下垫面类型和植被条件,从而对气候系统变化产生影响(Mack et al., 2011;Turetsky et al., 2015;Bowring et al., 2022).例如,中高纬度地区的夏季山林火灾事件已成为全球火灾CO2排放的主要组成部分(Zheng et al., 2023).已有研究表明,暖季山林火灾的发生受天气和气候因素复杂相互作用的驱动.在具备可燃植被的前提下,引发火灾的主要气象条件与风险因子包括地表温度升高、水汽压亏损增加、大气对流不稳定增强、闪电活动频发以及大风天气等(Sedano and Randerson, 2014; Pinto et al., 2020; Jain et al., 2022).美国加利福尼亚州(简称“加州”)夏季常受副热带高压环流系统控制,主导下沉气流,炎热干燥,为山林火灾的发生提供了有利的气候背景(田永丽和王秋华,2019).近年来,受气温变暖、降水减少及极端天气气候事件的影响,加州山林火灾频发,且蔓延速度快、过火面积大、破坏性强(田永丽和王秋华,2019;刘洋鹏等,2025),其中,2024年夏季,发生在当地时间6月15日的洛杉矶山林火灾(简称“6·15火灾”)过火面积达80 km2以上,一度导致公路关闭.此外,受高温天气影响,7月24日加州山林火灾,过火面积达1 616 km2(简称“7·24火灾”). ...
... 大气环流异常对山林火灾发生及蔓延的影响在已有研究(田永丽和王秋华,2019;Luo et al., 2024; Luo et al., 2025)及本研究中均已表明,异常高压反气旋是引发山林火灾气象风险的主要因子.但受时间尺度、季节背景及山林火灾区域差异影响,异常高压反气旋的强度、位置及形成也存在显著差异. ...
... 在全球变暖背景下,干旱状况加剧,区域性高温干旱事件频发(Trenberth et al.,2015;林纾等,2022;李春华等,2024;颜鹏程等,2024;张强等,2025),全球易燃区域增加了29%,导致北半球暖季山林火灾事件频发,过火面积扩张(Senande-Rivera et al., 2022; Luo et al., 2024; Luo et al., 2025).作为地球系统变化不可或缺的一部分,山林火灾不仅对社会经济、能源部门、人类健康、生态系统和生物多样性构成了严重威胁,而且还会通过释放温室气体和气溶胶以及改变区域下垫面类型和植被条件,从而对气候系统变化产生影响(Mack et al., 2011;Turetsky et al., 2015;Bowring et al., 2022).例如,中高纬度地区的夏季山林火灾事件已成为全球火灾CO2排放的主要组成部分(Zheng et al., 2023).已有研究表明,暖季山林火灾的发生受天气和气候因素复杂相互作用的驱动.在具备可燃植被的前提下,引发火灾的主要气象条件与风险因子包括地表温度升高、水汽压亏损增加、大气对流不稳定增强、闪电活动频发以及大风天气等(Sedano and Randerson, 2014; Pinto et al., 2020; Jain et al., 2022).美国加利福尼亚州(简称“加州”)夏季常受副热带高压环流系统控制,主导下沉气流,炎热干燥,为山林火灾的发生提供了有利的气候背景(田永丽和王秋华,2019).近年来,受气温变暖、降水减少及极端天气气候事件的影响,加州山林火灾频发,且蔓延速度快、过火面积大、破坏性强(田永丽和王秋华,2019;刘洋鹏等,2025),其中,2024年夏季,发生在当地时间6月15日的洛杉矶山林火灾(简称“6·15火灾”)过火面积达80 km2以上,一度导致公路关闭.此外,受高温天气影响,7月24日加州山林火灾,过火面积达1 616 km2(简称“7·24火灾”). ...
中国干旱、半干旱区气候变化及影响研究百年进展
1
2025
... 在全球变暖背景下,干旱状况加剧,区域性高温干旱事件频发(Trenberth et al.,2015;林纾等,2022;李春华等,2024;颜鹏程等,2024;张强等,2025),全球易燃区域增加了29%,导致北半球暖季山林火灾事件频发,过火面积扩张(Senande-Rivera et al., 2022; Luo et al., 2024; Luo et al., 2025).作为地球系统变化不可或缺的一部分,山林火灾不仅对社会经济、能源部门、人类健康、生态系统和生物多样性构成了严重威胁,而且还会通过释放温室气体和气溶胶以及改变区域下垫面类型和植被条件,从而对气候系统变化产生影响(Mack et al., 2011;Turetsky et al., 2015;Bowring et al., 2022).例如,中高纬度地区的夏季山林火灾事件已成为全球火灾CO2排放的主要组成部分(Zheng et al., 2023).已有研究表明,暖季山林火灾的发生受天气和气候因素复杂相互作用的驱动.在具备可燃植被的前提下,引发火灾的主要气象条件与风险因子包括地表温度升高、水汽压亏损增加、大气对流不稳定增强、闪电活动频发以及大风天气等(Sedano and Randerson, 2014; Pinto et al., 2020; Jain et al., 2022).美国加利福尼亚州(简称“加州”)夏季常受副热带高压环流系统控制,主导下沉气流,炎热干燥,为山林火灾的发生提供了有利的气候背景(田永丽和王秋华,2019).近年来,受气温变暖、降水减少及极端天气气候事件的影响,加州山林火灾频发,且蔓延速度快、过火面积大、破坏性强(田永丽和王秋华,2019;刘洋鹏等,2025),其中,2024年夏季,发生在当地时间6月15日的洛杉矶山林火灾(简称“6·15火灾”)过火面积达80 km2以上,一度导致公路关闭.此外,受高温天气影响,7月24日加州山林火灾,过火面积达1 616 km2(简称“7·24火灾”). ...
基于SPI指数的1981—2010年内蒙古地区干旱时空分布特征
1
2013
... 此外,为分析研究区的干旱情况,本文采用标准化降水指数(Standardized Precipitation Index,SPI)来表征干旱状态,若该指数为负,则表明分析时段内干旱少雨.该方法适用于月以上尺度的干旱气候监测(周扬等,2013).本文还利用集合经验模态分解(Ensemble Empirical Mode Decomposition,EEMD)方法,对大气波动指数进行时间尺度分解(Wu and Huang, 2009; Ji et al., 2014). ...
Global emergence of anthropogenic climate change in fire weather indices
1
2019
... 利用1980—2024年夏季欧洲中期天气预报中心(European Center for Medium-Range Weather Forecasts,ECMWF)第五代全球再分析资料(ERA5)的逐日数据(Hersbach et al., 2020),水平分辨率为0.25°×0.25°.所用变量包括不同等压面上的位势高度、纬向风、经向风、垂直速度,以及降水、地表气温和露点温度.此外,利用欧洲森林火灾信息系统(European Forest Fire Information System)的2024年夏季逐日火灾天气指数资料.目前,该指数已在全球山林火灾发生的气象条件与风险评估分析中得到广泛应用(Abatzoglou et al., 2019; Vitolo et al., 2019; Grillakis et al., 2022; Luo et al., 2024). ...
Pyrogenic carbon decomposition critical to resolving fire’s role in the Earth system
1
2022
... 在全球变暖背景下,干旱状况加剧,区域性高温干旱事件频发(Trenberth et al.,2015;林纾等,2022;李春华等,2024;颜鹏程等,2024;张强等,2025),全球易燃区域增加了29%,导致北半球暖季山林火灾事件频发,过火面积扩张(Senande-Rivera et al., 2022; Luo et al., 2024; Luo et al., 2025).作为地球系统变化不可或缺的一部分,山林火灾不仅对社会经济、能源部门、人类健康、生态系统和生物多样性构成了严重威胁,而且还会通过释放温室气体和气溶胶以及改变区域下垫面类型和植被条件,从而对气候系统变化产生影响(Mack et al., 2011;Turetsky et al., 2015;Bowring et al., 2022).例如,中高纬度地区的夏季山林火灾事件已成为全球火灾CO2排放的主要组成部分(Zheng et al., 2023).已有研究表明,暖季山林火灾的发生受天气和气候因素复杂相互作用的驱动.在具备可燃植被的前提下,引发火灾的主要气象条件与风险因子包括地表温度升高、水汽压亏损增加、大气对流不稳定增强、闪电活动频发以及大风天气等(Sedano and Randerson, 2014; Pinto et al., 2020; Jain et al., 2022).美国加利福尼亚州(简称“加州”)夏季常受副热带高压环流系统控制,主导下沉气流,炎热干燥,为山林火灾的发生提供了有利的气候背景(田永丽和王秋华,2019).近年来,受气温变暖、降水减少及极端天气气候事件的影响,加州山林火灾频发,且蔓延速度快、过火面积大、破坏性强(田永丽和王秋华,2019;刘洋鹏等,2025),其中,2024年夏季,发生在当地时间6月15日的洛杉矶山林火灾(简称“6·15火灾”)过火面积达80 km2以上,一度导致公路关闭.此外,受高温天气影响,7月24日加州山林火灾,过火面积达1 616 km2(简称“7·24火灾”). ...
Multi-decadal change in western US nighttime vapor pressure deficit
1
2021
... 饱和水汽压与实际水气压差定义为水汽压亏损(Vapor Pressure Deficit,VPD),该物理量能够综合反映大气的温湿状态,其高值区与高压系统相对应,反映出局地大气高温低湿的状态,有利于山林火灾的爆发(Luo et al., 2025).因此,该物理量是常用的火灾风险指标,单位为hPa,具体数学表达式(Chiodi et al., 2021;Luo et al., 2025)如下: ...
Wave trains of 10-30-day meridional wind variations over the North Pacific during summer
3
2021
... 高温与干旱等极端天气气候事件作为山林火灾发生的主要原因,研究分析其所对应的大气环流异常特征是评估分析山林火灾爆发与蔓延的气象条件与风险的必要环节.大气运动的根本原因是其对太阳辐射强迫的日、年、年际、年代际及更长时间尺度变化的响应.在空间上,又可以表示为行星尺度、天气尺度和中小尺度涡旋系统的叠加.当这些系统的强度和位置明显偏离气候平均状态时,极易引发极端天气事件,因此,对极端天气事件的预报分析本质上是对天气系统异常状态的识别与预报分析.钱维宏基于上述物理框架,提出了天气尺度瞬变扰动的物理分解法(钱维宏,2012).该方法可将大气变量在时空域内物理分解成4个部分:前两项分别受季节演变的太阳辐射和海陆热力差异强迫,形成稳定的逐日气候态;第三项为年际和季节内尺度上,由热带热力强迫(如海温异常)或极地热力强迫(如极地放大增暖、海冰异常)引起的纬向平均瞬变扰动;第四项为较为复杂的天气尺度瞬变扰动项,受地形、热力强迫及大气内部变率的非线性过程影响.需要说明的是,对天气尺度瞬变扰动也可通过计算时间平均,分析其系统的稳定与持续性.目前,该方法在极端天气事件的预报分析中,已得到应用(钱维宏等,2012;钱维宏和张宗婕,2012).此外,大气遥相关的多尺度变化也是引发极端天气气候事件的一个重要因子.有研究(Du and Lu, 2021; Du and Lu, 2022)指出,夏季北太平洋上空存在一支季节内遥远相关波列,并通过斜压能转换从气候平均的基本气流中获得扰动能量得以发展和维持,向东传播到北美大陆,因此,该波列可作为北美大陆极端天气气候事件预测的先导信号. ...
... 为探究季节内尺度中纬度环流异常对加州山林火灾的影响,本文基于200 hPa天气尺度瞬变的经向风,利用大气长波指数(Wave Index,WI)公式,计算得到大气长波指数,具体公式如下(Du and Lu, 2021): ...
... 已有研究表明,夏季季节内尺度上,北太平洋上空的纬向波列通过斜压能转换,得以维持和发展,并向东传播,影响北美大陆的天气气候异常(Du and Lu, 2021; Du and Lu, 2022).图6为2024年6月和7月逐日200 hPa瞬变扰动经向风沿45.75°N的时间-经度剖面以及2024年夏季大气长波指数逐日变化、1980—2024年7月1—11日大气长波指数年际变化.可以看出,2024年6月,大气波动以瞬变过程为主,未出现季节内尺度的定常信号[图6(a)、(c)].2024年7月上旬,在170°W—160°W、150°W—140°W、120°W—110°W处,瞬变扰动经向风的位相基本不动,分别出现了持续的北风、南风和北风异常信号[图6(b)],结合大气长波指数的原始序列及其EEMD分解后的第三模态序列,发现EEMD分解后的序列呈现出显著的季节内变化特征[图6(c)],且与原始序列的相关系数为0.62,并通过置信水平为95%的显著性检验,且该时段大气波动处于稳定的负位相.此外,该时段平均大气波动指数的年际变化特征显示,2024年大气波动位于负位相最强处[图6(d)],进一步表明2024年7月上旬环流异常信号更为稳定,且扰动更为强烈. ...
Distinct intensity of 10-30-day intraseasonal waves over the North Pacific between early and late summers
2
2022
... 高温与干旱等极端天气气候事件作为山林火灾发生的主要原因,研究分析其所对应的大气环流异常特征是评估分析山林火灾爆发与蔓延的气象条件与风险的必要环节.大气运动的根本原因是其对太阳辐射强迫的日、年、年际、年代际及更长时间尺度变化的响应.在空间上,又可以表示为行星尺度、天气尺度和中小尺度涡旋系统的叠加.当这些系统的强度和位置明显偏离气候平均状态时,极易引发极端天气事件,因此,对极端天气事件的预报分析本质上是对天气系统异常状态的识别与预报分析.钱维宏基于上述物理框架,提出了天气尺度瞬变扰动的物理分解法(钱维宏,2012).该方法可将大气变量在时空域内物理分解成4个部分:前两项分别受季节演变的太阳辐射和海陆热力差异强迫,形成稳定的逐日气候态;第三项为年际和季节内尺度上,由热带热力强迫(如海温异常)或极地热力强迫(如极地放大增暖、海冰异常)引起的纬向平均瞬变扰动;第四项为较为复杂的天气尺度瞬变扰动项,受地形、热力强迫及大气内部变率的非线性过程影响.需要说明的是,对天气尺度瞬变扰动也可通过计算时间平均,分析其系统的稳定与持续性.目前,该方法在极端天气事件的预报分析中,已得到应用(钱维宏等,2012;钱维宏和张宗婕,2012).此外,大气遥相关的多尺度变化也是引发极端天气气候事件的一个重要因子.有研究(Du and Lu, 2021; Du and Lu, 2022)指出,夏季北太平洋上空存在一支季节内遥远相关波列,并通过斜压能转换从气候平均的基本气流中获得扰动能量得以发展和维持,向东传播到北美大陆,因此,该波列可作为北美大陆极端天气气候事件预测的先导信号. ...
... 已有研究表明,夏季季节内尺度上,北太平洋上空的纬向波列通过斜压能转换,得以维持和发展,并向东传播,影响北美大陆的天气气候异常(Du and Lu, 2021; Du and Lu, 2022).图6为2024年6月和7月逐日200 hPa瞬变扰动经向风沿45.75°N的时间-经度剖面以及2024年夏季大气长波指数逐日变化、1980—2024年7月1—11日大气长波指数年际变化.可以看出,2024年6月,大气波动以瞬变过程为主,未出现季节内尺度的定常信号[图6(a)、(c)].2024年7月上旬,在170°W—160°W、150°W—140°W、120°W—110°W处,瞬变扰动经向风的位相基本不动,分别出现了持续的北风、南风和北风异常信号[图6(b)],结合大气长波指数的原始序列及其EEMD分解后的第三模态序列,发现EEMD分解后的序列呈现出显著的季节内变化特征[图6(c)],且与原始序列的相关系数为0.62,并通过置信水平为95%的显著性检验,且该时段大气波动处于稳定的负位相.此外,该时段平均大气波动指数的年际变化特征显示,2024年大气波动位于负位相最强处[图6(d)],进一步表明2024年7月上旬环流异常信号更为稳定,且扰动更为强烈. ...
Climate drivers of global wildfire burned area
1
2022
... 利用1980—2024年夏季欧洲中期天气预报中心(European Center for Medium-Range Weather Forecasts,ECMWF)第五代全球再分析资料(ERA5)的逐日数据(Hersbach et al., 2020),水平分辨率为0.25°×0.25°.所用变量包括不同等压面上的位势高度、纬向风、经向风、垂直速度,以及降水、地表气温和露点温度.此外,利用欧洲森林火灾信息系统(European Forest Fire Information System)的2024年夏季逐日火灾天气指数资料.目前,该指数已在全球山林火灾发生的气象条件与风险评估分析中得到广泛应用(Abatzoglou et al., 2019; Vitolo et al., 2019; Grillakis et al., 2022; Luo et al., 2024). ...
The ERA5 global reanalysis
1
2020
... 利用1980—2024年夏季欧洲中期天气预报中心(European Center for Medium-Range Weather Forecasts,ECMWF)第五代全球再分析资料(ERA5)的逐日数据(Hersbach et al., 2020),水平分辨率为0.25°×0.25°.所用变量包括不同等压面上的位势高度、纬向风、经向风、垂直速度,以及降水、地表气温和露点温度.此外,利用欧洲森林火灾信息系统(European Forest Fire Information System)的2024年夏季逐日火灾天气指数资料.目前,该指数已在全球山林火灾发生的气象条件与风险评估分析中得到广泛应用(Abatzoglou et al., 2019; Vitolo et al., 2019; Grillakis et al., 2022; Luo et al., 2024). ...
Observed increases in extreme fire weather driven by atmospheric humidity and temperature
1
2022
... 在全球变暖背景下,干旱状况加剧,区域性高温干旱事件频发(Trenberth et al.,2015;林纾等,2022;李春华等,2024;颜鹏程等,2024;张强等,2025),全球易燃区域增加了29%,导致北半球暖季山林火灾事件频发,过火面积扩张(Senande-Rivera et al., 2022; Luo et al., 2024; Luo et al., 2025).作为地球系统变化不可或缺的一部分,山林火灾不仅对社会经济、能源部门、人类健康、生态系统和生物多样性构成了严重威胁,而且还会通过释放温室气体和气溶胶以及改变区域下垫面类型和植被条件,从而对气候系统变化产生影响(Mack et al., 2011;Turetsky et al., 2015;Bowring et al., 2022).例如,中高纬度地区的夏季山林火灾事件已成为全球火灾CO2排放的主要组成部分(Zheng et al., 2023).已有研究表明,暖季山林火灾的发生受天气和气候因素复杂相互作用的驱动.在具备可燃植被的前提下,引发火灾的主要气象条件与风险因子包括地表温度升高、水汽压亏损增加、大气对流不稳定增强、闪电活动频发以及大风天气等(Sedano and Randerson, 2014; Pinto et al., 2020; Jain et al., 2022).美国加利福尼亚州(简称“加州”)夏季常受副热带高压环流系统控制,主导下沉气流,炎热干燥,为山林火灾的发生提供了有利的气候背景(田永丽和王秋华,2019).近年来,受气温变暖、降水减少及极端天气气候事件的影响,加州山林火灾频发,且蔓延速度快、过火面积大、破坏性强(田永丽和王秋华,2019;刘洋鹏等,2025),其中,2024年夏季,发生在当地时间6月15日的洛杉矶山林火灾(简称“6·15火灾”)过火面积达80 km2以上,一度导致公路关闭.此外,受高温天气影响,7月24日加州山林火灾,过火面积达1 616 km2(简称“7·24火灾”). ...
Evolution of land surface air temperature trend
1
2014
... 此外,为分析研究区的干旱情况,本文采用标准化降水指数(Standardized Precipitation Index,SPI)来表征干旱状态,若该指数为负,则表明分析时段内干旱少雨.该方法适用于月以上尺度的干旱气候监测(周扬等,2013).本文还利用集合经验模态分解(Ensemble Empirical Mode Decomposition,EEMD)方法,对大气波动指数进行时间尺度分解(Wu and Huang, 2009; Ji et al., 2014). ...
Rapid summer Russian Arctic sea-ice loss enhances the risk of recent Eastern Siberian wildfires
4
2024
... 在全球变暖背景下,干旱状况加剧,区域性高温干旱事件频发(Trenberth et al.,2015;林纾等,2022;李春华等,2024;颜鹏程等,2024;张强等,2025),全球易燃区域增加了29%,导致北半球暖季山林火灾事件频发,过火面积扩张(Senande-Rivera et al., 2022; Luo et al., 2024; Luo et al., 2025).作为地球系统变化不可或缺的一部分,山林火灾不仅对社会经济、能源部门、人类健康、生态系统和生物多样性构成了严重威胁,而且还会通过释放温室气体和气溶胶以及改变区域下垫面类型和植被条件,从而对气候系统变化产生影响(Mack et al., 2011;Turetsky et al., 2015;Bowring et al., 2022).例如,中高纬度地区的夏季山林火灾事件已成为全球火灾CO2排放的主要组成部分(Zheng et al., 2023).已有研究表明,暖季山林火灾的发生受天气和气候因素复杂相互作用的驱动.在具备可燃植被的前提下,引发火灾的主要气象条件与风险因子包括地表温度升高、水汽压亏损增加、大气对流不稳定增强、闪电活动频发以及大风天气等(Sedano and Randerson, 2014; Pinto et al., 2020; Jain et al., 2022).美国加利福尼亚州(简称“加州”)夏季常受副热带高压环流系统控制,主导下沉气流,炎热干燥,为山林火灾的发生提供了有利的气候背景(田永丽和王秋华,2019).近年来,受气温变暖、降水减少及极端天气气候事件的影响,加州山林火灾频发,且蔓延速度快、过火面积大、破坏性强(田永丽和王秋华,2019;刘洋鹏等,2025),其中,2024年夏季,发生在当地时间6月15日的洛杉矶山林火灾(简称“6·15火灾”)过火面积达80 km2以上,一度导致公路关闭.此外,受高温天气影响,7月24日加州山林火灾,过火面积达1 616 km2(简称“7·24火灾”). ...
... 利用1980—2024年夏季欧洲中期天气预报中心(European Center for Medium-Range Weather Forecasts,ECMWF)第五代全球再分析资料(ERA5)的逐日数据(Hersbach et al., 2020),水平分辨率为0.25°×0.25°.所用变量包括不同等压面上的位势高度、纬向风、经向风、垂直速度,以及降水、地表气温和露点温度.此外,利用欧洲森林火灾信息系统(European Forest Fire Information System)的2024年夏季逐日火灾天气指数资料.目前,该指数已在全球山林火灾发生的气象条件与风险评估分析中得到广泛应用(Abatzoglou et al., 2019; Vitolo et al., 2019; Grillakis et al., 2022; Luo et al., 2024). ...
... 全球火灾预报模式以温度、降水、风速和相对湿度为输入数据,结合燃料可用性与植被特征,通过计算细小燃料、腐质层的湿度及干旱状态,得到初始蔓延指数、中间指数和可燃物积累指数.综合3类指数后形成火灾天气指数,该指数综合考虑气温、相对湿度、风速、降水、干旱程度等气象要素的变化,为无量纲量,其核心表征火灾的蔓延速度和燃烧量,数值越大,火灾强度越强(Vitolo et al., 2019;Luo et al., 2024). ...
... 大气环流异常对山林火灾发生及蔓延的影响在已有研究(田永丽和王秋华,2019;Luo et al., 2024; Luo et al., 2025)及本研究中均已表明,异常高压反气旋是引发山林火灾气象风险的主要因子.但受时间尺度、季节背景及山林火灾区域差异影响,异常高压反气旋的强度、位置及形成也存在显著差异. ...
Atmospheric and oceanic drivers behind the 2023 Canadian wildfires
4
2025
... 在全球变暖背景下,干旱状况加剧,区域性高温干旱事件频发(Trenberth et al.,2015;林纾等,2022;李春华等,2024;颜鹏程等,2024;张强等,2025),全球易燃区域增加了29%,导致北半球暖季山林火灾事件频发,过火面积扩张(Senande-Rivera et al., 2022; Luo et al., 2024; Luo et al., 2025).作为地球系统变化不可或缺的一部分,山林火灾不仅对社会经济、能源部门、人类健康、生态系统和生物多样性构成了严重威胁,而且还会通过释放温室气体和气溶胶以及改变区域下垫面类型和植被条件,从而对气候系统变化产生影响(Mack et al., 2011;Turetsky et al., 2015;Bowring et al., 2022).例如,中高纬度地区的夏季山林火灾事件已成为全球火灾CO2排放的主要组成部分(Zheng et al., 2023).已有研究表明,暖季山林火灾的发生受天气和气候因素复杂相互作用的驱动.在具备可燃植被的前提下,引发火灾的主要气象条件与风险因子包括地表温度升高、水汽压亏损增加、大气对流不稳定增强、闪电活动频发以及大风天气等(Sedano and Randerson, 2014; Pinto et al., 2020; Jain et al., 2022).美国加利福尼亚州(简称“加州”)夏季常受副热带高压环流系统控制,主导下沉气流,炎热干燥,为山林火灾的发生提供了有利的气候背景(田永丽和王秋华,2019).近年来,受气温变暖、降水减少及极端天气气候事件的影响,加州山林火灾频发,且蔓延速度快、过火面积大、破坏性强(田永丽和王秋华,2019;刘洋鹏等,2025),其中,2024年夏季,发生在当地时间6月15日的洛杉矶山林火灾(简称“6·15火灾”)过火面积达80 km2以上,一度导致公路关闭.此外,受高温天气影响,7月24日加州山林火灾,过火面积达1 616 km2(简称“7·24火灾”). ...
... 饱和水汽压与实际水气压差定义为水汽压亏损(Vapor Pressure Deficit,VPD),该物理量能够综合反映大气的温湿状态,其高值区与高压系统相对应,反映出局地大气高温低湿的状态,有利于山林火灾的爆发(Luo et al., 2025).因此,该物理量是常用的火灾风险指标,单位为hPa,具体数学表达式(Chiodi et al., 2021;Luo et al., 2025)如下: ...
... ;Luo et al., 2025)如下: ...
... 大气环流异常对山林火灾发生及蔓延的影响在已有研究(田永丽和王秋华,2019;Luo et al., 2024; Luo et al., 2025)及本研究中均已表明,异常高压反气旋是引发山林火灾气象风险的主要因子.但受时间尺度、季节背景及山林火灾区域差异影响,异常高压反气旋的强度、位置及形成也存在显著差异. ...
Carbon loss from an unprecedented Arctic tundra wildfire
1
2011
... 在全球变暖背景下,干旱状况加剧,区域性高温干旱事件频发(Trenberth et al.,2015;林纾等,2022;李春华等,2024;颜鹏程等,2024;张强等,2025),全球易燃区域增加了29%,导致北半球暖季山林火灾事件频发,过火面积扩张(Senande-Rivera et al., 2022; Luo et al., 2024; Luo et al., 2025).作为地球系统变化不可或缺的一部分,山林火灾不仅对社会经济、能源部门、人类健康、生态系统和生物多样性构成了严重威胁,而且还会通过释放温室气体和气溶胶以及改变区域下垫面类型和植被条件,从而对气候系统变化产生影响(Mack et al., 2011;Turetsky et al., 2015;Bowring et al., 2022).例如,中高纬度地区的夏季山林火灾事件已成为全球火灾CO2排放的主要组成部分(Zheng et al., 2023).已有研究表明,暖季山林火灾的发生受天气和气候因素复杂相互作用的驱动.在具备可燃植被的前提下,引发火灾的主要气象条件与风险因子包括地表温度升高、水汽压亏损增加、大气对流不稳定增强、闪电活动频发以及大风天气等(Sedano and Randerson, 2014; Pinto et al., 2020; Jain et al., 2022).美国加利福尼亚州(简称“加州”)夏季常受副热带高压环流系统控制,主导下沉气流,炎热干燥,为山林火灾的发生提供了有利的气候背景(田永丽和王秋华,2019).近年来,受气温变暖、降水减少及极端天气气候事件的影响,加州山林火灾频发,且蔓延速度快、过火面积大、破坏性强(田永丽和王秋华,2019;刘洋鹏等,2025),其中,2024年夏季,发生在当地时间6月15日的洛杉矶山林火灾(简称“6·15火灾”)过火面积达80 km2以上,一度导致公路关闭.此外,受高温天气影响,7月24日加州山林火灾,过火面积达1 616 km2(简称“7·24火灾”). ...
Enhancing the fire weather index with atmospheric instability information
1
2020
... 在全球变暖背景下,干旱状况加剧,区域性高温干旱事件频发(Trenberth et al.,2015;林纾等,2022;李春华等,2024;颜鹏程等,2024;张强等,2025),全球易燃区域增加了29%,导致北半球暖季山林火灾事件频发,过火面积扩张(Senande-Rivera et al., 2022; Luo et al., 2024; Luo et al., 2025).作为地球系统变化不可或缺的一部分,山林火灾不仅对社会经济、能源部门、人类健康、生态系统和生物多样性构成了严重威胁,而且还会通过释放温室气体和气溶胶以及改变区域下垫面类型和植被条件,从而对气候系统变化产生影响(Mack et al., 2011;Turetsky et al., 2015;Bowring et al., 2022).例如,中高纬度地区的夏季山林火灾事件已成为全球火灾CO2排放的主要组成部分(Zheng et al., 2023).已有研究表明,暖季山林火灾的发生受天气和气候因素复杂相互作用的驱动.在具备可燃植被的前提下,引发火灾的主要气象条件与风险因子包括地表温度升高、水汽压亏损增加、大气对流不稳定增强、闪电活动频发以及大风天气等(Sedano and Randerson, 2014; Pinto et al., 2020; Jain et al., 2022).美国加利福尼亚州(简称“加州”)夏季常受副热带高压环流系统控制,主导下沉气流,炎热干燥,为山林火灾的发生提供了有利的气候背景(田永丽和王秋华,2019).近年来,受气温变暖、降水减少及极端天气气候事件的影响,加州山林火灾频发,且蔓延速度快、过火面积大、破坏性强(田永丽和王秋华,2019;刘洋鹏等,2025),其中,2024年夏季,发生在当地时间6月15日的洛杉矶山林火灾(简称“6·15火灾”)过火面积达80 km2以上,一度导致公路关闭.此外,受高温天气影响,7月24日加州山林火灾,过火面积达1 616 km2(简称“7·24火灾”). ...
Multi-scale influence of vapor pressure deficit on fire ignition and spread in boreal forest ecosystems
1
2014
... 在全球变暖背景下,干旱状况加剧,区域性高温干旱事件频发(Trenberth et al.,2015;林纾等,2022;李春华等,2024;颜鹏程等,2024;张强等,2025),全球易燃区域增加了29%,导致北半球暖季山林火灾事件频发,过火面积扩张(Senande-Rivera et al., 2022; Luo et al., 2024; Luo et al., 2025).作为地球系统变化不可或缺的一部分,山林火灾不仅对社会经济、能源部门、人类健康、生态系统和生物多样性构成了严重威胁,而且还会通过释放温室气体和气溶胶以及改变区域下垫面类型和植被条件,从而对气候系统变化产生影响(Mack et al., 2011;Turetsky et al., 2015;Bowring et al., 2022).例如,中高纬度地区的夏季山林火灾事件已成为全球火灾CO2排放的主要组成部分(Zheng et al., 2023).已有研究表明,暖季山林火灾的发生受天气和气候因素复杂相互作用的驱动.在具备可燃植被的前提下,引发火灾的主要气象条件与风险因子包括地表温度升高、水汽压亏损增加、大气对流不稳定增强、闪电活动频发以及大风天气等(Sedano and Randerson, 2014; Pinto et al., 2020; Jain et al., 2022).美国加利福尼亚州(简称“加州”)夏季常受副热带高压环流系统控制,主导下沉气流,炎热干燥,为山林火灾的发生提供了有利的气候背景(田永丽和王秋华,2019).近年来,受气温变暖、降水减少及极端天气气候事件的影响,加州山林火灾频发,且蔓延速度快、过火面积大、破坏性强(田永丽和王秋华,2019;刘洋鹏等,2025),其中,2024年夏季,发生在当地时间6月15日的洛杉矶山林火灾(简称“6·15火灾”)过火面积达80 km2以上,一度导致公路关闭.此外,受高温天气影响,7月24日加州山林火灾,过火面积达1 616 km2(简称“7·24火灾”). ...
Spatial and temporal expansion of global wildland fire activity in response to climate change
1
2022
... 在全球变暖背景下,干旱状况加剧,区域性高温干旱事件频发(Trenberth et al.,2015;林纾等,2022;李春华等,2024;颜鹏程等,2024;张强等,2025),全球易燃区域增加了29%,导致北半球暖季山林火灾事件频发,过火面积扩张(Senande-Rivera et al., 2022; Luo et al., 2024; Luo et al., 2025).作为地球系统变化不可或缺的一部分,山林火灾不仅对社会经济、能源部门、人类健康、生态系统和生物多样性构成了严重威胁,而且还会通过释放温室气体和气溶胶以及改变区域下垫面类型和植被条件,从而对气候系统变化产生影响(Mack et al., 2011;Turetsky et al., 2015;Bowring et al., 2022).例如,中高纬度地区的夏季山林火灾事件已成为全球火灾CO2排放的主要组成部分(Zheng et al., 2023).已有研究表明,暖季山林火灾的发生受天气和气候因素复杂相互作用的驱动.在具备可燃植被的前提下,引发火灾的主要气象条件与风险因子包括地表温度升高、水汽压亏损增加、大气对流不稳定增强、闪电活动频发以及大风天气等(Sedano and Randerson, 2014; Pinto et al., 2020; Jain et al., 2022).美国加利福尼亚州(简称“加州”)夏季常受副热带高压环流系统控制,主导下沉气流,炎热干燥,为山林火灾的发生提供了有利的气候背景(田永丽和王秋华,2019).近年来,受气温变暖、降水减少及极端天气气候事件的影响,加州山林火灾频发,且蔓延速度快、过火面积大、破坏性强(田永丽和王秋华,2019;刘洋鹏等,2025),其中,2024年夏季,发生在当地时间6月15日的洛杉矶山林火灾(简称“6·15火灾”)过火面积达80 km2以上,一度导致公路关闭.此外,受高温天气影响,7月24日加州山林火灾,过火面积达1 616 km2(简称“7·24火灾”). ...
A formulation of a phase-independent wave-activity flux for stationary and migratory quasigeostrophic eddies on a zonally varying basic flow
1
2001
... 由于T-N波活动通量(Wave Activity Flux,WAF)与大气长波能量频散的方向一致,因此可以用来表征大气长波能量传播特征(Takaya and Nakamura,2001),其水平方向分量的数学表达式如下: ...
Attribution of climate extreme events
1
2015
... 在全球变暖背景下,干旱状况加剧,区域性高温干旱事件频发(Trenberth et al.,2015;林纾等,2022;李春华等,2024;颜鹏程等,2024;张强等,2025),全球易燃区域增加了29%,导致北半球暖季山林火灾事件频发,过火面积扩张(Senande-Rivera et al., 2022; Luo et al., 2024; Luo et al., 2025).作为地球系统变化不可或缺的一部分,山林火灾不仅对社会经济、能源部门、人类健康、生态系统和生物多样性构成了严重威胁,而且还会通过释放温室气体和气溶胶以及改变区域下垫面类型和植被条件,从而对气候系统变化产生影响(Mack et al., 2011;Turetsky et al., 2015;Bowring et al., 2022).例如,中高纬度地区的夏季山林火灾事件已成为全球火灾CO2排放的主要组成部分(Zheng et al., 2023).已有研究表明,暖季山林火灾的发生受天气和气候因素复杂相互作用的驱动.在具备可燃植被的前提下,引发火灾的主要气象条件与风险因子包括地表温度升高、水汽压亏损增加、大气对流不稳定增强、闪电活动频发以及大风天气等(Sedano and Randerson, 2014; Pinto et al., 2020; Jain et al., 2022).美国加利福尼亚州(简称“加州”)夏季常受副热带高压环流系统控制,主导下沉气流,炎热干燥,为山林火灾的发生提供了有利的气候背景(田永丽和王秋华,2019).近年来,受气温变暖、降水减少及极端天气气候事件的影响,加州山林火灾频发,且蔓延速度快、过火面积大、破坏性强(田永丽和王秋华,2019;刘洋鹏等,2025),其中,2024年夏季,发生在当地时间6月15日的洛杉矶山林火灾(简称“6·15火灾”)过火面积达80 km2以上,一度导致公路关闭.此外,受高温天气影响,7月24日加州山林火灾,过火面积达1 616 km2(简称“7·24火灾”). ...
Global vulnerability of peatlands to fire and carbon loss
1
2015
... 在全球变暖背景下,干旱状况加剧,区域性高温干旱事件频发(Trenberth et al.,2015;林纾等,2022;李春华等,2024;颜鹏程等,2024;张强等,2025),全球易燃区域增加了29%,导致北半球暖季山林火灾事件频发,过火面积扩张(Senande-Rivera et al., 2022; Luo et al., 2024; Luo et al., 2025).作为地球系统变化不可或缺的一部分,山林火灾不仅对社会经济、能源部门、人类健康、生态系统和生物多样性构成了严重威胁,而且还会通过释放温室气体和气溶胶以及改变区域下垫面类型和植被条件,从而对气候系统变化产生影响(Mack et al., 2011;Turetsky et al., 2015;Bowring et al., 2022).例如,中高纬度地区的夏季山林火灾事件已成为全球火灾CO2排放的主要组成部分(Zheng et al., 2023).已有研究表明,暖季山林火灾的发生受天气和气候因素复杂相互作用的驱动.在具备可燃植被的前提下,引发火灾的主要气象条件与风险因子包括地表温度升高、水汽压亏损增加、大气对流不稳定增强、闪电活动频发以及大风天气等(Sedano and Randerson, 2014; Pinto et al., 2020; Jain et al., 2022).美国加利福尼亚州(简称“加州”)夏季常受副热带高压环流系统控制,主导下沉气流,炎热干燥,为山林火灾的发生提供了有利的气候背景(田永丽和王秋华,2019).近年来,受气温变暖、降水减少及极端天气气候事件的影响,加州山林火灾频发,且蔓延速度快、过火面积大、破坏性强(田永丽和王秋华,2019;刘洋鹏等,2025),其中,2024年夏季,发生在当地时间6月15日的洛杉矶山林火灾(简称“6·15火灾”)过火面积达80 km2以上,一度导致公路关闭.此外,受高温天气影响,7月24日加州山林火灾,过火面积达1 616 km2(简称“7·24火灾”). ...
A 1980-2018 global fire danger re-analysis dataset for the Canadian Fire Weather Indices
2
2019
... 利用1980—2024年夏季欧洲中期天气预报中心(European Center for Medium-Range Weather Forecasts,ECMWF)第五代全球再分析资料(ERA5)的逐日数据(Hersbach et al., 2020),水平分辨率为0.25°×0.25°.所用变量包括不同等压面上的位势高度、纬向风、经向风、垂直速度,以及降水、地表气温和露点温度.此外,利用欧洲森林火灾信息系统(European Forest Fire Information System)的2024年夏季逐日火灾天气指数资料.目前,该指数已在全球山林火灾发生的气象条件与风险评估分析中得到广泛应用(Abatzoglou et al., 2019; Vitolo et al., 2019; Grillakis et al., 2022; Luo et al., 2024). ...
... 全球火灾预报模式以温度、降水、风速和相对湿度为输入数据,结合燃料可用性与植被特征,通过计算细小燃料、腐质层的湿度及干旱状态,得到初始蔓延指数、中间指数和可燃物积累指数.综合3类指数后形成火灾天气指数,该指数综合考虑气温、相对湿度、风速、降水、干旱程度等气象要素的变化,为无量纲量,其核心表征火灾的蔓延速度和燃烧量,数值越大,火灾强度越强(Vitolo et al., 2019;Luo et al., 2024). ...
Ensemble empirical mode decomposition:A noise-assisted data analysis method
1
2009
... 此外,为分析研究区的干旱情况,本文采用标准化降水指数(Standardized Precipitation Index,SPI)来表征干旱状态,若该指数为负,则表明分析时段内干旱少雨.该方法适用于月以上尺度的干旱气候监测(周扬等,2013).本文还利用集合经验模态分解(Ensemble Empirical Mode Decomposition,EEMD)方法,对大气波动指数进行时间尺度分解(Wu and Huang, 2009; Ji et al., 2014). ...
Record-high CO2 emissions from boreal fires in 2021
1
2023
... 在全球变暖背景下,干旱状况加剧,区域性高温干旱事件频发(Trenberth et al.,2015;林纾等,2022;李春华等,2024;颜鹏程等,2024;张强等,2025),全球易燃区域增加了29%,导致北半球暖季山林火灾事件频发,过火面积扩张(Senande-Rivera et al., 2022; Luo et al., 2024; Luo et al., 2025).作为地球系统变化不可或缺的一部分,山林火灾不仅对社会经济、能源部门、人类健康、生态系统和生物多样性构成了严重威胁,而且还会通过释放温室气体和气溶胶以及改变区域下垫面类型和植被条件,从而对气候系统变化产生影响(Mack et al., 2011;Turetsky et al., 2015;Bowring et al., 2022).例如,中高纬度地区的夏季山林火灾事件已成为全球火灾CO2排放的主要组成部分(Zheng et al., 2023).已有研究表明,暖季山林火灾的发生受天气和气候因素复杂相互作用的驱动.在具备可燃植被的前提下,引发火灾的主要气象条件与风险因子包括地表温度升高、水汽压亏损增加、大气对流不稳定增强、闪电活动频发以及大风天气等(Sedano and Randerson, 2014; Pinto et al., 2020; Jain et al., 2022).美国加利福尼亚州(简称“加州”)夏季常受副热带高压环流系统控制,主导下沉气流,炎热干燥,为山林火灾的发生提供了有利的气候背景(田永丽和王秋华,2019).近年来,受气温变暖、降水减少及极端天气气候事件的影响,加州山林火灾频发,且蔓延速度快、过火面积大、破坏性强(田永丽和王秋华,2019;刘洋鹏等,2025),其中,2024年夏季,发生在当地时间6月15日的洛杉矶山林火灾(简称“6·15火灾”)过火面积达80 km2以上,一度导致公路关闭.此外,受高温天气影响,7月24日加州山林火灾,过火面积达1 616 km2(简称“7·24火灾”). ...


