

0 引言
近年来,空气污染已成为严重威胁生态系统和人体健康的环境问题(Huang et al., 2018;Apte et al., 2018; Agathokleous et al.,2020)。污染物的主要来源虽为人类活动排放,但其时空分布特征明显受气象条件与地形因素的调控(Gong et al.,2022;Yoo et al.,2024;赵天良等,2024)。研究表明,气象条件对重污染事件的贡献率可达30%~50%(Zhang et al.,2018;Ma et al.,2020),其中气温、风速、相对湿度及边界层高度等关键参数通过影响污染物的传输、累积、扩散及二次化学反应过程,共同决定了区域污染特征(Chen et al.,2018;吉莉和刘晓冉,2023)。由于沙尘天气影响,我国西北干旱半干旱地区春季和冬季颗粒物污染显著增加(Rupakheti et al.,2021);数值模拟结果表明,沙尘暴发生时,处于西北地区的兰州可吸入颗粒物中的尘埃比例迅速增加,3月PM10和PM2.5中的平均尘粒比例分别能达到68%和40%(Guan et al.,2018)。
研究发现,高压系统主导的天气型通常伴随弱风速和低降水特征,有利于近地面污染物的局地累积(Bei et al.,2020;Jun and Gu,2023)。国外学者揭示了高压系统下强逆温层和稳定边界层下PM2.5和PM10浓度升高的驱动机制(Chambers and Podstawczyńska,2019),以及美国南加州持续性高压系统引发的热浪事件显著加剧O3污染(Wu et al.,2023)。东亚地区盛行的西风带中低层强风可促使污染物跨区域传输(Mo et al.,2021;Hu et al.,2021),高海拔地区低槽使得低压系统发展,通过增强风力加速了污染物的迁移(Yoo et al.,2022)。针对我国典型区域的研究进一步表明,华北地区偏南风主导环流形势导致污染物南北输送(Li et al.,2020),而西南地区弱低压系统诱发的局地气旋则使污染物在四川盆地东南部汇聚(Liu et al.,2021)。在对大气环流系统(像锋面、气旋等)的识别中,卷积神经网络等深度学习方法展示出了较高的精度(马敏劲等,2024),且机器学习方法在污染物研究方面有明显优势,如Gao等(2024)基于多种机器学习方法,利用前体物排放、气象要素和气候指数数据对污染物超标天数进行预测,得到了最优预测模型。
本文基于2016—2022年700 hPa位势高度场和风场数据,应用SOM方法进行天气分型,探究气象要素-天气系统-污染物浓度的多尺度耦合机制,以期为研究甘肃地区大气污染成因及其防治提供理论支撑。
1 资料与方法
1.1 研究区域
甘肃位于我国西北内陆,作为国家西部生态安全屏障、“一带一路”战略通道和能源基地,其地理格局呈西北—东南走向,地势自西南向东北倾斜,气候类型多样,加上受高原的影响,该区域大气扩散条件呈现明显的区域和季节差异,整体上冬季冷空气频繁南下,层结稳定,可诱发污染物积聚;夏季东南季风增强促进污染物湿沉降;而位于干旱半干旱区的河西走廊,多风沙天气,强风作用下的污染物远距离输送对周边和下游地区环境产生跨区域影响。
1.2 研究资料
采用欧洲中期天气预报中心(European Centre for Medium-Range Weather Forecasts,ECMWF)提供的第五代大气再分析数据集(ERA5),获取2016年1月1日至2022年12月31日逐小时1 000 hPa至500 hPa的位势高度、温度、u风、v风、垂直速度,以及边界层高度数据,空间分辨率为1°×1°,垂直方向包含1 000、975、950、925、900、875、850、825、800、775、750、700、650、600、550、500 hPa共16个气压层。污染物质量浓度数据源自中国国家环境监测总站,包括甘肃省14个城市的PM10、PM2.5、O3(8 h滑动平均)、SO2、NO2和CO 6类污染物质量浓度逐日观测值;气象要素观测数据由兰州区域气候中心提供。各城市污染物质量浓度及气象要素值由城市内所有监测站点的空间平均计算获得。
1.3 研究方法
1.3.1 空气质量指数
式中:i为空气质量指数级别;IAQIP为某污染物的空气质量分指数;CP为某污染物的质量浓度,BPP,i、BPP,i-1分别为与CP相近的污染物质量浓度限值的高位值和低位值,单位:μg·m-3;IAQIP,i-1、IAQIP,i分别为BPP,i-1、BPP,i对应的空气质量分指数。根据上述公式可以计算得到每一种污染物每日的IAQI。通过筛选每日IAQIP最大值,便可得到当日AQI并确定首要污染物:
1.3.2 自组织映射神经网络(SOM)
采用SOM方法对位势高度场和水平风场进行客观分型。SOM是一种无监督机器学习方法,能够将多维数据非线性映射到有组织的拓扑二维数组上,进而能对输入数据进行学习聚类。当神经网络接受输入数据时,会分成不同区域进行响应,各区域按照不同的响应特征进行竞争学习,输入数据会在竞争层中遍历每一个节点,并计算与其相似度最大的节点,称为优胜节点,然后便更新优胜节点及其邻域的参数,最后通过不断更新迭代实现收敛,达到聚类目的。SOM的优势在于无需预设聚类数目,且能通过降维可视化呈现复杂环流模式的本质特征。
甘肃地处黄土高原、内蒙古高原和青藏高原的交汇地带,海拔大部分在1 km以上,涵盖山地、高原、平原、河谷、沙漠、戈壁多种地貌,故选择700 hPa高度层进行分型,该高度层既能反映自由对流层动力过程,又可规避近地面局地干扰,相较我国东部平原地区常用的海平面气压场或850 hPa低层,更适用于高原—盆地过渡带的气象特征解析(Li et al.,2019;Hu et al.,2025)。选08:00(北京时,下同)700 hPa高度场进行分析,区域范围:30°N—50°N,84°E—116°E,该时段人为排放活动活跃、卫星辐射数据覆盖完整,可提高再分析数据的可靠性(Cheng et al.,2024)。
2 结果分析
2.1 甘肃14市主要污染物占比
甘肃各城市PM10、O3和PM2.5作为首要污染物的累计占比较大,计算得出累计占比之和均大于88%,明显高于其他污染物。PM10全省平均占比达39.9%,O3达47.9%,明显高于PM2.5的8.8%。空间上从图1可看出,兰州、天水、张掖、定西、陇南、临夏、甘南和庆阳8个城市的O3占比高于PM10,其余6市则反之。此外,兰州、平凉的NO2,白银的SO2占比相对较大;在各城市中,CO作为首要污染物的占比最低。因此,考虑全省主要污染物占比情况,选取PM10、PM2.5和O3作为主要污染物来分析。
图1
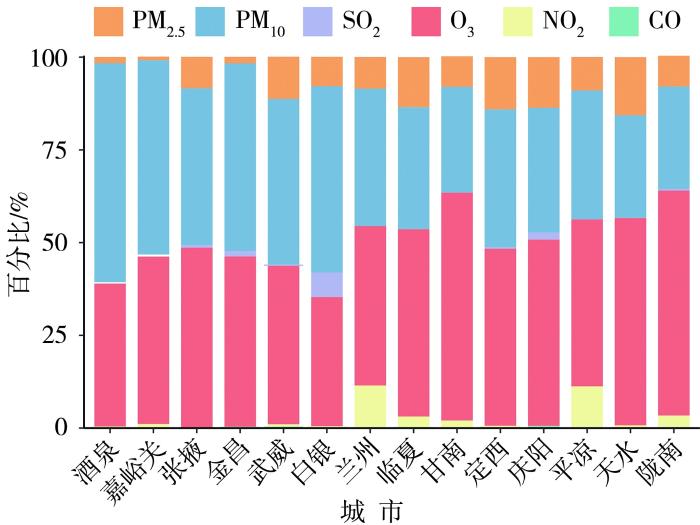
图1
2016—2022年甘肃省14市主要污染物占比
Fig.1
Proportion of primary pollutants in 14 cities of Gansu Province from 2016 to 2022
2.2 气象要素与污染物关系
选取位于干旱半干旱区的兰州和庆阳、干旱区的酒泉、湿润区的陇南进行分析。图2为兰州气温、风速和相对湿度与PM10、PM2.5和O3 3种主要污染物的关系,可以看出:PM10和PM2.5随气温升高质量浓度下降;O3质量浓度随气温上升非线性增加;颗粒物在低风速(<1 m·s-1)和高风速(>3 m·s-1)时其质量浓度较高,低风速时污染物因扩散受限而累积,强风则有利于污染物从沙尘源区向下风向传输,而且PM10强风时相较于PM2.5质量浓度上升更快;O3质量浓度随风速升高单调上升;3种污染物的质量浓度均随着相对湿度增加呈现先上升后下降趋势。酒泉(图3),PM10质量浓度随气温升高呈现先上升后下降趋势,低温下其质量浓度较低可能与冷空气活动强烈时,强西北风使得污染物向东南方向扩散有关(张莹,2016);PM2.5和O3质量浓度与气温分别呈负相关和正相关;在风速低于2 m·s-1、高于4 m·s-1时颗粒物质量浓度较高,O3质量浓度则在2~4 m·s-1风速时较高;PM2.5质量浓度随相对湿度增加而增加,PM10和O3质量浓度则呈现单调下降趋势。在酒泉,由于气候干旱,植被覆盖少,低湿度条件下易发生起沙过程,会导致PM10质量浓度升高(张宸赫等,2020),同时相对湿度低时,通常光照和温度条件好,O3更易积累。庆阳(图4)和陇南(图5)3种污染物与气温和相对湿度的关系与兰州一致,庆阳颗粒物质量浓度与风速的关系与酒泉一致,陇南在风速小于1 m·s-1、大于3 m·s-1时PM10质量浓度有微弱升高,PM2.5随风速增加其质量浓度下降,O3质量浓度则呈现单调上升趋势。可见,PM10和PM2.5质量浓度与气温整体呈负相关,主要原因是冬季低气温抑制了边界层湍流,颗粒物扩散较为困难(Zhou et al.,2019),而O3质量浓度随着气温上升呈非线性上升趋势,因其生成依赖于光化学反应,高温期间紫外辐射强,使得O3质量浓度明显升高(张宸赫等,2020)。另外,1~4 m·s-1的风速条件能促进前体物混合,有利于O3生成(赵熠琳等,2024),其中兰州和陇南最大风速不超过4 m·s-1,所以O3质量浓度随风速升高而单调上升。兰州、庆阳、陇南的3种污染物在25%~75%相对湿度时其质量浓度更高,主要因为水汽增加时,能够增加大气中颗粒物的依附性,使污染物的吸湿增长能力加强,从而导致其质量浓度增加(王翠连等,2019);而当相对湿度增加到一定范围形成降水时,会对PM10和PM2.5产生冲刷沉降作用,使其质量浓度下降(张淑平等,2016),且大气中的水汽增加会削弱太阳辐射,进而影响光化学反应(李顺姬等,2018),水汽含量的增加也会使氢氧自由基与O3反应而消耗O3(陈锦超,2017)。
图2
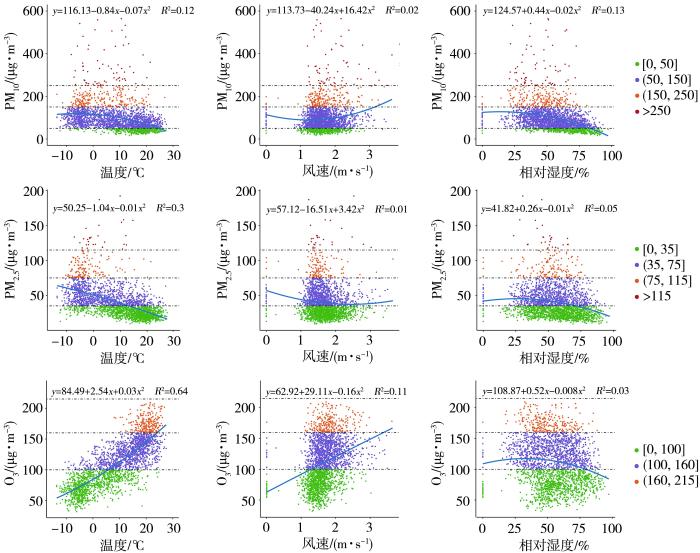
图2
兰州气象要素与PM10、PM2.5和O3 质量浓度的拟合关系(圆圈颜色代表PM10、PM2.5和O3在不同IAQI等级下的质量浓度范围,下同)
Fig.2
The fitting relationship between meteorological elements in Lanzhou and the mass concentrations of PM10, PM2.5 and O3 (The circle colors represent the mass concentration ranges of PM10, PM2.5 and O3 at different IAQI levels,the same as below)
图3
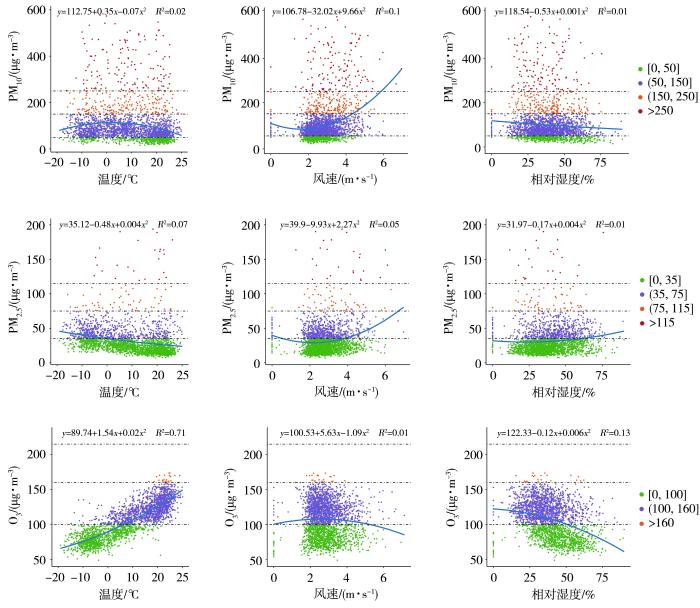
图3
酒泉气象要素与PM10、PM2.5和O3质量浓度的拟合关系
Fig.3
The fitting relationship between meteorological elements in Jiuquan and the mass concentrations of PM10, PM2.5 and O3
图4
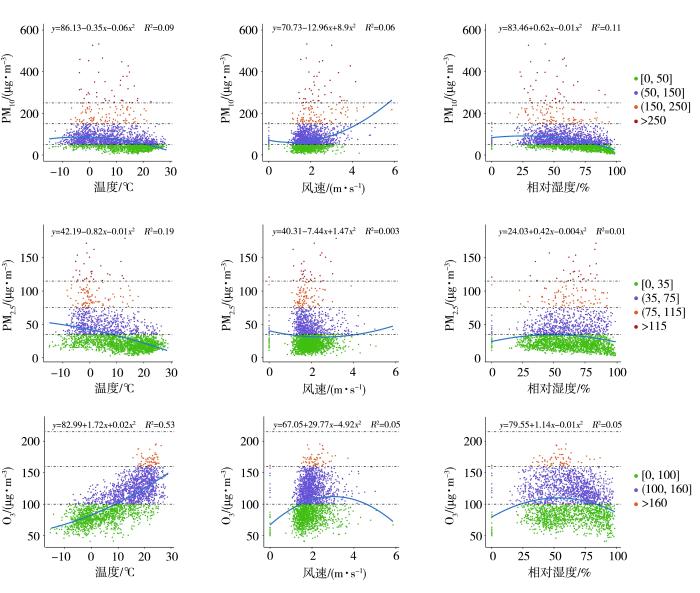
图4
庆阳气象要素与PM10、PM2.5和O3质量浓度的拟合关系
Fig.4
The fitting relationship between meteorological elements in Qingyang and the mass concentrations of PM10, PM2.5 and O3
图5
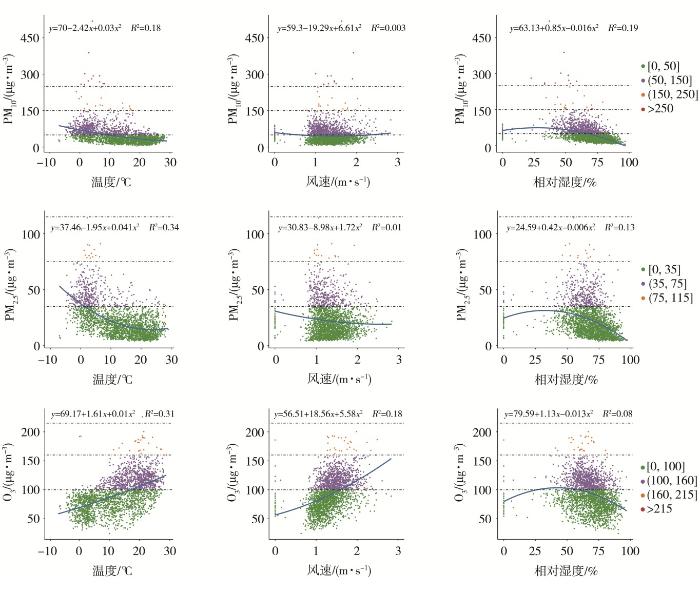
图5
陇南气象要素与PM10、PM2.5和O3质量浓度的拟合关系
Fig.5
The fitting relationship between meteorological elements in Longnan and the mass concentrations of PM10, PM2.5 and O3
2.3 SOM分型结果
2.3.1 天气形势分型与季节分布特征
图6为SOM分型下的9种大气环流型。可以看出,西南高压型(Type1)、低压槽辐合型(Type2)共性特征:甘肃南部受高压系统控制,北部为低压区,河西走廊和东北部盛行西北风。其中,Type1的高压范围更广,东南部地区以西风为主,出现频率为13.49%;Type2中东部存在低压槽,伴随弱西风和西南风辐合,出现频率为9.89%。经向高压控制型(Type3)特征:高压系统覆盖甘肃大部,东北部低压槽诱导经向环流,西北地区西风主导,东北部西北风显著,东南部呈静风状态,其出现频率最高(21.51%);弱高压脊型(Type4)特征:西北部弱西风与东部高压脊引导的南风共存,频率为3.09%;平直西风型(Type5)特征:西北平直西风与东南低压槽引导的西南风辐合,出现频率为11.77%;强气压梯度型(Type6)特征:北部强气压梯度驱动西北风,东南高压区北风较弱,其出现频率为10.09%;双高压型(Type7)特征:西南和东南部双高压系统导致中西部西北风与东部偏南风对峙,频率为11.26%;东部高压型(Type8):东部强高压与中西部大范围高压系统共同影响,导致东南风均匀分布,出现频率仅次于Type3,为18.58%;高压耦合型(Type9):弱高压与西南高压耦合,中东部为北风主导,河西走廊为东风,其频率最小,仅为0.31%。
图6
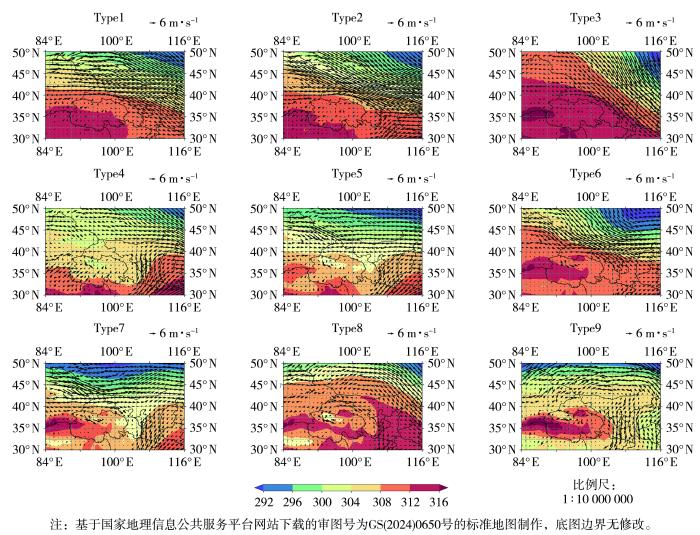
图6
基于SOM分型的700 hPa位势高度场(填色,单位:dagpm)和风场(箭矢,单位:m·s-1)
Fig.6
The 700 hPa geopotential height field (the color shaded, Unit: dagpm) and wind field (arrow vectors, Unit: m·s-1) based on SOM classification
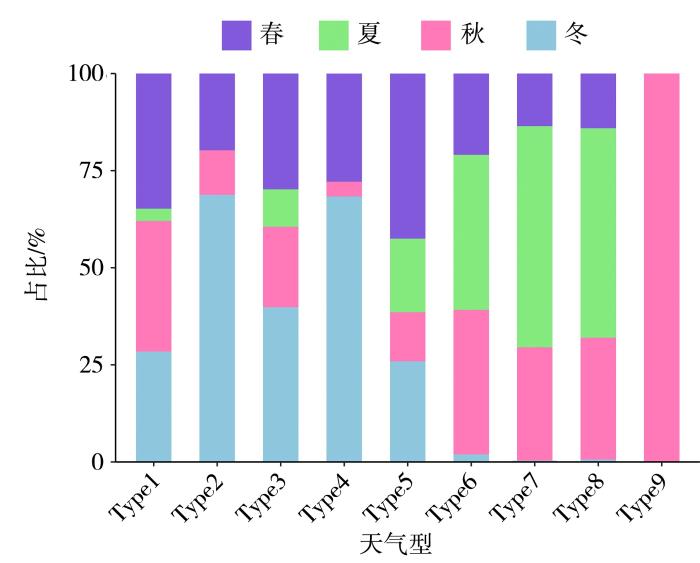
图7为9种天气型的季节分布特征,可见各类天气型呈现出明显的季节性差异。Type1~Type5主要出现在冬春两季,其中Type2和Type4在冬季的出现频率分别达68.77%和68.35%;Type1在春秋季的出现频率(分别为34.78%、33.62%)略高于冬季(28.41%);Type3冬季出现频率最高(39.82%),春季(29.82%)次之;而Type5春季出现频率最高,为42.52%,冬季(25.91%)次之。冬春季型主要的环流特征:甘肃南部受高压控制,北部为低压,大部分区域以强西北风为主(Type1~Type3),而在西风较弱时,甘肃中部处在低压槽后,天气形势较为稳定(Type4~Type5)。Type6~Type9主要出现在夏秋季,冬春季的出现频率较小。其中,Type6夏季出现频率略高于秋季,分别为39.92%、37.21%;Type7和Type8夏季出现最多,频率分别为56.94%和53.89%;Type9主要在秋季出现。夏秋季甘肃地区主要受高压系统控制,其中Type6~Type7在中西部地区以西风环流为主,Type8为东风主导,Type9在中东部地区表现为北风环流特征。
图7
2.3.2 不同天气型与污染物质量浓度特征
图8为酒泉、兰州、庆阳和陇南主要污染物质量浓度对天气型的响应特征。可以看出,PM10和PM2.5质量浓度在4个典型城市各天气型下分布相对一致。位于干旱区的酒泉,冬春季,在Type1、Type2、Type4、Type5天气型下PM10和PM2.5质量浓度普遍更高,其中PM10平均质量浓度分别为101.22、98.89、113.00、99.16 μg·m-3,PM2.5平均质量浓度分别为31.68、34.00、39.22和31.98 μg·m-3;夏秋季,在Type6~Type8型下颗粒物质量浓度有所降低,Type9型下最低。位于半干旱区的兰州、庆阳和湿润区的陇南颗粒物质量浓度在冬春季的天气型(Type 1~Type 5)下普遍高于夏秋季的天气型(Type6~Type9)下,其中Type2型下三地PM10平均质量浓度最高,分别为120.08、91.60、62.65 μg·m-3;兰州和庆阳在Type4型下PM2.5平均质量浓度最高,分别为54.44、57.44 μg·m-3,而陇南在Type2型下其平均质量浓度最高,为31.62 μg·m-3。4个城市中,O3质量浓度在夏秋季普遍高于冬春季,其中,酒泉和庆阳在Type8型下平均质量浓度最高,兰州、陇南分别在Type7、Type9型下最高,兰州、庆阳、酒泉、陇南O3平均质量浓度分别为120.47、118.85、133.05、101.94 μg·m-3。通常冬春季颗粒物质量浓度较高,主要受到沙尘传输以及人为源排放的影响;而夏秋季O3质量浓度较高,夏秋季太阳辐射更强,促进了光化学反应。对各城市不同天气型下污染物质量浓度进行t检验,结果显示p<0.01,说明污染物质量浓度在不同天气型下差异显著,天气型的影响独立于季节背景。
图8
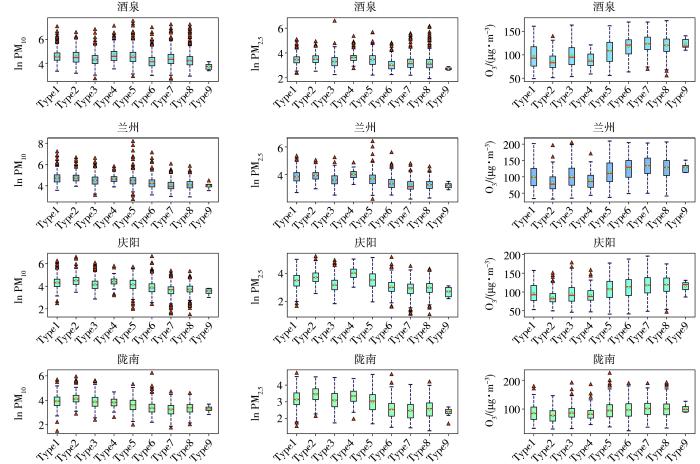
图8
9种环流型下典型城市3种污染物质量浓度箱线图
(点为平均值,红线为中位数,箱子上框线为上四分位数,下框线为下四分位数,上边缘为极大值,下边缘为极小值,三角为异常值)
Fig.8
Box plots of the mass concentrations of three pollutants under nine circulation patterns in typical cities
(The dots represent the mean values, the red lines denote the median, the upper line of the box indicates the upper quartile, the lower line of the box signifies the lower quartile, the upper edge represents the maximum value, the lower edge corresponds to the minimum value, and the triangles denote outliers)
2.3.3 不同天气型下位温和垂直速度对边界层高度的影响
图9为不同天气型下兰州和庆阳位温和风的垂直剖面。可以看出,在冬春季Type2、Type4型下兰州和庆阳边界层高度较低,甘肃中部地区处于槽后位置,以下沉气流为主,且大的垂直位温梯度增强了大气稳定性,其中Type2型下高层水平风速也抑制了对流活动触发。Type1、Type3和Type5型下兰州出现弱对流活动,且位温梯度减小或冷平流的侵入均使边界层得以抬升,Type5型下庆阳700 hPa受到高压影响,边界层有所抬升,Type1、Type3型下庆阳处在高压脊前,弱下沉气流可以抑制边界层发展,但西北冷平流增加了大气不稳定性。酒泉(图10)在Type2、Type4型下边界层高度较低,高层水平风和大的位温梯度使得大气层结较为稳定,而在Type1、Type3和Type5型下受冷平流影响,边界层升高。陇南(图11)在Type2、Type4和Type5型下受大的位温梯度影响,叠加南部暖平流的输送,抑制了边界层抬升,Type1、Type3型下陇南700 hPa处在高压系统控制下,低层伴随上升运动,边界层得以发展。夏秋季,Type6~Type9型占主导,Type6、Type8和Type9型下甘肃整体处于高压系统控制下,Type7型下其处于高压系统边缘,垂直活动较强,气温较高,边界层得以发展。
图9
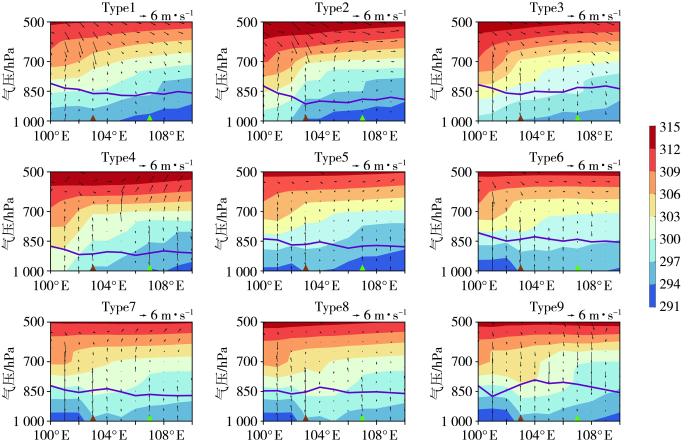
图9
各天气型下兰州、庆阳位温(填色,单位:K)和风(箭矢,单位:m·s-1)的垂直剖面
(紫色线代表边界层高度,下同;棕色和绿色三角分别代表兰州和庆阳所在经度)
Fig.9
The vertical cross-sections of potential temperature (the color shaded, Unit: K) and wind (arrow vectors, Unit: m·s-1) under different circulation patterns over Lanzhou and Qingyang
(The purple lines represent the boundary layer height, the same as below; the brown and green triangles indicate the longitudes of Lanzhou and Qingyang, respectively)
图10
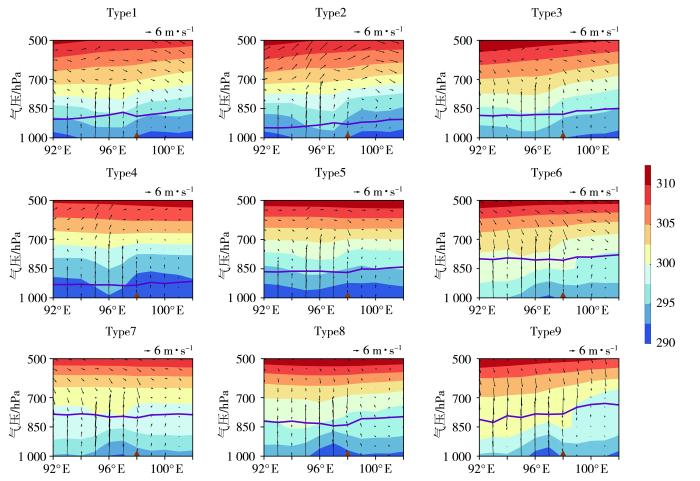
图10
各天气型下酒泉位温(填色,单位:K)和风(箭矢,单位:m·s-1)的垂直剖面
(棕色三角代表酒泉所在经度)
Fig.10
The vertical cross-sections of potential temperature (the color shaded, Unit: K) and wind (arrow vectors, Unit: m·s-1) under various circulation patterns over Jiuquan
(The brown triangle indicates the longitude of Jiuquan)
图11
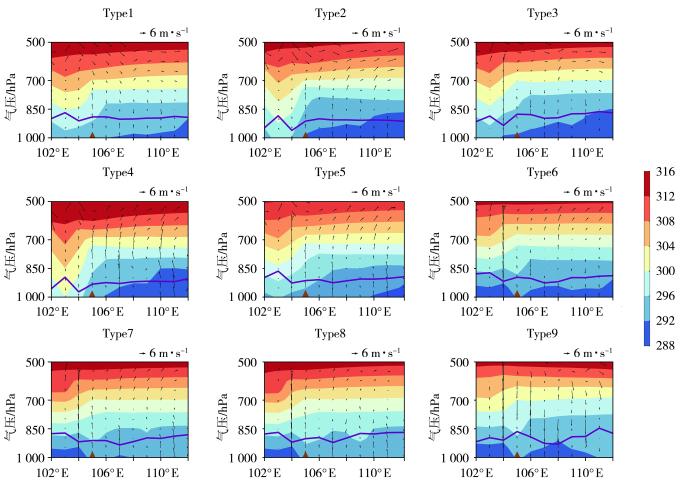
图11
各天气型下陇南位温(填色,单位:K)和风(箭矢,单位:m·s-1)的垂直剖面
(棕色三角代表陇南所在经度)
Fig.11
The vertical cross-sections of potential temperature (the color shaded, Unit: K) and wind (arrow vectors, Unit: m·s-1) under various circulation patterns over Longnan
(The brown triangle indicates the longitude of Longnan)
综上,冬春季,主导的天气型(Type1~Type5)对颗粒物污染具有明显调控作用。其中,Type2、Type4和Type5型下大气状态较稳定,同时甘肃东部盛行南风,携带的暖平流覆盖在边界层上,进一步抑制了边界层发展(Sun et al.,2021);Type1和Type3型下,通过西北风对污染物进行传输,尽管冷平流促进垂直扩散,但高层西风仍可实现污染物跨区域传输(Jin et al.,2021;Kang et al.,2021),其中Type3型下,甘肃南部地区受高压系统控制,西北风速较小,边界层高度较高,故颗粒物平均质量浓度处于较低水平。夏秋季,Type6~Type9型占主导,Type6、Type8和Type9型下甘肃受高压系统影响,多高温高湿天气,对流交换强,易激发光化学反应生成O3,且Type8、Type9型下存在东南气流输送;Type7型下甘肃受弱高压系统控制,兰州地区风速较其他型更强,垂直混合与输送条件可提供前体物,O3的生成条件较好(Wang et al.,2022)。
甘肃与我国华北平原污染物累积的动力学过程存在差异。华北地区的高污染事件呈现出典型的“低气压-偏南风”主导型环流特征:海平面受低压控制,近地面以东南风为主,易将南部工业区的污染物向北部地区输送,而西部太行山脉以及北部燕山山脉阻挡了污染物的水平扩散,同时南风携带的暖平流使得近地面气温升高,伴随城市热岛效应,导致持续的高污染天气(You et al.,2018;Li et al.,2020)。甘肃位于高原—盆地的过渡带,污染物累积呈现显著的地形强迫特征,强西风将来自青藏高原的冷空气向东携带进入盆地之后,焚风效应能够引起背风坡上部的气温升高,明显抑制了边界层发展,盆地内的夜间辐射冷却与白天的焚风效应叠加,使得污染物被压缩在浅薄层结中,难以扩散(Cheng et al.,2024)。
3 结论与讨论
本文利用污染物和气象要素的站点资料和ERA5再分析资料,通过SOM方法对甘肃地区进行天气分型,探究了天气形势对主要污染物的影响,得到如下具体结论。
1)甘肃14市PM10、PM2.5和O3作为主要污染物占比之和均达88%以上,其中PM10全省平均占比为39.9%,O3可达47.9%,PM2.5为8.8%,明显高于其他污染物。
2)气温与颗粒物质量浓度整体呈负相关关系,而O3质量浓度随气温升高呈非线性增加趋势;低风速(<1 m·s-1)和高风速(>4 m·s-1)条件下颗粒物质量浓度较高,而O3则在1~4 m·s-1风速条件下其质量浓度较高;相对湿度在25%~75%时,PM10、PM2.5和O3污染物质量浓度较高,但其影响存在区域差异,干旱区的酒泉在湿度小于25%条件下,沙尘天气易发,PM10质量浓度较高,PM2.5由于吸湿增长,其质量浓度随相对湿度升高而增加,O3在低湿条件下的消耗降低,其质量浓度随相对湿度升高递减。
3)冬春季,天气型以西南高压型和东部低槽型为主导,颗粒物污染程度较高,主要特征表现为强西北风能够形成污染物的输送通道,而东部存在低压槽时,大气稳定性增强,易造成污染物累积。夏秋季,天气型以高压控制为主,配合高温条件、强垂直运动以及东南气流输送作用,为光化学反应提供了有利条件,O3质量浓度普遍更高。
本研究采用SOM神经网络方法进行环流分型,相较于传统分型方法展现出明显优势。SOM方法能够有效捕捉大气环流中的非线性特征,克服了传统方法中人为划分的主观性局限,能够高效地处理高维气象数据。该方法综合考虑了高度场与风场的协同演变特征,并对大气数据中的噪声干扰具有较强的鲁棒性,环流分型结果可为甘肃高污染天气预警提供科学依据。针对甘肃省东西跨度大的地理特点,本研究选取不同气候区的典型城市,系统分析了气象要素、环流型与污染物质量浓度的关联特征,研究结果为不同区域制定差异化的污染物防控策略提供了理论支持。然而,本研究仍存在一定局限性,未考虑人为排放源对污染物质量浓度的直接影响,需要在后续研究中加以完善。
参考文献
卷积神经网络研究进展及其在大气科学中的应用
[J].
随着计算机技术和大数据的进步,深度学习尤其是卷积神经网络已成为处理网格结构大规模数据的主流技术,特别是在计算机视觉领域。卷积神经网络也开始应用于大气科学领域,针对多角度、多尺度的气象数据进行处理。本文综述了卷积神经网络及其在大气科学中的应用进展,总结如下:通过网络深度、宽度的优化和量级压缩,卷积神经网络的准确率和效率显著提升,成为计算机视觉任务的主流技术;卷积神经网络能高效处理气象数据,已应用于气象目标识别、极端事件检测、数值模式改进及干旱气象事件预报等方面,显示出良好的应用前景;卷积神经网络在大气科学中的应用尚处于探索阶段,且面临气象数据复杂、模型结构改进需求和可解释性差等挑战,需深入研究以推动其发展。
2014—2019年沈阳市大气污染物变化及气象因素影响分析
[C]//
Ozone affects plant, insect, and soil microbial communities: A threat to terrestrial ecosystems and biodiversity
[J].
Ambient PM2.5 reduces global and regional life expectancy
[J].
Impact of synoptic patterns and meteorological elements on the wintertime haze in the Beijing-Tianjin-Hebei region, China from 2013 to 2017
[J].
Improved method for characterising temporal variability in urban air quality part II: Particulate matter and precursors in central Poland
[J].
Understanding meteorological influences on PM2.5 concentrations across China: A temporal and spatial perspective
[J].
Influence of topography and synoptic weather patterns on air quality in a valley basin city of Northwest China
[J].
Predicting PM2.5 levels and exceedance days using machine learning methods
[J].
Multi-scale analysis of the impacts of meteorology and emissions on PM2.5 and O3 trends at various regions in China from 2013 to 2020 1: Synoptic circulation patterns and pollution
[J].
Spatial-temporal variations and mineral dust fractions in particulate matter mass concentrations in an urban area of northwestern China
[J].PM and PM concentration data were collected from five air-quality monitoring sites in Lanzhou from October 2014 to October 2015, revealing the spatial-temporal behavior of local particulate matter (PM). The Hybrid Single Particle Lagrangian Integrated Trajectory Model (HYSPLIT) and the PM-to-PM ratio model were used to investigate the primary transport path, potential source areas and contributions of the East Asian sandstorm to PM in Lanzhou. The analysis in three functional areas of the city indicated that the monthly variation in PM displayed a unimodal U pattern (the highest value was during the heating period), whereas that of PM displayed a bimodal pattern (the primary peak appeared in the spring, and the secondary peak appeared in the winter). These two patterns originated from different PM sources. The PM was primarily affected by human activities, and the PM was influenced by both natural and anthropogenic activities, but the relative contributions of these activities were associated with spatial-temporal variations. The daily PM and PM concentration variations displayed a bimodal pattern in the three functional areas: the peak values appeared at 11:00-13:00 and 22:00-1:00, respectively, and the lowest values appeared at 4:00-6:00 and 16:00-18:00, respectively. On the monthly, seasonal and daily scales, the PM concentrations exhibited similar patterns in the industrial, urban and rural areas, indicating that they were partly controlled by the regional natural environment. Meanwhile, due to anthropogenic factors, considerable PM amounts were discharged into the external environment, leading to maximum and minimum concentrations of PM appearing in the industrial and rural areas, respectively. The HYSPLIT model showed that dust storms from the northwest desert and Gobi regions affected Lanzhou three times in March 2015 and contributed 68% and 40% of the total mass of PM and PM, respectively.Copyright © 2018 Elsevier Ltd. All rights reserved.
Impacts of synoptic weather patterns on Hefei’s ozone in warm season and analysis of transport pathways during extreme pollution events
[J].
Multisensor and multimodel monitoring and investigation of a wintertime air pollution event ahead of a cold front over Eastern China
[J].
Health impact of China’s Air Pollution Prevention and Control Action Plan: An analysis of national air quality monitoring and mortality data
[J].
Atmospheric boundary layer-free troposphere air exchange in the North China plain and its impact on PM2.5 pollution
[J].
Effects of transboundary PM2.5 transported from China on the regional PM2.5 concentrations in South Korea: A spatial panel-data analysis
[J].
Three-dimensional distribution of PM2.5 over the Yangtze River Delta as cold fronts moving through
[J].
Severe particulate pollution days in China during 2013-2018 and the associated typical weather patterns in Beijing-Tianjin-Hebei and the Yangtze River Delta regions
[J].This study examined the spatial and temporal variations of severe particulate pollution days (SPPDs) in China by using observed PM concentrations during April 2013 to February 2018 from the Ministry of Environmental Protection of China. SPPDs were defined as those with observed daily mean PM concentrations larger than 150 μg m. Observations showed that northern China had the highest number of SPPDs during the studied period. Since 2015, the number of SPPDs in northwestern China is comparable to or even higher than that observed in Beijing-Tianjin-Hebei (BTH). The highest numbers of SPPDs observed within BTH and the Yangtze River Delta (YRD) were 122 (33), 95 (17), 57 (15), 78 (18), and 31 (25) days in 2013, 2014, 2015, 2016, and 2017, respectively, indicating a general decreasing trend as a result of emission reduction measures. SPPDs occurred mainly from November to February in BTH and in December and January in the YRD. The major circulation patterns associated with large-scale SPPDs were analyzed by using principal component analysis. Five typical synoptic weather patterns were identified for BTH. The most dominant weather type (a cold high centered over the Xinjiang and Mongolian regions) for BTH was also responsible for most of the SPPDs in the YRD. These results have important implications for emission control strategies during SPPDs. Emission control measures can be applied once the dominant circulation patterns have been predicted.Copyright © 2019 Elsevier Ltd. All rights reserved.
Exploring the regional pollution characteristics and meteorological formation mechanism of PM2.5 in North China during 2013-2017
[J].
Characteristics of PM2.5 spatial distribution and influencing meteorological conditions in Sichuan Basin, Southwestern China
[J].
Assessment of meteorological impact and emergency plan for a heavy haze pollution episode in a core city of the North China plain
[J].
Impacts of long-range transports from Central and South Asia on winter surface PM2.5 concentrations in China
[J].
Spatio-temporal characteristics of air pollutants over Xinjiang, Northwestern China
[J].
Boundary layer structure characteristics under objective classification of persistent pollution weather types in the Beijing area
[J].
Impact of meteorological conditions and human activities on air quality during the COVID-19 lockdown in Northeast China
[J].
Unexpected deterioration of O3 pollution in the south coast air basin of California: The role of meteorology and emissions
[J].
Assessing the role of cold front passage and synoptic patterns on air pollution in the Korean Peninsula
[J].
Impacts of plateau-induced lee troughs on regional PM2.5 over the Korean Peninsula
[J].
Differences in meteorological conditions between days with persistent and non-persistent pollution in Beijing, China
[J].
Impact of synoptic weather patterns on 24 h-average PM2.5 concentrations in the North China plain during 2013-2017
[J].
Effects of potential recirculation on air quality in coastal cities in the Yangtze River Delta
[J].

