基于机器学习的环流分型与甘肃大气污染机制研究
Research on circulation classification and atmospheric pollution mechanisms in Gansu based on machine learning
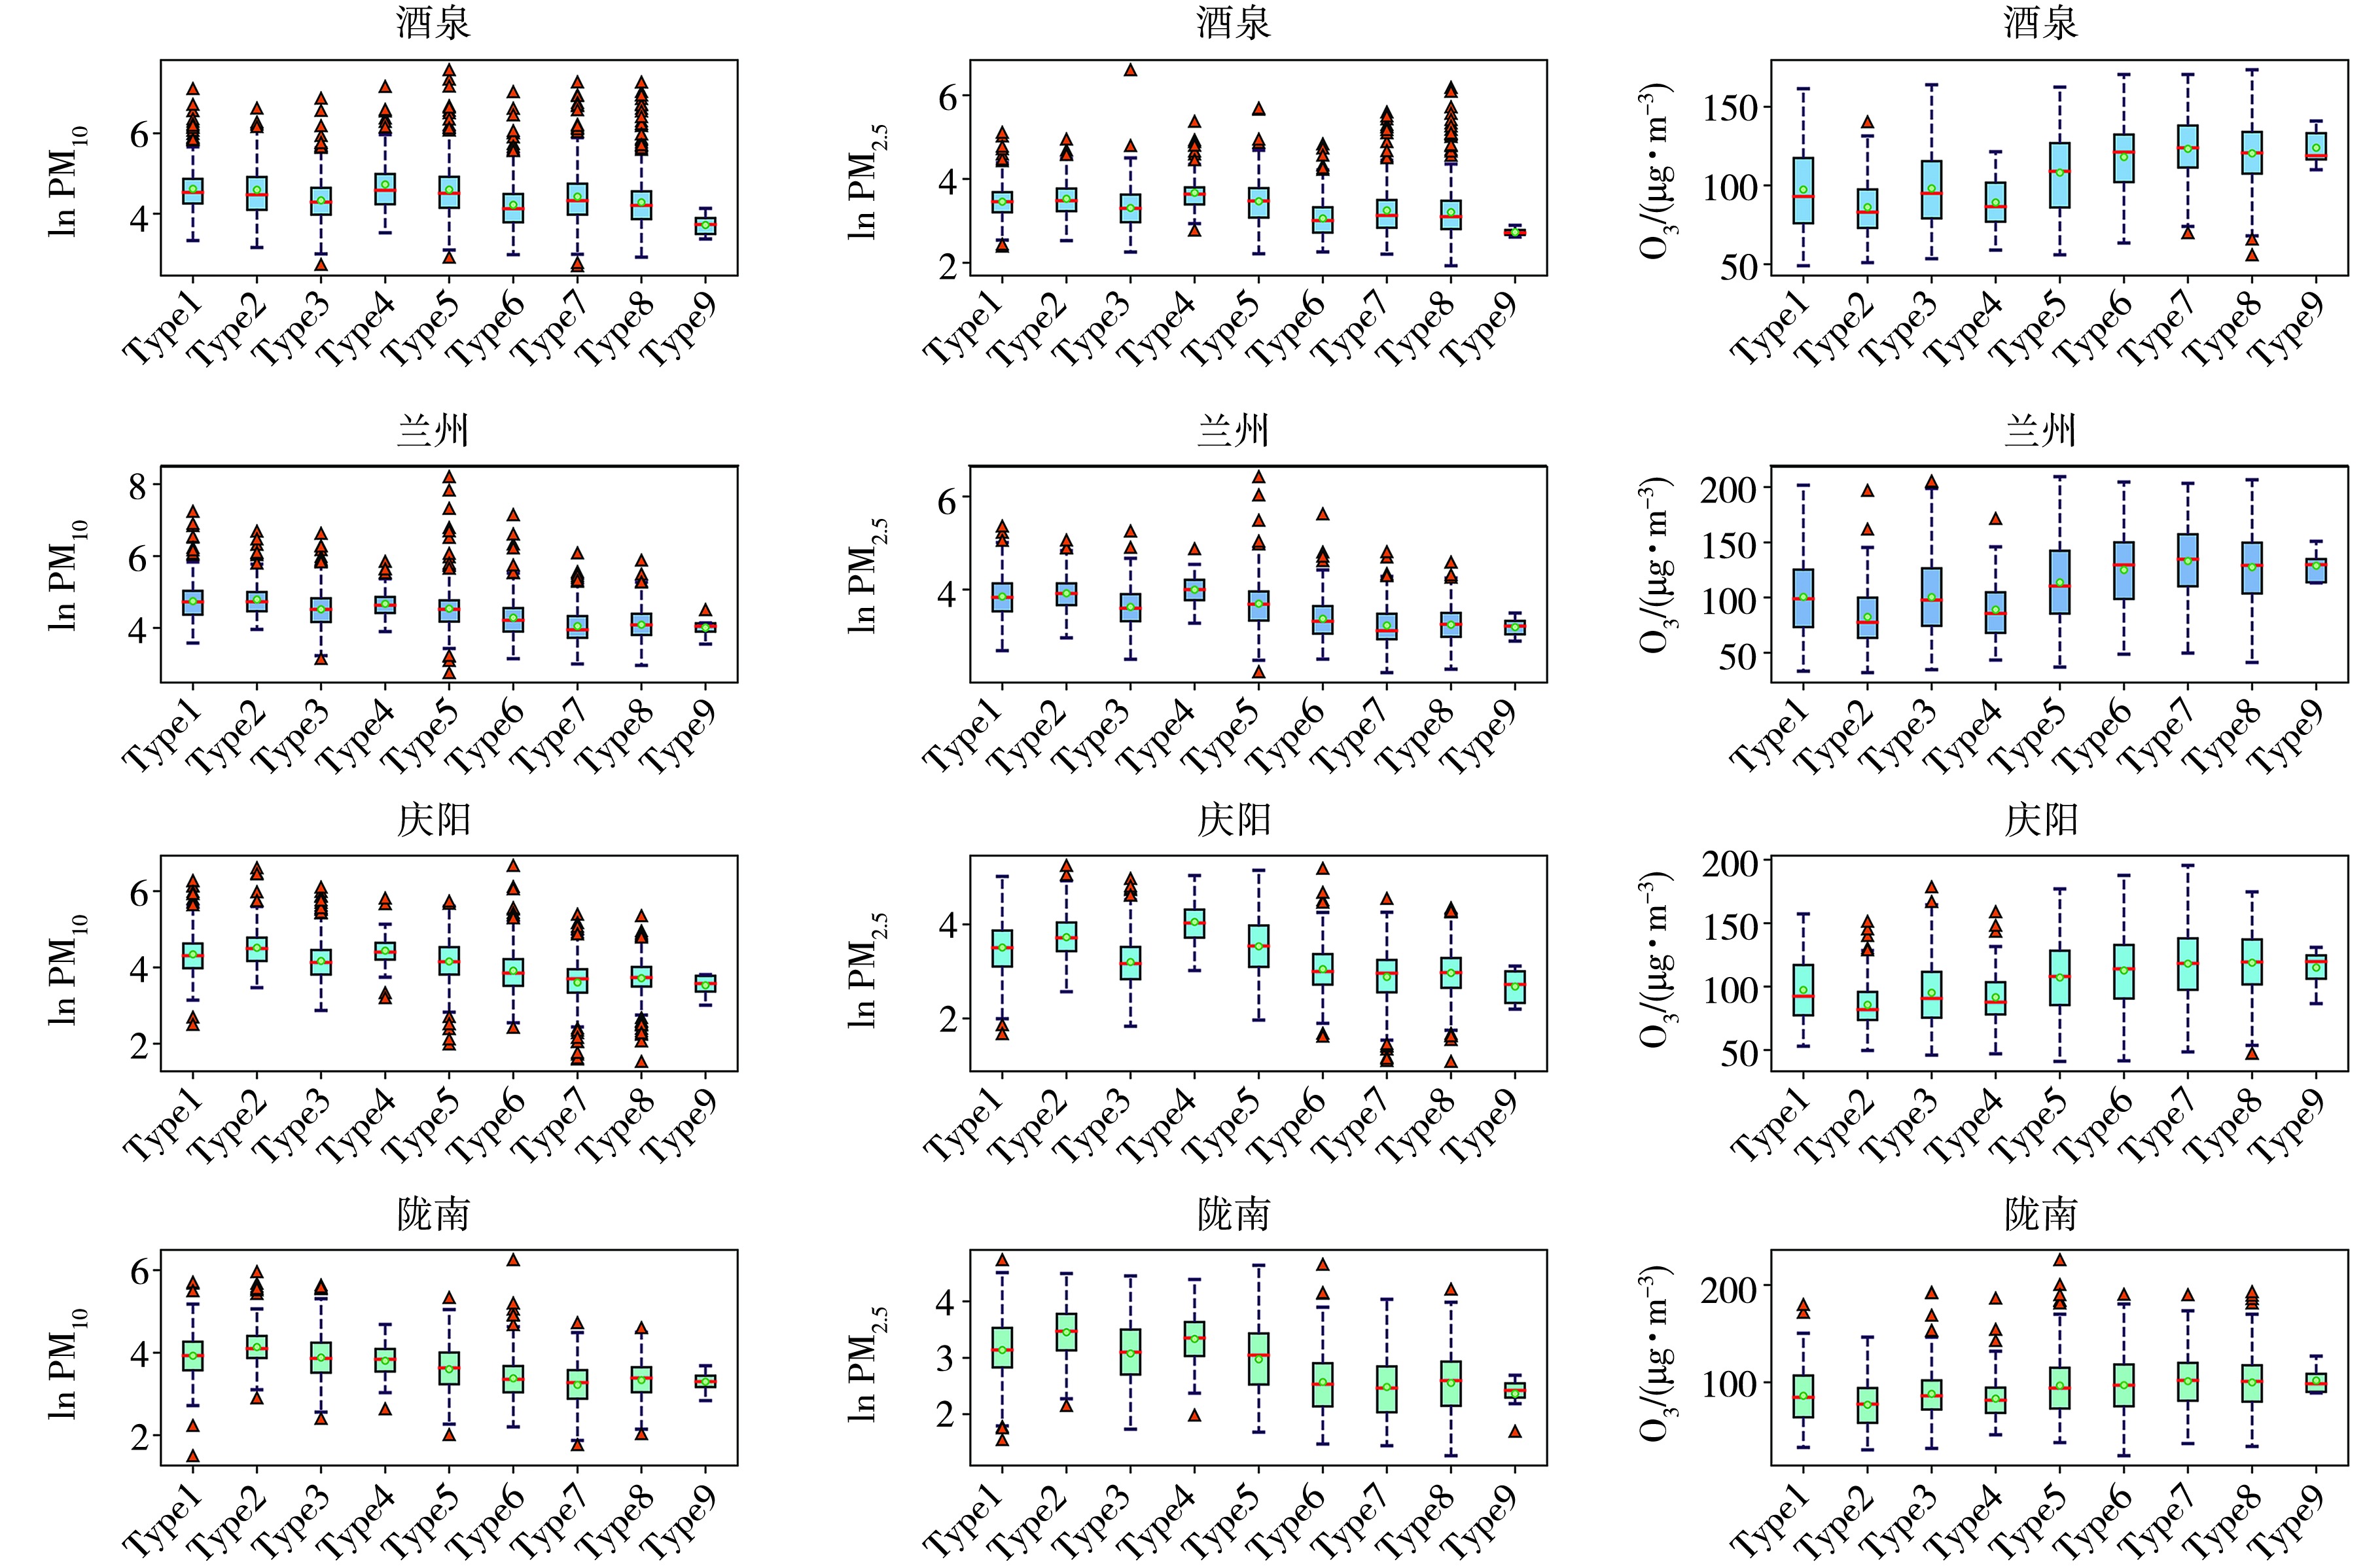
(点为平均值,红线为中位数,箱子上框线为上四分位数,下框线为下四分位数,上边缘为极大值,下边缘为极小值,三角为异常值)
(The dots represent the mean values, the red lines denote the median, the upper line of the box indicates the upper quartile, the lower line of the box signifies the lower quartile, the upper edge represents the maximum value, the lower edge corresponds to the minimum value, and the triangles denote outliers)