

引言
气溶胶是地球大气层中微小的悬浮粒子,也是影响气候变化最不确定因素之一(Boucher et al., 2013),它不仅可以通过吸收和散射到达地球表面的太阳辐射直接影响地气系统辐射收支,而且可以通过影响云量改变云的行星反照率、充当云凝结核影响成云过程和改变云滴有效半径、影响云的寿命等方式扰动全球辐射收支。此外,大气中吸收性气溶胶颗粒还会加热大气使云滴蒸发加快,云覆盖量减少,从而使到达地面的短波辐射增多,进而影响气候变化。因此,气溶胶是影响地气系统能量收支的重要因素。
不同类型气溶胶由于光学特性和理化性质不同,产生的辐射效应有所差异。尹宏和韩志刚(1989)利用一维辐射对流模式计算晴空和沙尘暴条件时气溶胶粒子对太阳辐射的吸收和对大气的加热,发现沙尘气溶胶大量存在时,大气对太阳辐射加热率增加80%~318%。毕鸿儒等(2022)通过MIROC6(Model for Interdisciplinary Research on Climate version 6)模式研究发现,部分人为气溶胶(硫酸盐、硝酸盐和有机碳等)的辐射强迫对地表有明显的辐射冷却效应,可部分抵消温室气体引起的增温效应。当具有不同辐射效应的气溶胶相互作用产生混合气溶胶时,其辐射效应将变得更加复杂。IPCC报告(Ramaswamy et al., 2001)显示,吸收性气溶胶黑碳导致的正辐射强迫会极大减弱散射性气溶胶硫酸盐带来的负辐射强迫,使得黑碳和硫酸盐混合产生的黑碳-硫酸盐气溶胶在辐射强迫估算时不确定性增大。Ma等(2012)研究表明,仅气溶胶混合状态、大小和密度的不确定性就可对全球气溶胶强迫造成0.5 W·m-2的影响。在我国西北沙尘源区和近源区,大气颗粒物常年以粗模态的沙尘气溶胶为主,特别在冬春季沙尘天气频发时期,源区的沙尘被抬升后,可跨区域远距离传输至我国东部地区和日韩等国,甚至可以跨太平洋传输至北美。传输过程中,沙尘气溶胶与沿途的人为污染物(硫化物、氮化物、生物质燃烧烟羽和黑碳等)相互混合作用形成污染沙尘,导致气溶胶颗粒的物理光学、化学组分等特性发生复杂变化,从而使其辐射效应评估更加困难(Zhang et al., 2019)。已有研究表明,在敦煌、民勤和兰州等沙尘源区和近源区,沙尘气溶胶受人类活动影响越多,其光学厚度与波长指数的分布关系越复杂(Zhou et al., 2018)。由此可见,对气溶胶类型的准确区分是进一步研究其气候与环境效应的前提。
激光雷达作为一种主动遥感手段,可以通过发射的激光束与大气颗粒物相互作用获得大气结构和成分等垂直分布信息,是用以开展大气颗粒物类型识别研究的重要途径。现阶段,基于不同平台的激光雷达观测在大气气溶胶和云类型区分方面已积累了丰富成果。其中,星载激光雷达监测覆盖面广、周期观测能力强,是观测大空间范围、长时间大气状况的有效手段。Omar等(2009)基于CALIPSO(The Cloud-Aerosol Lidar and Infrared Pathfinder Satellite Observation)卫星观测数据,并融合地表类型(陆地/海洋)、地理位置和海拔高度、地基观测主导型气溶胶类别、气溶胶后向散射特性和退偏比等因素,将全球气溶胶分成了10个亚类。Sugimoto等(2011)基于355 nm激光雷达的消光系数、后向散射系数和退偏比数据,发展了一种适用于EarthCARE(Earth Clouds, Aerosols and Radiation Explorer)卫星高光谱分辨率激光雷达的气溶胶分类方法,可以给出沙尘、黑碳和硫酸盐-硝酸盐-有机碳混合物的气溶胶垂直剖面信息。Ke等(2022)基于中国研制的第一台星载气溶胶-云高光谱激光雷达发展了气溶胶和云的反演算法,其反演的消光系数和后向散射系数等在识别气溶胶和云方面应用良好。Burton等(2012)使用机载高光谱分辨率激光雷达的激光雷达比、退偏比和色比等数据将气溶胶分为8种不同类型,并基于该分类标准,研究了2008年在阿拉斯加和加拿大西北部观测试验期间气溶胶类型的垂直变化特征。地基激光雷达以高精度、高时空分辨率和实时连续等优势成为开展大气气溶胶区域影响研究的有力手段,它可以观测大气气溶胶的散射和吸收特性以及时空分布。Baars等(2017)利用多年、多站点的EARLINET(The European Aerosol Research Lidar Network)数据提出了一个具有高时间分辨率的新参数——准粒子后向散射系数,该参数根据气溶胶的物理特性(大小、形状)将其分成了4类(小粒子、球形大粒子、非球形大粒子、混合粒子)。Shimizu等(2004)用地基偏振激光雷达在北京、长崎和筑波开展连续观测,根据532 nm波段的退偏比估算沙尘和球形粒子对后向散射系数的贡献,并用它们的后向散射廓线表征不同类型气溶胶的特性。Zhang等(2019)基于偏振激光雷达观测,利用体积线性退偏比和太阳光度计的光学厚度与波长指数等变量,给出我国黄土高原地区纯沙尘和污染沙尘的区分标准。Qi等(2021)基于不同大气颗粒物在355 nm和532 nm波段的体积线性退偏比的响应差异,结合532 nm/355 nm色比分布建立了可区分水云、冰云、污染物、沙尘和污染沙尘等亚类的阈值。此外,也有结合气团轨迹特征进行气溶胶分类的研究,如Mylonaki等(2021)开发了一种基于气团后向轨迹分析和卫星数据改进的自动层分类算法,可对气溶胶混合物进行分类。
上述诸多研究表明,退偏比是区分不同气溶胶类型的重要参量,它与气溶胶颗粒的粒径大小和形状密切相关(Pan et al., 2017)。我国西北干旱半干旱区地处内陆,海拔较高,气候干旱,降水稀少,气温年较差、日较差大,植被稀疏,下垫面类型多样(任朝霞和杨达源, 2007; 姚玉璧等, 2009)。该区域包含东亚最大的矿物沙尘排放源地——塔克拉玛干沙漠和戈壁荒漠,故常年以非球形沙尘颗粒为主导型气溶胶(Zhou et al., 2021; Han et al., 2022)。起源于该源区的沙尘向东传输过程中,颗粒大小和形状变化使其呈现出较低的退偏比。与我国东部地区丰富的气溶胶类型相比,西北干旱半干旱区气溶胶类型中具有更多的沙尘情景。然而,已有的基于激光雷达观测的气溶胶类型区分仍不够完善,特别是对清洁天和沙尘类别中的强沙尘暴情形等的判定标准尚未见研究报道。此外,随着现阶段大气环境立体监测技术的蓬勃发展,建立区域气溶胶精细分类的区分标准在大气环境监测业务应用中具有十分重要的意义。本文利用兰州大学半干旱气候与环境观测站地基双波长偏振激光雷达的长期观测资料,明确该地区清洁大气、人为污染物、污染沙尘、沙尘和强沙尘暴的体积线性退偏比和气溶胶退偏比判定阈值,以期为研究区域气溶胶气候影响和大气环境监测业务应用提供一定参考。
1 数据与方法
1.1 观测站点
兰州大学半干旱气候与环境观测站位于中国西北部甘肃省兰州市东部兰州大学榆中校区萃英山顶(104.137°E,35.946°N),海拔1 965.8 m,距离兰州市中心约48 km。该站点是按国际标准建设的气候观测平台,观测场占地约8 hm2,地处黄土高原、内蒙古高原和青藏高原(东北侧)的交汇区,是东部季风区、西北干旱区与高原高寒区三大自然气候区的过渡带,具有典型的区域代表性。下垫面为典型的黄土高原地貌,基本为原生草地植被,属于温带大陆性气候;台站周围环境受人类活动影响较小,可代表方圆几百公里半干旱区平均状况。
1.2 偏振激光雷达
双波长偏振激光雷达(L2S-SMⅡ型)由激光发射单元、信号接收单元和数据采集单元3部分组成。雷达系统激光器采用Nd:YAG闪光灯泵,通过发射波长为532 nm(偏振通道)和1 064 nm的激光探测空气分子和大气颗粒物,由一个直径为20 cm的施密特卡塞格林望远镜接收回波信号。通过回波信号的延迟时间确定粒子高度,回波信号的强度与对应高度大气颗粒或大气分子的浓度成正比。该激光雷达系统的空间分辨率为6 m,时间分辨率为15 min(周天等, 2013)。
1.3 数据
利用2009年10月1日至2012年11月30日期间双波长偏振激光雷达观测资料反演的消光系数、体积线性退偏比、气溶胶退偏比、散射比等数据产品。
在估算非球形粒子对总消光的影响时,选用对体积线性退偏比有贡献的气溶胶退偏比更优(Zhou et al., 2018),气溶胶退偏比(
通常,沙尘气溶胶的体积线性退偏比大于0.2,且沙尘气溶胶的非球形特征越明显,产生的体积线性退偏比越大(毛毛和孙昊飞,2020)。
1.4 主导型气溶胶的筛选
太阳光度计和激光雷达是区分气溶胶类型的重要遥感手段。前者基于大气柱气溶胶光学厚度、波长指数及其光谱特征可粗略实现气溶胶类型区分,根据气溶胶的光吸收和散射特性、粗细模态分数等参量可进一步精细化分类;后者主要基于气溶胶消光系数和退偏比两个光学变量获得气溶胶类型的垂直剖面,更先进的激光雷达系统还可以进一步根据后向散射系数比、激光雷达比、波长指数等实现精细化分类。气溶胶消光系数在垂直方向的积分可表示相应大气层的气溶胶光学厚度,气溶胶消光系数和光学厚度均与大气气溶胶载荷量成正比。根据AERONET(Aerosol Robotic Network)的气溶胶光学厚度和波长指数的聚类分析(Ma et al., 2017)发现,当光学厚度小于0.07时认定为清洁大气,而城市气溶胶/生物质燃烧、混合型气溶胶光学厚度的变化范围为0.07~2.00,沙尘的光学厚度主要为0.20~2.00,远大于清洁大气。同时,不同类型气溶胶因粒径差异使其对应的波长指数范围不同,人为污染物/生物质燃烧、混合型气溶胶和沙尘的波长指数依次为1.1~2.0、0.5~1.1和-0.5~0.5(Toledano et al., 2011),分别对应细颗粒主导型、混合型和粗颗粒主导型(Jin et al., 2010)。该分布特征与气溶胶的退偏比也存在较好的对应关系,Zhou等(2018)研究结果表明沙尘类别中光学厚度高值区所对应的气溶胶体积线性退偏比多高于0.30,而波长指数大于1.1时气溶胶体积线性退偏比几乎都小于0.10,且不同观测站点混合型气溶胶的体积线性退偏比变化范围会有不同。此外,Groβ等(2011)基于多波段偏振激光雷达观测的聚类分析表明沙尘气溶胶退偏比在所有气溶胶类型中最大,沙尘与其他气溶胶的混合都会使退偏比减小,特别在532 nm波段差异最为明显。据此,可以确定清洁大气、生物质燃烧、人为污染物的退偏比小,沙尘气溶胶的退偏比大;清洁大气情景下消光系数很小,人为污染物的消光系数变化幅度大;沙尘事件发生时,光学厚度和消光系数均为高值。其中,混合型气溶胶并不能直观地从退偏比和消光系数中界定。另外,根据本文研究区域实际观测,激光雷达在强沙尘暴过程中体积线性退偏比和消光系数均很大,且激光束在沙尘层内被完全衰减,而一般沙尘事件不会出现激光束无法穿透沙尘层的情形。因此,按照表1对2009年10月1日至2012年11月30日期间的观测资料进行挑选,共选出9例清洁大气、45例人为污染事件和57例沙尘事件,其中沙尘事件中包含3例强沙尘暴事件。
表1 主导气溶胶情景挑选依据
Tab.1
| 典型情形 | 是否穿透气溶胶层 | 体积线性退偏比 | 消光系数 |
|---|---|---|---|
| 清洁大气 | 是 | 小 | 小 |
| 人为污染 | 是 | 小 | 大 |
| 沙尘 | 是 | 大 | 大 |
| 强沙尘暴 | 否 | 大 | 大 |
1.5 阈值确定方法
根据上述不同气溶胶情景下消光系数和体积线性退偏比的特征差异,通过两个变量的概率密度分布进一步明确区分阈值。
图1
2 结果与讨论
2.1 典型情景下体积线性退偏比阈值
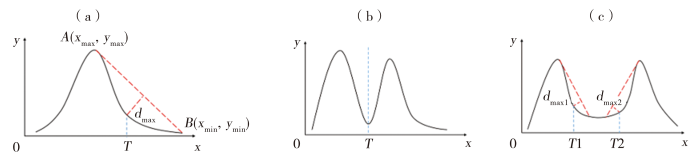
强沙尘暴事件发生时,沙尘气溶胶浓度激增,其非球形特征更加突出,导致体积线性退偏比增大,因此,强沙尘暴事件的体积线性退偏比和普通沙尘事件有所不同。图2是强沙尘暴事件的体积线性退偏比和消光系数的频数分布和概率密度分布,频数分布的高值区对应概率密度的峰值,由于体积线性退偏比概率密度的两个峰值是对同一个频数高值区的反映,且两峰距离较近,此处按照单峰处理。由三角法可以得到区分强沙尘暴事件的体积线性退偏比阈值为0.35。
图2
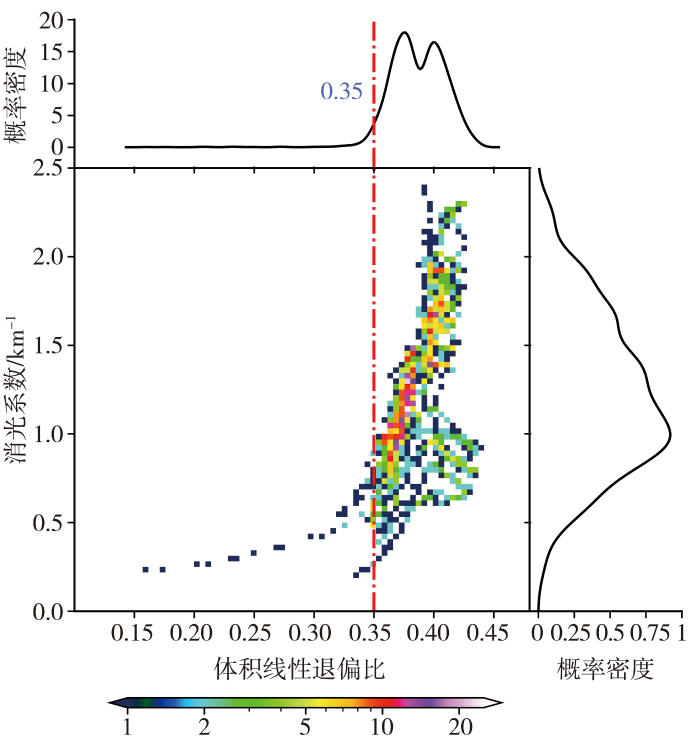
图2
强沙尘暴事件的体积线性退偏比和消光系数的频数分布及概率密度分布
Fig.2
Frequency distribution and probability density distribution of volume linear depolarization ratio and extinction coefficient of severe sandstorm events
图3是沙尘事件、人为污染以及清洁天情景下体积线性退偏比和消光系数的频数分布及概率密度分布。消光系数概率密度分布的波谷对应的消光系数为0.085 km-1。消光系数小于0.085 km-1时,大气对激光能量的衰减作用弱,大气透明度高,基本不含人为污染物或沙尘气溶胶,可认为是清洁大气;当消光系数大于0.085 km-1时,体积线性退偏比的分布有两个明显的频数高值区,利用三角法得到0.07和0.22两个阈值,分别对应区分人为污染物和沙尘事件的阈值,体积线性退偏比在0.07~0.22之间的部分,则认为是沙尘在传输途中与人为污染物混合形成的污染沙尘,此时沙尘气溶胶非球形特征减弱,体积线性退偏比变小。
图3

图3
清洁大气、人为污染和沙尘情形下体积线性退偏比和消光系数的频数分布及概率密度分布
Fig.3
Frequency distribution and probability density distribution of volume linear depolarization ratio and extinction coefficient under the conditions of clean sky, air pollution and dust weathers
2.2 气溶胶退偏比阈值
根据公式(2)可以推断,当后向散射比(BR)趋近于1.0时,会导致气溶胶退偏比超出正常取值范围。以全天所有廓线均有发散且发散最显著的2009年12月9日气溶胶变化(图4)为例,该日气溶胶主要集中于1.0 km以下,1.0 km以下后向散射比较大,且相应的体积线性退偏比在0.10~0.15之间;而1.0 km以上高度后向散射比多为1.0~2.0,多数体积线性退偏比小于等于0.10。从图4(b)中的气溶胶退偏比可以看出,在相应的气溶胶层顶部出现大量高值,这主要是气溶胶层上空的大气比较洁净,导致计算得到的气溶胶退偏比大于合理取值范围。该日23:00(世界时)后向散射比、气溶胶退偏比及体积线性退偏比的垂直廓线[图4(d)]更加直观地反映出这种异常情形。对比后向散射比和体积线性退偏比两条廓线,约在0.5 km以上气溶胶退偏比开始快速增大。因此,为明确气溶胶退偏比的气溶胶类别判定阈值,首先对其进行数据质量控制。
图4
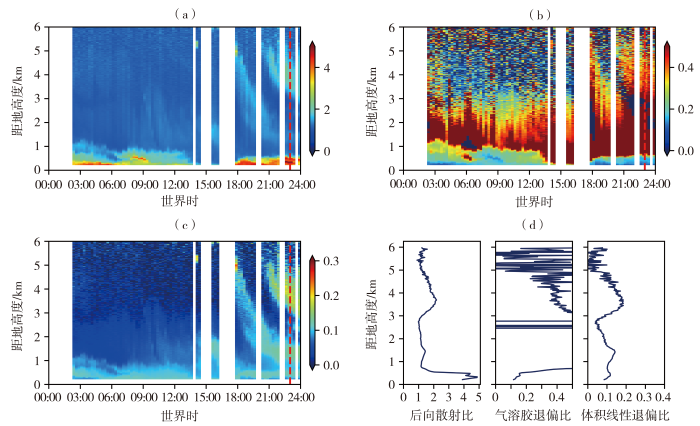
图4
2009年12月9日后向散射比(a)、气溶胶退偏比(b)、体积线性退偏比(c)的时间-高度剖面及23:00 UTC各变量廓线(d)
Fig.4
Time-height cross sections of backscatter ratio (a), aerosol depolarization ratio (b) and volume linear depolarization ratio (c) and the profiles of each variable at 23:00 UTC (d) on 9 December 2009
图5是2009年10月1日至2012年11月30日共669 d数据绘制的气溶胶退偏比和后向散射比频数分布。选取后向散射比0.95分位数处的3.39作为气溶胶退偏比阈值,当气溶胶散射比趋近1.00时,气溶胶退偏比开始趋向急剧增加,即后向散射比越接近1.00,气溶胶退偏比超出正常取值范围越多;后向散射比大于3.39时,99%的气溶胶退偏比小于0.50,回到合理取值区间。因此,为保证气溶胶退偏比阈值的可靠性,选择后向散射比大于3.39时的气溶胶退偏比进行数据分析。
图5

图5
2009年10月1日至2012年11月30日气溶胶退偏比和后向散射比的频数分布
Fig.5
Frequency distribution of aerosol depolarization ratio and backscatter ratio from 1 October 2009 to 30 November 2012
图6
图6
2009年12月9日气溶胶退偏比控制后的后向散射比(a)、气溶胶退偏比(c)的时间-高度剖面及23:00 UTC后向散射比(b)与气溶胶退偏比(d)廓线
Fig.6
Time-height cross sections of backscatter ratio (a) and aerosol depolarization ratio (c) after data control of aerosol depolarization ratio and profiles of backscatter ratio (b) and aerosol depolarization ratio (d) at 23:00 UTC on 9 December 2009
图7
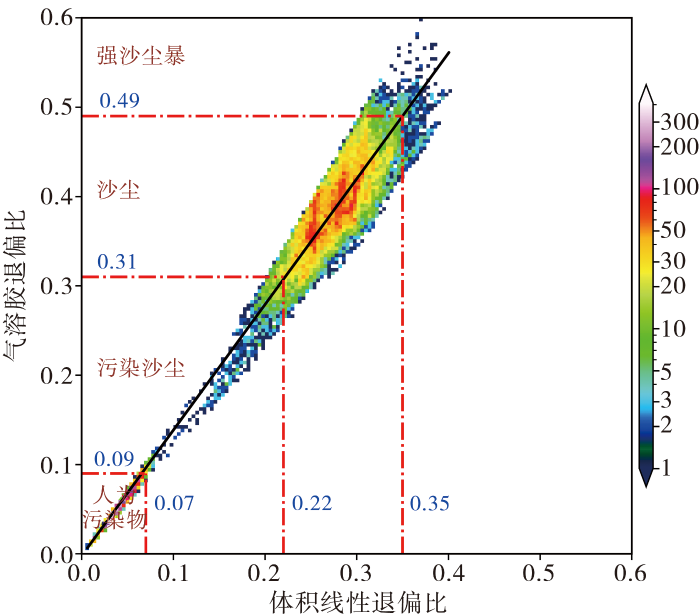
图7
4种典型情形下的体积线性退偏比和气溶胶退偏比频数分布及线性回归
Fig.7
Frequency distribution and linear regression of volume linear depolarization ratio and aerosol depolarization ratio under four typical conditions
表2 气溶胶类别判定阈值
Tab.2
| 典型情形 | 消光系数/km-1 | 体积线性 退偏比 | 气溶胶 退偏比 |
|---|---|---|---|
| 清洁大气 | <0.085 | <0.07 | <0.09 |
| 人为污染 | >0.085 | <0.07 | <0.09 |
| 污染沙尘 | >0.085 | >0.07且<0.22 | >0.09且<0.31 |
| 沙尘 | >0.085 | >0.22 | >0.31 |
| 强沙尘暴 | >0.085 | >0.35 | >0.49 |
Liu等(2008)通过分析无云条件下的CALIPSO(The Cloud-Aerosol Lidar and Infrared Pathfinder Satellite Observation)观测资料发现,黑碳、硫酸盐等人为污染物的体积线性退偏比不会超过0.02,并用体积线性退偏比0.06来判定沙尘。Chen等(2007)通过台湾激光雷达2004—2005年观测资料统计发现沙尘的体积线性退偏比在0.06~0.30之间。Mamouri 和Ansmann(2014)在POLIPHON(polarization-lidar photometer networking)算法中分别采用体积线性退偏比0.16和0.39判定细模态和粗模态沙尘,得到沙尘气溶胶的退偏比为0.31。Córdoba-Jabonero等(2018)在改进的POLIPHON算法中也采用气溶胶退偏比0.31来区分纯沙尘。本文结论与上述研究结果具有较好的一致性。
3 结论
利用兰州大学半干旱气候与环境观测站双波段偏振激光雷达于2009年10月至2012年11月的观测资料,通过对4种典型情形下气溶胶的激光雷达回波信号强度、体积线性退偏比、消光系数和气溶胶退偏比的分析,得到相应情形下的消光系数、体积线性退偏比和气溶胶退偏比的判定阈值。
该地区清洁大气的消光系数小于0.085 km-1。在消光系数大于该阈值的污染情形下,人为污染物的体积线性退偏比小于0.07,气溶胶退偏比小于0.09;污染沙尘的体积线性退偏比介于0.07和0.22之间,气溶胶退偏比为0.09~0.31;纯沙尘的体积线性退偏比大于0.22,气溶胶退偏比大于0.31。当出现强沙尘暴时,其体积线性退偏比大于0.35,气溶胶退偏比大于0.49。
本研究给出的气溶胶类型判定阈值,尤其是结合观测经验给出了一般沙尘事件和沙尘暴事件的判断阈值,可为气溶胶辐射特性和气候变化评估提供技术支持,改善气候模式的参数化方案,提高模式预测的准确性。
参考文献
基于MIROC6模式探讨1850—2014年全球不同类型人为气溶胶的时空分布及辐射强迫
[J].
Calculation of the calibration constant of polarization lidar and its dependency on atmospheric temperature
[J].
The volume depolarization ratio of the molecular backscatter signal detected with polarization lidar varies by a factor of nearly 4 depending on whether the rotational Raman bands are included in the detected signals of the individual system or not. If the rotational Raman spectrum is included partially in the signals, this calibration factor depends on the temperature of the atmosphere. This dependency is studied for different spectral widths of the receiving channels. In addition, the sensitivity to differences between the laser wavelength and the center wavelength of the receiver are discussed.
Target categorization of aerosol and clouds by continuous multiwavelength-polarization lidar measurements
[J].. Absolute calibrated signals at 532 and 1064 nm and the depolarization ratio from a multiwavelength lidar are used to categorize primary aerosol but also clouds in high temporal and spatial resolution. Automatically derived particle backscatter coefficient profiles in low temporal resolution (30 min) are applied to calibrate the lidar signals. From these calibrated lidar signals, new atmospheric parameters in temporally high resolution (quasi-particle-backscatter coefficients) are derived. By using thresholds obtained from multiyear, multisite EARLINET (European Aerosol Research Lidar Network) measurements, four aerosol classes (small; large, spherical; large, non-spherical; mixed, partly non-spherical) and several cloud classes (liquid, ice) are defined. Thus, particles are classified by their physical features (shape and size) instead of by source. The methodology is applied to 2 months of continuous observations (24 h a day, 7 days a week) with the multiwavelength-Raman-polarization lidar PollyXT during the High-Definition Clouds and Precipitation for advancing Climate Prediction (HD(CP)2) Observational Prototype Experiment (HOPE) in spring 2013. Cloudnet equipment was operated continuously directly next to the lidar and is used for comparison. By discussing three 24 h case studies, it is shown that the aerosol discrimination is very feasible and informative and gives a good complement to the Cloudnet target categorization. Performing the categorization for the 2-month data set of the entire HOPE campaign, almost 1 million pixel (5 min × 30 m) could be analysed with the newly developed tool. We find that the majority of the aerosol trapped in the planetary boundary layer (PBL) was composed of small particles as expected for a heavily populated and industrialized area. Large, spherical aerosol was observed mostly at the top of the PBL and close to the identified cloud bases, indicating the importance of hygroscopic growth of the particles at high relative humidity. Interestingly, it is found that on several days non-spherical particles were dispersed from the ground into the atmosphere.\n
Climate Change 2013: the physical science basis: contribution of Working Group I to the Fifth Assessment Report of the Intergovernmental Panel on Climate Change
[C]//
Aerosol classification using airborne high spectral resolution lidar measurements-methodology and examples
[J].. The NASA Langley Research Center (LaRC) airborne High Spectral Resolution Lidar (HSRL) on the NASA B200 aircraft has acquired extensive datasets of aerosol extinction (532 nm), aerosol optical depth (AOD) (532 nm), backscatter (532 and 1064 nm), and depolarization (532 and 1064 nm) profiles during 18 field missions that have been conducted over North America since 2006. The lidar measurements of aerosol intensive parameters (lidar ratio, depolarization, backscatter color ratio, and spectral depolarization ratio) are shown to vary with location and aerosol type. A methodology based on observations of known aerosol types is used to qualitatively classify the extensive set of HSRL aerosol measurements into eight separate types. Several examples are presented showing how the aerosol intensive parameters vary with aerosol type and how these aerosols are classified according to this new methodology. The HSRL-based classification reveals vertical variability of aerosol types during the NASA ARCTAS field experiment conducted over Alaska and northwest Canada during 2008. In two examples derived from flights conducted during ARCTAS, the HSRL classification of biomass burning smoke is shown to be consistent with aerosol types derived from coincident airborne in situ measurements of particle size and composition. The HSRL retrievals of AOD and inferences of aerosol types are used to apportion AOD to aerosol type; results of this analysis are shown for several experiments.\n
Optical properties of Asian dusts in the free atmosphere measured by Raman lidar at Taipei, Taiwan
[J].
Separation of the optical and mass features of particle components in different aerosol mixtures by using POLIPHON retrievals in synergy with continuous polarized Micro-Pulse Lidar (P-MPL) measurements
[J].. The application of the POLIPHON (POlarization-LIdar PHOtometer Networking)\nmethod is presented for the first time in synergy with continuous\n24/7 polarized Micro-Pulse Lidar (P-MPL)\nmeasurements to derive the vertical separation of two or three particle\ncomponents in different aerosol mixtures, and the retrieval of their\nparticular optical properties. The procedure\nof extinction-to-mass conversion, together with an analysis of the mass extinction efficiency (MEE) parameter, is described, and the relative mass\ncontribution of each aerosol component is also derived in a further step. The\ngeneral POLIPHON algorithm is based on the specific particle linear\ndepolarization ratio given for different types of aerosols and can be run in\neither 1-step (POL-1) or 2 steps (POL-2) versions with dependence on either the\n2- or 3-component separation. In order to illustrate this procedure, aerosol\nmixing cases observed over Barcelona (NE Spain) are selected: a dust event\non 5 July 2016, smoke plumes detected on 23 May 2016 and a\npollination episode observed on 23 March 2016. In particular, the 3-component\nseparation is just applied for the dust case: a combined POL-1 with POL-2\nprocedure (POL-1/2) is used, and additionally the fine-dust contribution to\nthe total fine mode (fine dust plus non-dust aerosols) is estimated. The\nhigh dust impact before 12:00 UTC yields a mean mass loading of\n0.6±0.1 g m−2 due to the prevalence of Saharan coarse-dust\nparticles. After that time, the mean mass loading is reduced by two-thirds,\nshowing a rather weak dust incidence. In the smoke case, the arrival of fine\nbiomass-burning particles is detected at altitudes as high as 7 km.\nThe smoke particles, probably mixed with less depolarizing non-smoke\naerosols, are observed in air masses, having their origin from either North\nAmerican fires or the Arctic area, as reported by HYSPLIT back-trajectory\nanalysis. The particle linear depolarization ratio for smoke shows values in\nthe 0.10–0.15 range and even higher at given times, and the daily mean smoke\nmass loading is 0.017±0.008 g m−2, around 3 % of that found\nfor the dust event. Pollen particles are detected up to 1.5 km in height from\n10:00 UTC during an intense pollination event with a particle linear\ndepolarization ratio ranging between 0.10 and 0.15. The maximal mass loading\nof Platanus pollen particles is 0.011±0.003 g m−2,\nrepresenting around 2 % of the dust loading during the higher dust\nincidence. Regarding the MEE derived for each aerosol component, their values\nare in agreement with others referenced in the literature for the specific\naerosol types examined in this work: 0.5±0.1 and\n1.7±0.2 m2 g−1 are found for coarse and fine dust particles, 4.5±1.4 m2 g−1 is derived for smoke and\n2.4±0.5 m2 g−1 for non-smoke aerosols with Arctic origin, and a MEE of 2.4±0.8 m2 g−1 is obtained\nfor pollen particles, though it can reach higher or lower values depending on\npredominantly smaller or larger pollen grain sizes. Results reveal the high\npotential of the P-MPL system, a simple polarization-sensitive elastic\nbackscatter lidar working in a 24/7 operation mode, to retrieve the\nrelative optical and mass contributions of each aerosol component throughout\nthe day, reflecting the daily variability of their properties. In fact, this\nprocedure can be simply implemented in other P-MPLs that also operate within the\nworldwide Micro-Pulse Lidar Network (MPLNET), thus extending the aerosol\ndiscrimination at a global scale. Moreover, the method has the advantage of also\nbeing relatively easily applicable to space-borne lidars with an equivalent\nconfiguration such as the ongoing Cloud-Aerosol LIdar with Orthogonal\nPolarization (CALIOP) on board NASA CALIPSO (Cloud-Aerosol Lidar and Infrared\nPathfinder Satellite Observation) and the forthcoming Atmospheric\nLidar (ATLID) on board the ESA EarthCARE mission.\n
Characterization of Saharan dust, marine aerosols and mixtures of biomass-burning aerosols and dust by means of multi-wavelength depolarization and Raman lidar measurements during SAMUM 2
[J].
A new algorithm of atmospheric boundary layer height determined from polarization lidar
[J].Accurately determining the atmospheric boundary layer height (ABLH) is needed when one is addressing the air quality-related issues in highly urbanized areas, as well as when one is investigating issues that are related to the emission and transport of dust aerosols over the source region. In this study, we propose a new ABLH retrieval method, which is named ADEILP (ABLH that is determined by polarization lidar); it is based on the short-term polarized lidar observation that took place during the intensive field campaign in July 2021 in Tazhong, the hinterland of Taklimakan Desert. Furthermore, we conducted comparisons between the ABLH that was identified using a radiosonde (ABLHsonde), the ABLH that was identified by ERA5 (ABLHERA5) and the ABHL that was identified by ADELIP (ABLHADELIP), and we discussed the implications of the dust events. The ADELIP method boasts remarkable advancements in two parts: (1) the lidar volume linear depolarization ratio (VLDR) that represented the aerosol type was adopted, which is very effective in distinguishing between the different types of boundary layers (e.g., mixing layer and residual layer); (2) the idea of breaking up the entire layer into sub-layers was applied on the basis of the continues wavelet transform (CWT) method, which is favorable when one is considering the effect of fine stratification in an aerosol layer. By combining the appropriate height limitations, these factors ensured that there was good robustness of the ADELIP method, thereby enabling it to deal with complex boundary layer structures. The comparisons revealed that ABLHADELIP shows good consistency with ABLHsonde and ABLHERA5 for non-dust events. Nevertheless, the ADELIP method overestimated the stable boundary layer and underestimated the heights of the mixing layer. The dust events seem to be a possible reason for the great difference between ABLHERA5 and ABLHsonde. Thus, it is worth suggesting that the influence that is caused by the differences of the vertical profile in the ERA5 product should be carefully considered when the issues on dust events are involved. Overall, these findings support the climatological analysis of the atmosphere boundary layer and the vertical distribution characteristics of aerosols over typical climatic zones.
Validation of the dust layer structure over the Taklimakan Desert, China by the CALIOP space-borne lidar using ground-based lidar
[J].
Development of China’s first space-borne aerosol-cloud high-spectral-resolution lidar: retrieval algorithm and airborne demonstration
[J].Aerosols and clouds greatly affect the Earth’s radiation budget and global climate. Light detection and ranging (lidar) has been recognized as a promising active remote sensing technique for the vertical observations of aerosols and clouds. China launched its first space-borne aerosol-cloud high-spectral-resolution lidar (ACHSRL) on April 16, 2022, which is capable for high accuracy profiling of aerosols and clouds around the globe. This study presents a retrieval algorithm for aerosol and cloud optical properties from ACHSRL which were compared with the end-to-end Monte-Carlo simulations and validated with the data from an airborne flight with the ACHSRL prototype (A2P) instrument. Using imaging denoising, threshold discrimination, and iterative reconstruction methods, this algorithm was developed for calibration, feature detection, and extinction coefficient (EC) retrievals. The simulation results show that 95.4% of the backscatter coefficient (BSC) have an error less than 12% while 95.4% of EC have an error less than 24%. Cirrus and marine and urban aerosols were identified based on the airborne measurements over different surface types. Then, comparisons were made with U.S. Cloud-Aerosol Lidar with Orthogonal Polarization (CALIOP) profiles, Moderate-resolution Imaging Spectroradiometer (MODIS), and the ground-based sun photometers. High correlations (R > 0.79) were found between BSC (EC) profiles of A2P and CALIOP over forest and town cover, while the correlation coefficients are 0.57 for BSC and 0.58 for EC over ocean cover; the aerosol optical depth retrievals have correlation coefficient of 0.71 with MODIS data and show spatial variations consistent with those from the sun photometers. The algorithm developed for ACHSRL in this study can be directly employed for future space-borne high-spectral-resolution lidar (HSRL) and its data products will also supplement CALIOP data coverage for global observations of aerosol and cloud properties.
A height resolved global view of dust aerosols from the first year CALIPSO lidar measurements
[J].
Aerosol direct radiative forcing based on GEOS-Chem-APM and uncertainties
[J].
Optical properties and source analysis of aerosols over a desert area in Dunhuang, Northwest China
[J].
Fine and coarse dust separation with polarization lidar
[J].. The polarization-lidar photometer networking (POLIPHON) method for separating dust and non-dust aerosol backscatter and extinction, volume, and mass concentration is extended to allow for a height-resolved separation of fine-mode and coarse-mode dust properties in addition. The method is applied to a period with complex aerosol layering of fine-mode background dust from Turkey and Arabian desert dust from Syria. The observation was performed at the combined European Aerosol Research Lidar Network (EARLINET) and Aerosol Robotic Network (AERONET) site of Limassol (34.7° N, 33° E), Cyprus, in September 2011. The dust profiling methodology and case studies are presented. Consistency between the column-integrated optical properties obtained with sun/sky photometer and the respective results derived by means of the new lidar-based method corroborate the applicability of the extended POLIPHON version.\n
Aerosol type classification analysis using EARLINET multiwavelength and depolarization lidar observations
[J].
The CALIPSO automated aerosol classification and lidar ratio selection algorithm
[J].Descriptions are provided of the aerosol classification algorithms and the extinction-to-backscatter ratio (lidar ratio) selection schemes for the Cloud-Aerosol Lidar and Infrared Pathfinder Satellite Observations (CALIPSO) aerosol products. One year of CALIPSO level 2 version 2 data are analyzed to assess the veracity of the CALIPSO aerosol-type identification algorithm and generate vertically resolved distributions of aerosol types and their respective optical characteristics. To assess the robustness of the algorithm, the interannual variability is analyzed by using a fixed season (June–August) and aerosol type (polluted dust) over two consecutive years (2006 and 2007). The CALIPSO models define six aerosol types: clean continental, clean marine, dust, polluted continental, polluted dust, and smoke, with 532-nm (1064 nm) extinction-to-backscatter ratios Sa of 35 (30), 20 (45), 40 (55), 70 (30), 65 (30), and 70 (40) sr, respectively. This paper presents the global distributions of the CALIPSO aerosol types, the complementary distributions of integrated attenuated backscatter, and the volume depolarization ratio for each type. The aerosol-type distributions are further partitioned according to surface type (land/ocean) and detection resolution (5, 20, and 80 km) for optical and spatial context, because the optically thick layers are found most often at the smallest spatial resolution. Except for clean marine and polluted continental, all the aerosol types are found preferentially at the 80-km resolution. Nearly 80% of the smoke cases and 60% of the polluted dust cases are found over water, whereas dust and polluted continental cases are found over both land and water at comparable frequencies. Because the CALIPSO observables do not sufficiently constrain the determination of the aerosol, the surface type is used to augment the selection criteria. Distributions of the total attenuated color ratios show that the use of surface type in the typing algorithm does not result in abrupt and artificial changes in aerosol type or extinction.
Real-time observational evidence of changing Asian dust morphology with the mixing of heavy anthropogenic pollution
[J].Natural mineral dust and heavy anthropogenic pollution and its complex interactions cause significant environmental problems in East Asia. Due to restrictions of observing technique, real-time morphological change in Asian dust particles owing to coating process of anthropogenic pollutants is still statistically unclear. Here, we first used a newly developed, single-particle polarization detector and quantitatively investigate the evolution of the polarization property of backscattering light reflected from dust particle as they were mixing with anthropogenic pollutants in North China. The decrease in observed depolarization ratio is mainly attributed to the decrease of aspect ratio of the dust particles as a result of continuous coating processes. Hygroscopic growth of Calcium nitrate (Ca(NO3)(2)) on the surface of the dust particles played a vital role, particularly when they are stagnant in the polluted region with high RH conditions. Reliable statistics highlight the significant importance of internally mixed, 'quasi-spherical' Asian dust particles, which markedly act as cloud condensation nuclei and exert regional climate change.
The analysis of cell images
[J].
Classification of atmospheric aerosols and clouds by use of dual-polarization lidar measurements
[J].
TAR Climate Change 2001: The Scientific Basis
[C]//
Continuous observations of Asian dust and other aerosols by polarization lidars in China and Japan during ACE-Asia
[J].
Aerosol classification retrieval algorithms for EARTHCARE/ ATLID, CALIPSO/CALIOP, and ground-based lidars
[C]//
Optical properties of aerosol mixtures derived from sun-sky radiometry during SAMUM-2
[J].
Automatic measurement of sister chromatid exchange frequency
[J].An automatic system for detecting and counting sister chromatid exchanges in human chromosomes has been developed. Metaphase chromosomes from lymphocytes which had incorporated 5-bromodeoxyuridine for two replication cycles were treated with the dye 33258 Hoechst and photodegraded so that the sister chromatids exhibited differential Giemsa staining. A computer-controlled television-microscope system was used to acquire digitized metaphase spread images by direct scanning of microscope slides. Individual objects in the images were identified by a thresholding procedure. The probability that each object was a single, separate chromosome was estimated from size and shape measurements. An analysis of the spatial relationships of the dark-chromatid regions of each object yielded a set of possible exchange locations and estimated probabilities that such locations corresponded to sister chromatid exchanges. A normalized estimate of the sister chromatid exchange frequency was obtained by summing the joint probabilities that a location contained an exchange within a single, separate chromosome over the set of chromosomes from one or more cells and dividing by the expected value of the total chromosome area analyzed. Comparison with manual scoring of exchanges showed satisfactory agreement up to levels of approximately 30 sister chromatid exchanges/cell, or slightly more than twice control levels. The processing time for this automated sister chromatid exchange detection system was comparable to that of manual scoring.
Three-year continuous observation of pure and polluted dust aerosols over northwest China using the ground-based lidar and sun photometer data
[J].
Lidar measurements of dust aerosols during Three Field Campaigns in 2010, 2011 and 2012 over Northwestern China
[J].Ground-based measurements were carried out during field campaigns in April–June of 2010, 2011 and 2012 over northwestern China at Minqin, the Semi-Arid Climate and Environment Observatory of Lanzhou University (SACOL) and Dunhuang. In this study, three dust cases were examined, and the statistical results of dust occurrence, along with physical and optical properties, were analyzed. The results show that both lofted dust layers and near-surface dust layers were characterized by extinction coefficients of 0.25–1.05 km−1 and high particle depolarization ratios (PDRs) of 0.25–0.40 at 527 nm wavelength. During the three campaigns, the frequencies of dust occurrence retrieved from the lidar observations were all higher than 88%, and the highest frequency was in April. The vertical distributions revealed that the maximum height of dust layers typically reached 7.8–9 km or higher. The high intensity of dust layers mostly occurred within the planetary boundary layer (PBL). The monthly averaged PDRs decreased from April to June, which implies a dust load reduction. A comparison of the relationship between the aerosol optical depth at 500 nm (AOD500) and the Angstrom exponent at 440–870 nm (AE440–870) confirms that there is a more complex mixture of dust aerosols with other types of aerosols when the effects of human activities become significant.

