

引言
大气环流异常是引发降水异常的重要因子。东亚冬季风环流系统的异常可造成我国冬季低温、冰冻等灾害天气[6,7,8],冬季风偏强(弱)对应降水多(寡)[9,10]。在低纬度地区,南支槽为我国南方地区降水提供水汽及扰动,对南方冬季降水有重要影响[11,12]。目前,针对低纬地区冬季暴雨研究较少,且集中于单次过程的诊断分析。研究表明,500 hPa“北脊南槽”的形势配合以及低层冷暖气流交汇对华南地区冬季强降水十分有利[13];地形可使中低层暖湿气流在迎风坡聚集,对暴雨具有增幅作用[14]。回顾以往相关研究,低纬地区冬季暴雨缺乏环流形势的系统分析,为此本文利用1951—2016年海南省国家气象站降水观测资料和NCEP再分析资料,分析海南岛冬季暴雨的时空特征,并选取两次典型的冬季极端降水过程,对比探讨海南岛冬季暴雨的环流形势及异常特征,以期为海南岛冬季暴雨预报及防灾减灾提供一定参考。
1 资料与方法
所用资料包括:1951—2016年海南岛逐日降水资料,考虑台站建站时间不同,挑选了18个国家气象观测站,站点分布均匀,有较好的代表性;1951—2016年NCEP逐6 h及逐日再分析资料(分辨率为2.5°×2.5°)(
根据气象业务部门的标准,将发生在12月至次年2月日降水量大于或等于50 mm的降水事件定义为冬季暴雨;冬季暴雨日定义为12月至次年2月期间海南岛18个气象站中某一日有一个或以上站点出现50 mm及以上降雨量,则这一日为全区暴雨日。
2 海南岛冬季暴雨的时空分布
从图1(a)看出,海南岛冬季暴雨发生概率较低,近66 a冬季暴雨发生日数平均在0.05~0.5 d之间,冬季最大暴雨日数在1~4 d之间,暴雨日数自西向东迅速递增,具有明显的区域性特征,东南部为高值区,平均暴雨日数和最大暴雨日数均出现在万宁地区(位于五指山山脉东南部的迎风坡)。近66 a海南岛冬季暴雨最大降水量也呈现自东向西逐渐减少的分布特征[图1(b)],150 mm以上的大暴雨位于海南岛东部的文昌、琼海、万宁和陵水,其中万宁冬季日最大降水量为187.7 mm。冬季,随着冷空气的南侵,海南岛常处于高压底部,受偏东气流影响;当风增强为急流时,偏东气流往往从海南岛东部的迎风坡辐合抬升,造成强降水天气,故而暴雨的落区和极值均位于东南部的迎风坡地区。
图1
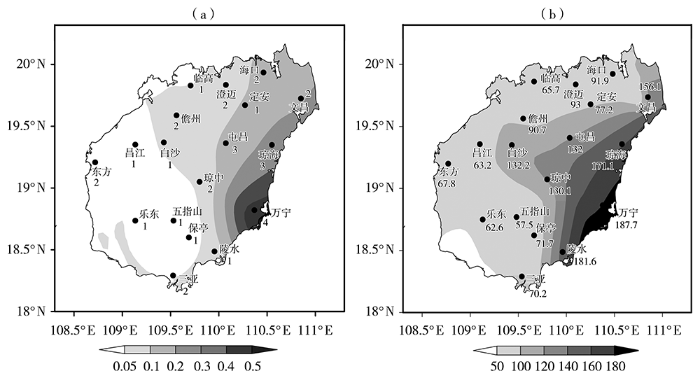
图1
1951—2016年海南岛冬季平均暴雨日数(a,单位:d)和日最大降水量(b,单位:mm)的空间分布
(数值分别表示各站冬季最大暴雨日数和日最大降水量)
Fig.1
The spatial distribution of average rainstorm days (a, Unit: d) and the daily maximum precipitation (b, Unit: mm) in winter from 1951 to 2016 in Hainan Island
(The number at each station represents the maximum rainstorm days and the daily maximum precipitation in winter, respectively)
1951—2016年,海南岛冬季共出现77个暴雨日,全岛冬季平均暴雨日仅为1.17 d,且冬季暴雨日存在明显的年际及年代际变化特征,各年份冬季暴雨日在0~6 d之间,多暴雨时段发生在21世纪,大多数年份冬季出现了暴雨,且多个年份暴雨日远高于多年平均值,在2013年出现峰值,而20世纪50年代和70年代中期至80年代中期为少暴雨时段(图2)。另外,2000年以来,共出现8次暴雨过程,有6次均发生在初冬的12月,且2次(2008年和2013年12月)为持续性暴雨过程,其中2013年12月14—17日的暴雨为历史同期最强的降水过程,给海南岛东南部万宁地区造成严重影响。
图2
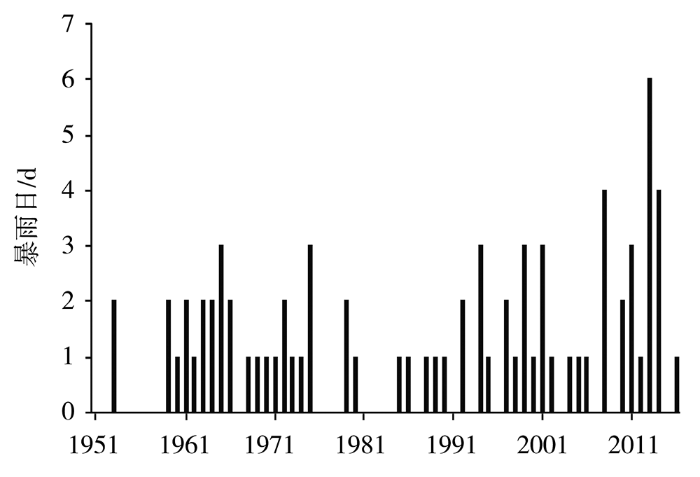
图2
1951—2016年海南岛冬季暴雨日年际变化
Fig.2
The inter-annual variation of rainstorm days in winter from 1951 to 2016 in Hainan Island
3 典型个例的环流形势及异常特征
3.1 典型个例降水特征
图3
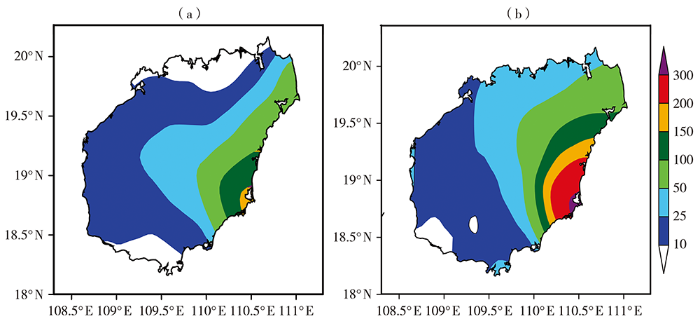
图3
海南岛2008年12月27—28日(a)和2013年12月14—15日(b) 暴雨过程的雨量空间分布(单位:mm)
Fig.3
The spatial distribution of precipitation during the rainstorm processes from 27 to 28 December 2008 (a) and 14 to 15 December 2013 (b) in Hainan Island (Unit: mm)
3.2 典型个例环流形势
3.2.1 500 hPa环流形势
图4
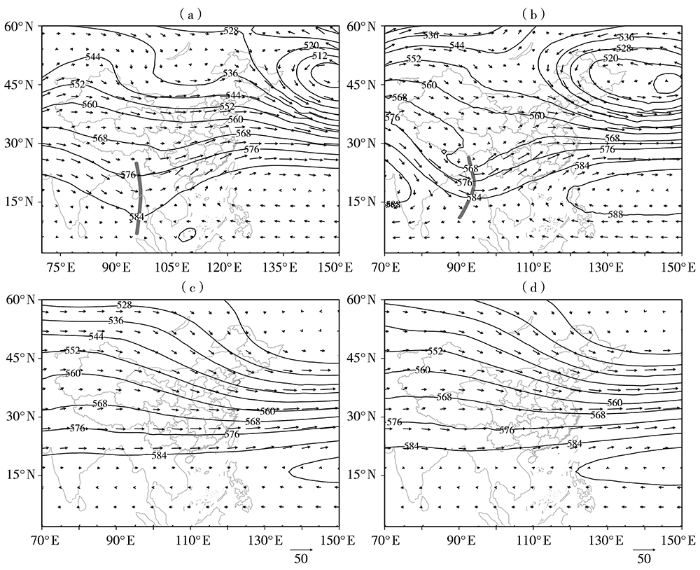
图4
2008年12月27日08:00至28日08:00(a)、2013年12月14日08:00至15日08:00(b)500 hPa平均位势高度(等值线,单位:dagpm)和风场(矢量,单位:m·s-1)以及1951—2016年12月第5候(c)和第3候(d)气候态平均
(粗线是南支槽)
Fig.4
The average geopotential height (contours, Unit: dagpm) and wind field (vectors, Unit: m·s-1) on 500 hPa from 08:00 BST 27 to 08:00 BST 28 December 2008 (a) and 08:00 BST 14 to 08:00 BST 15 December 2013 (b), and the climatic mean state in the 5th (c) and the 3rd (d) pentads of December from 1951 to 2016
(the thick line for the southern branch trough)
综上分析可见,发展强盛的南支槽在两次暴雨发展过程中起着至关重要的作用,在冷空气势力较弱的背景下,加强的南支槽前的西南暖湿气流为海南岛大范围暴雨提供有利背景。同时注意到,两次暴雨过程也存在差异,在2013年12月14—15日的暴雨过程中副高明显强于2008年12月27—28日的暴雨过程,强盛的副高一方面阻挡了南支槽东移的速度,导致南支槽在华南地区影响时间较长;另一方面,副高西侧的偏南气流加强了南海暖湿气流向海南地区的输送,有利于出现持续性大暴雨过程。
3.2.2 低空急流
图5
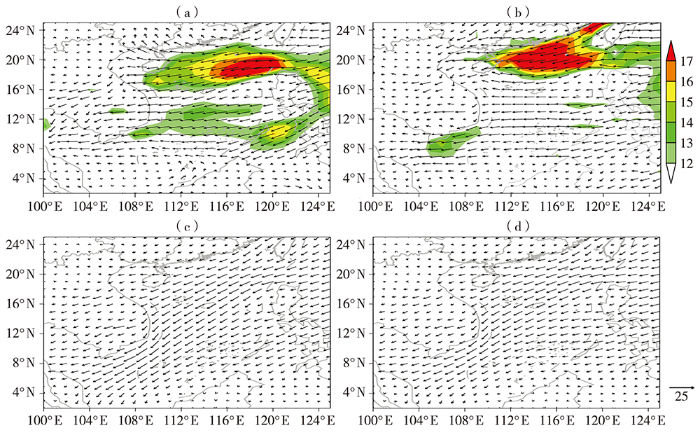
图5
2008年12月27日08:00(a)、2013年12月14日20:00(b)925 hPa风场(矢量,单位:m·s-1)及1951—2016年12月第5候(c)和第3候(d)气候态平均
(彩色阴影区为急流,其风速大于12 m·s-1)
Fig.5
The 925 hPa wind field (vectors, Unit: m·s-1) at 08:00 BST 27 December 2008 (a) and 20:00 BST 14 December 2013 (b) and the climatic mean state in the 5th (c) and the 3rd (d) pentads of December from 1951 to 2016
(the color shadow areas for jet streams with wind speed more than 12 m·s-1)
3.2.3 海平面气压场
图6
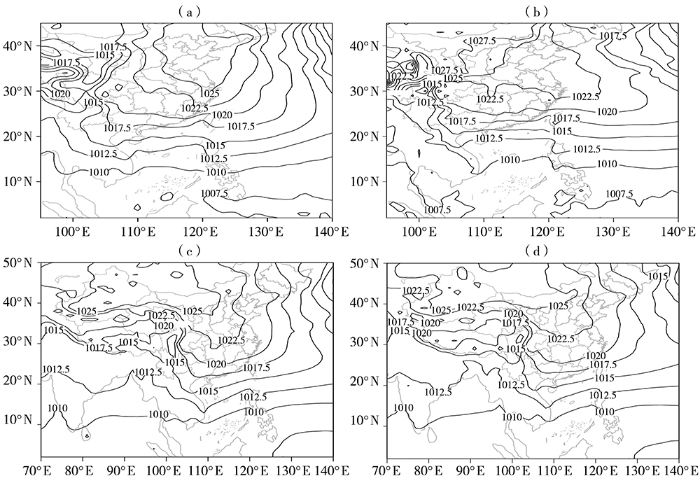
图6
2008年12月27日08:00(a)、2013年12月14日20:00(b)海平面气压(单位:hPa)及1951—2016年12月第5候(c)和第3候(d)气候态平均
Fig.6
Sea level pressure (Unit: hPa) at 08:00 BST 27 December 2008 (a) and 20:00 BST 14 December 2013 (b) and the climatic mean state in the 5th (c) and the 3rd (d) pentads of December from 1951 to 2016
3.3 典型个例的环流异常特征
3.3.1 500 hPa高度场及风场异常特征
大气环流异常是造成极端天气事件的最主要原因。图7是两次暴雨过程所在候平均500 hPa位势高度距平场。可以看出,两次暴雨过程中我国西南地区(南支槽所在位置)均表现为负距平,表明南支槽较常年同期偏强,且槽前的西南气流也偏强。然而,2008年暴雨过程中高纬地区西风槽所在位置为正距平,而2013年暴雨过程中负距平区位于30°N以北,说明强冷空气难以到达海南地区,这与海南地区受强盛的西南暖湿气流影响一致。另外,2013年暴雨过程中,我国西南地区的负距平更强,范围更大,向东一直延伸至华南地区,对应南支槽前扰动也更强。
图7
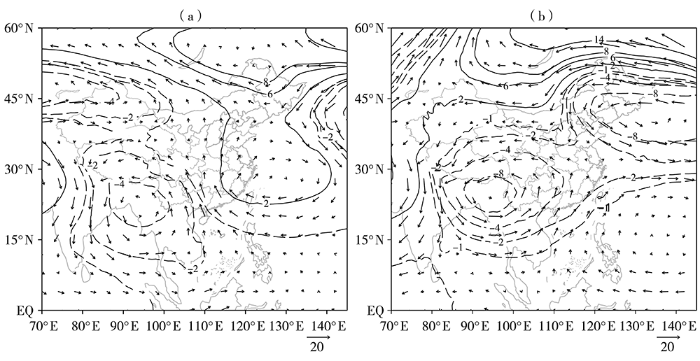
图7
2008年12月第5候(a)、2013年12月第3候(b)500 hPa平均位势高度(等值线,单位:dagpm)和风场(矢量,单位:m·s-1)距平
Fig.7
Anomalies of average geopotential height (contours, Unit: dagpm) and wind field (vectors, Unit: m·s-1) on 500 hPa in the 5th pentad of December 2008 (a) and the 3rd pentad of December 2013 (b)
3.3.2 850 hPa风场和水汽通量散度场异常特征
图8
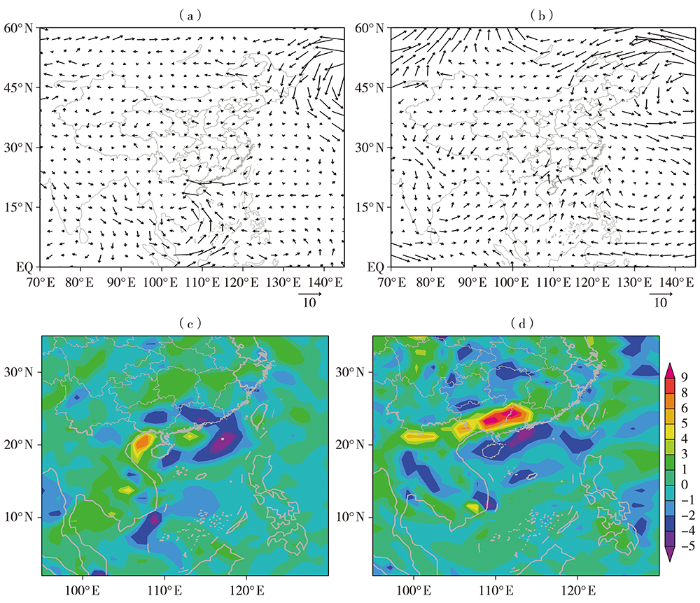
图8
2008年12月第5候(a、c)、2013年12月第3候(b、d)850 hPa平均风场(a、b,单位:m·s-1)和水汽通量散度(c、d,单位:10-7 g·hPa-1·cm-2·s-1)距平
Fig.8
Anomalies of average wind field (a, b, Unit: m·s-1) and moisture flux divergence (c, d, Unit: 10-7 g·hPa-1·cm-2·s-1) on 850 hPa in the 5th pentad of December 2008 (a, c) and the 3rd pentad of December 2013 (b, d)
综上可见,在冷空气势力较弱的背景下加强的南支槽使得暖湿气流在槽前辐合抬升,导致向南海输送的水汽异常偏强,为海南岛冬季暴雨的产生提供有利条件。
4 结论
(1)海南岛冬季暴雨具有明显的年际及年代际变化特征,2000年以来冬季暴雨出现频繁,暴雨多发生在初冬(12月)。
(2)海南岛冬季暴雨日数与极值具有一致的空间分布特征,均自西向东迅速递增,暴雨中心位于东南部的万宁地区。
(3)两次典型的冬季持续性暴雨过程中,海南岛均位于加强的南支槽前、入海冷高压底后部,低层有偏东急流建立并维持,冷空气势力弱,加强的暖湿空气在南支槽前辐合抬升产生暴雨。另外,当有较强的副热带高压配合时,暴雨发展更强。
(4)南支槽较常年偏强偏南,中低层异常偏强的西南风、槽前水汽通量散度负异常为海南冬季暴雨的产生提供了有利的动力和水汽条件。
