Journal of Arid Meteorology ›› 2026, Vol. 44 ›› Issue (3): 412-424.DOI: 10.11755/j.issn.1006-7639-2026-03-0412
• Articles • Previous Articles Next Articles
Analysis of the“8·26”extreme precipitation event in the Tuhai-Majia River Basin based on new observational data
GAO Leina1( ), ZHAI Liang2(), ZHANG Lin1, WANG Zhongshi1, HAN Yajing3, JIAO Yang4
- 1
Dezhou Meteorological Observatory Dezhou 253000, Shandong, China
2Beijing Municipal Meteorological Bureau Beijing 100089, China
3Binzhou Meteorological Bureau Binzhou 256600, Shandong, China
4Jinan Meteorological Bureau Jinan 250000, China
-
Received:2026-01-23Revised:2026-04-10Online:2026-06-30Published:2026-07-16
基于新型观测资料的徒骇-马颊河流域“8·26”极端降水过程分析
高雷娜1(), 翟亮2(), 张琳1, 王忠石1, 韩亚静3, 焦洋4
- 1
山东省德州市气象台 山东 德州 253000
2北京市气象局 北京 100089
3山东省滨州市气象局 山东 滨州 256600
4山东省济南市气象局 山东 济南 250000
-
通讯作者:翟亮 -
作者简介:高雷娜(1990—),女,工程师,主要从事短期天气预报研究。E-mail: 1059018568@qq.com。 -
基金资助:山东省气象局引导类项目(2025sdyd27);山东省气象局榜单类专项(2023sdbd15)

CLC Number:
Cite this article
GAO Leina, ZHAI Liang, ZHANG Lin, WANG Zhongshi, HAN Yajing, JIAO Yang. Analysis of the“8·26”extreme precipitation event in the Tuhai-Majia River Basin based on new observational data[J]. Journal of Arid Meteorology, 2026, 44(3): 412-424.
高雷娜, 翟亮, 张琳, 王忠石, 韩亚静, 焦洋. 基于新型观测资料的徒骇-马颊河流域“8·26”极端降水过程分析[J]. 干旱气象, 2026, 44(3): 412-424.
share this article
Add to citation manager EndNote|Ris|BibTeX
URL: http://www.ghqx.org.cn/EN/10.11755/j.issn.1006-7639-2026-03-0412
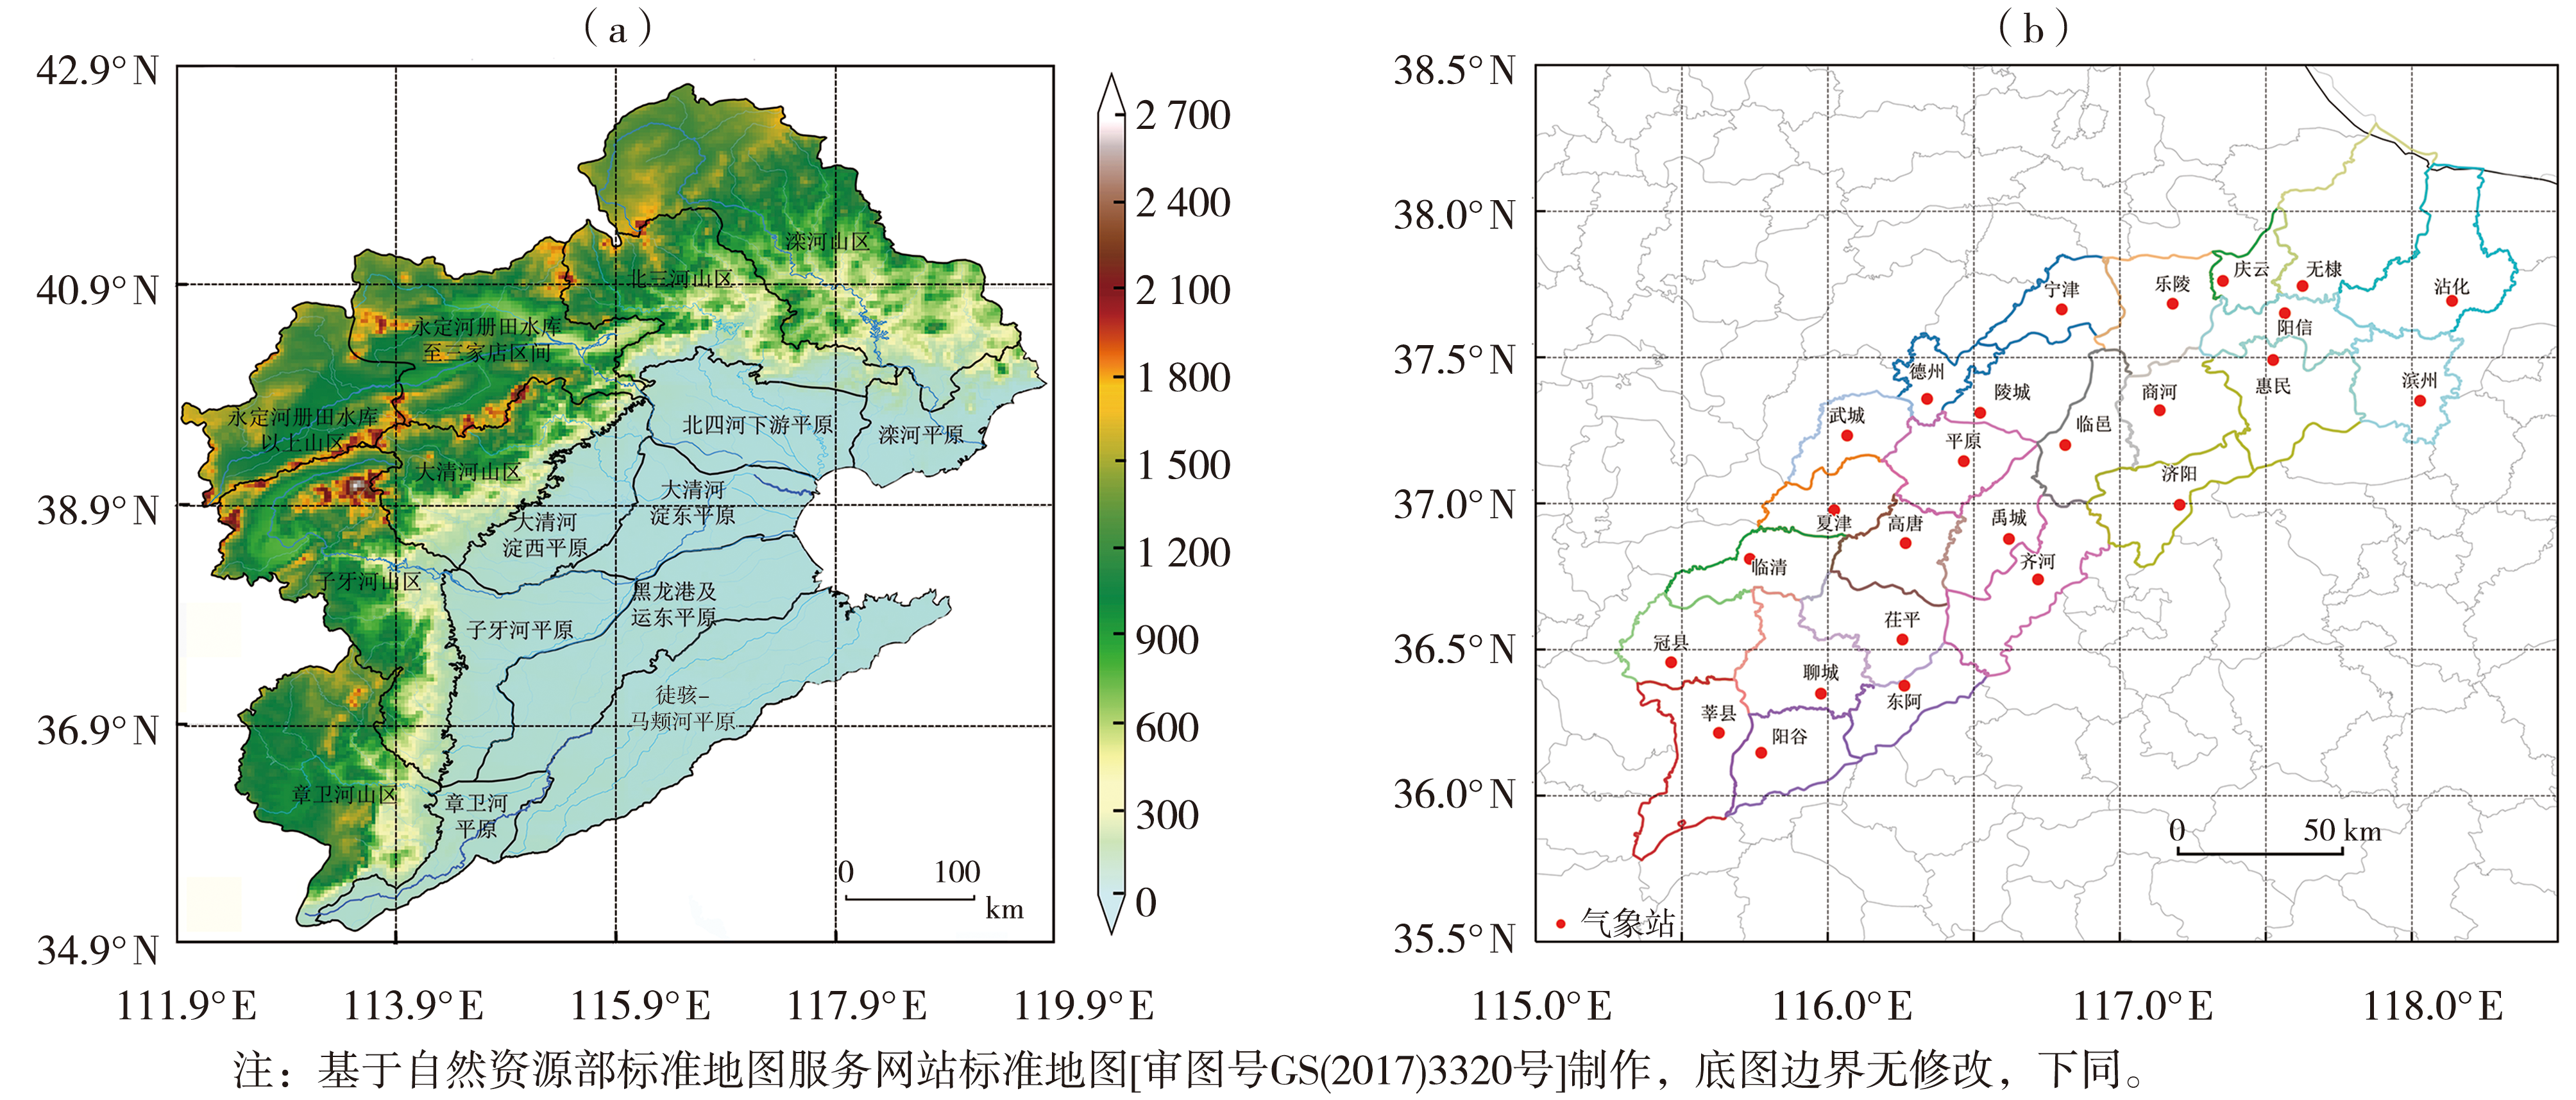
Fig.1 The topographic elevation (a, Unit: m) of the three-level basins of the Haihe River, and distribution of meteorological stations in the Tuhai-Majia River Basin (b)
Fig.1 The topographic elevation (a, Unit: m) of the three-level basins of the Haihe River, and distribution of meteorological stations in the Tuhai-Majia River Basin (b)

Fig.2 The spatial distribution of accumulated precipitation (a) and maximum hourly precipitation (b) (Unit: mm) in the Tuhai-Majia River Basin, and hourly variation of precipitation at representative national stations (c) and automatic stations (d) on 26 August 2024
Fig.2 The spatial distribution of accumulated precipitation (a) and maximum hourly precipitation (b) (Unit: mm) in the Tuhai-Majia River Basin, and hourly variation of precipitation at representative national stations (c) and automatic stations (d) on 26 August 2024
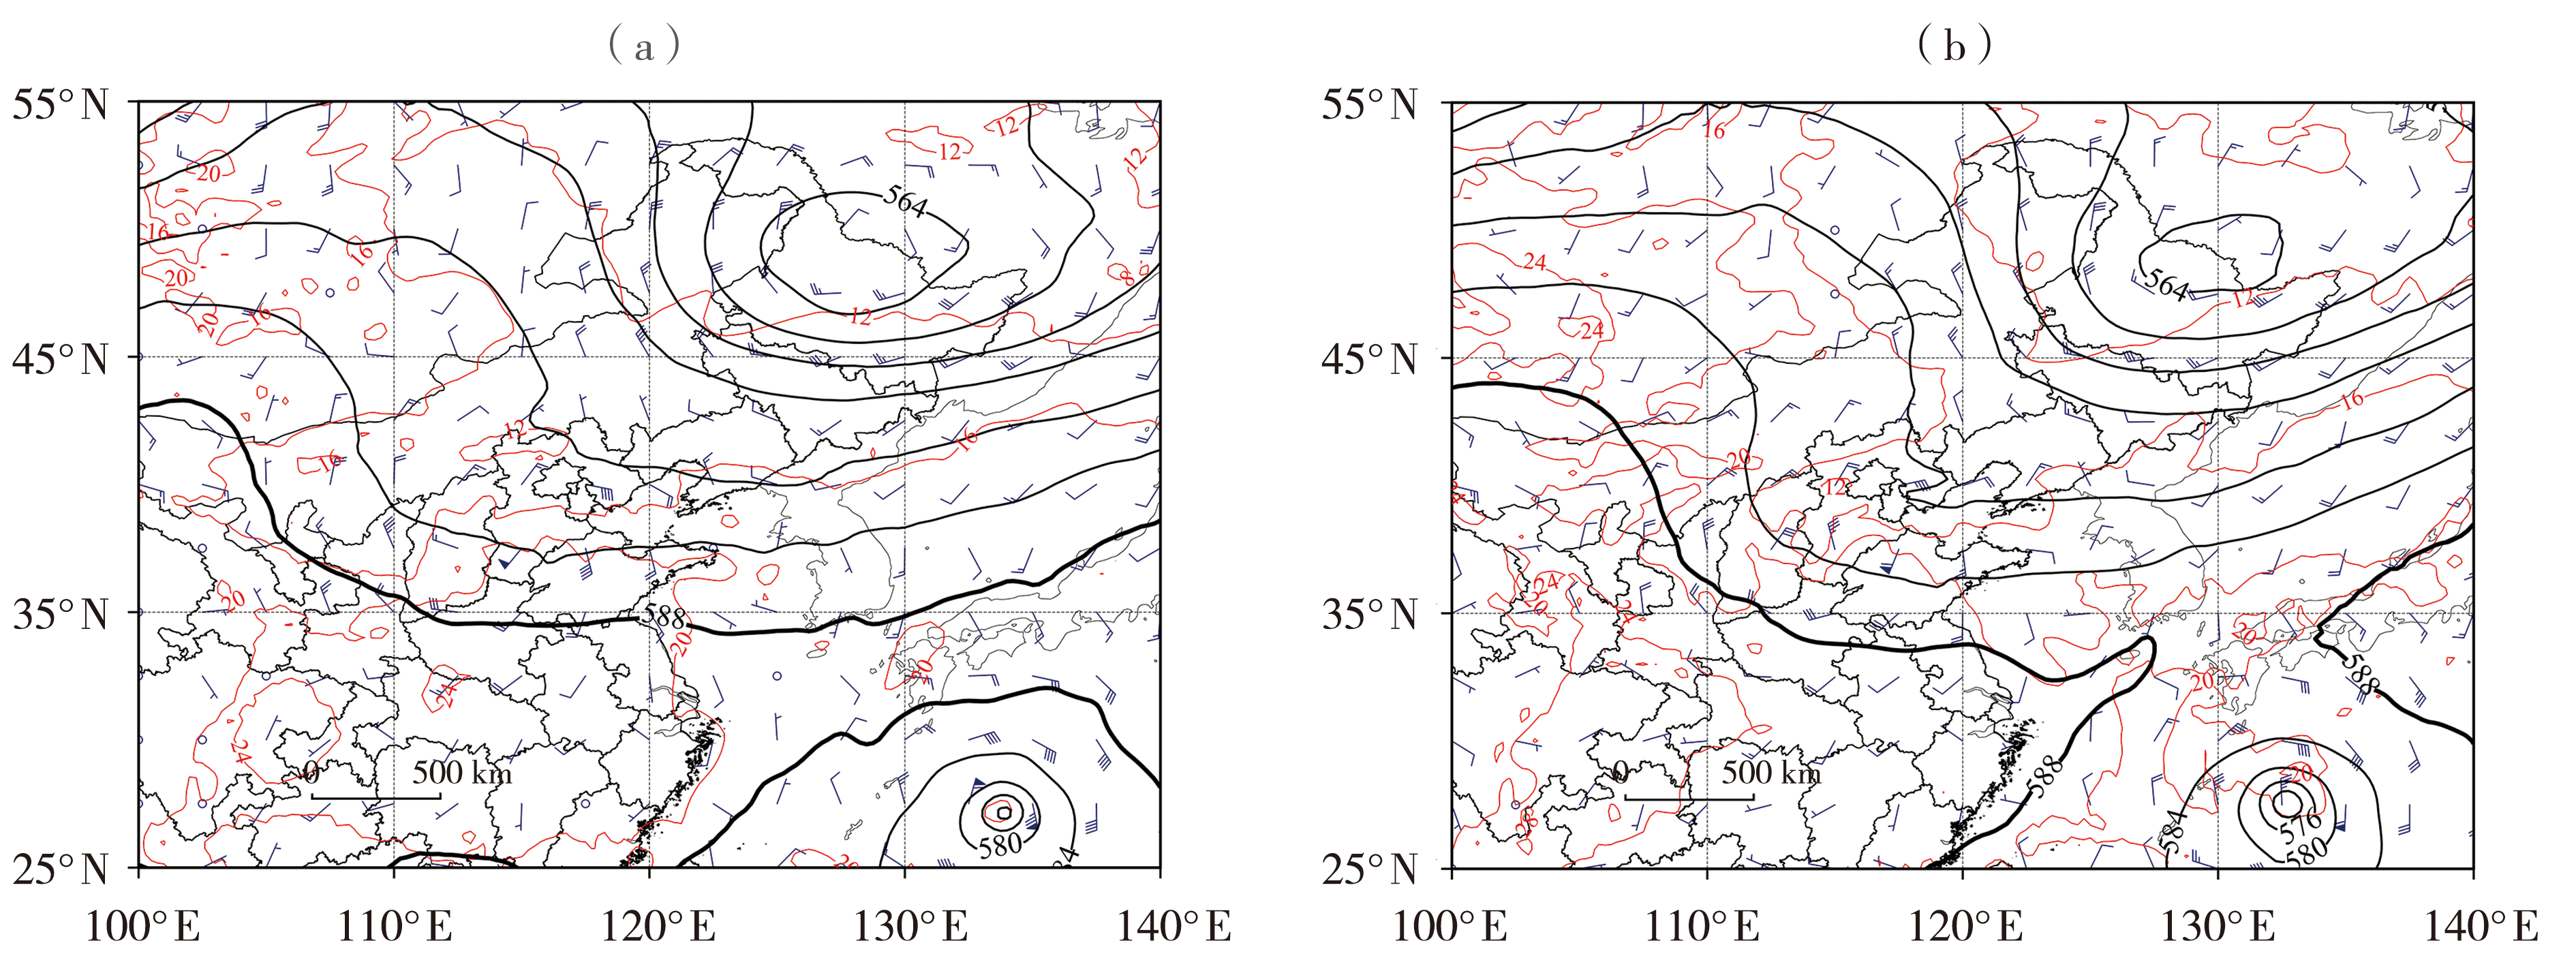
Fig.3 Superimposed plots of 500 hPa geopotential height (black contours, with a value interval of 4, Unit: dagpm), 850 hPa temperature (red isolines, with a value interval of 4, Unit: ℃), and wind field (blue wind vectors, Unit: m·s-1) at 08:00 (a) and 14:00 (b) on 26 August 2024
Fig.3 Superimposed plots of 500 hPa geopotential height (black contours, with a value interval of 4, Unit: dagpm), 850 hPa temperature (red isolines, with a value interval of 4, Unit: ℃), and wind field (blue wind vectors, Unit: m·s-1) at 08:00 (a) and 14:00 (b) on 26 August 2024
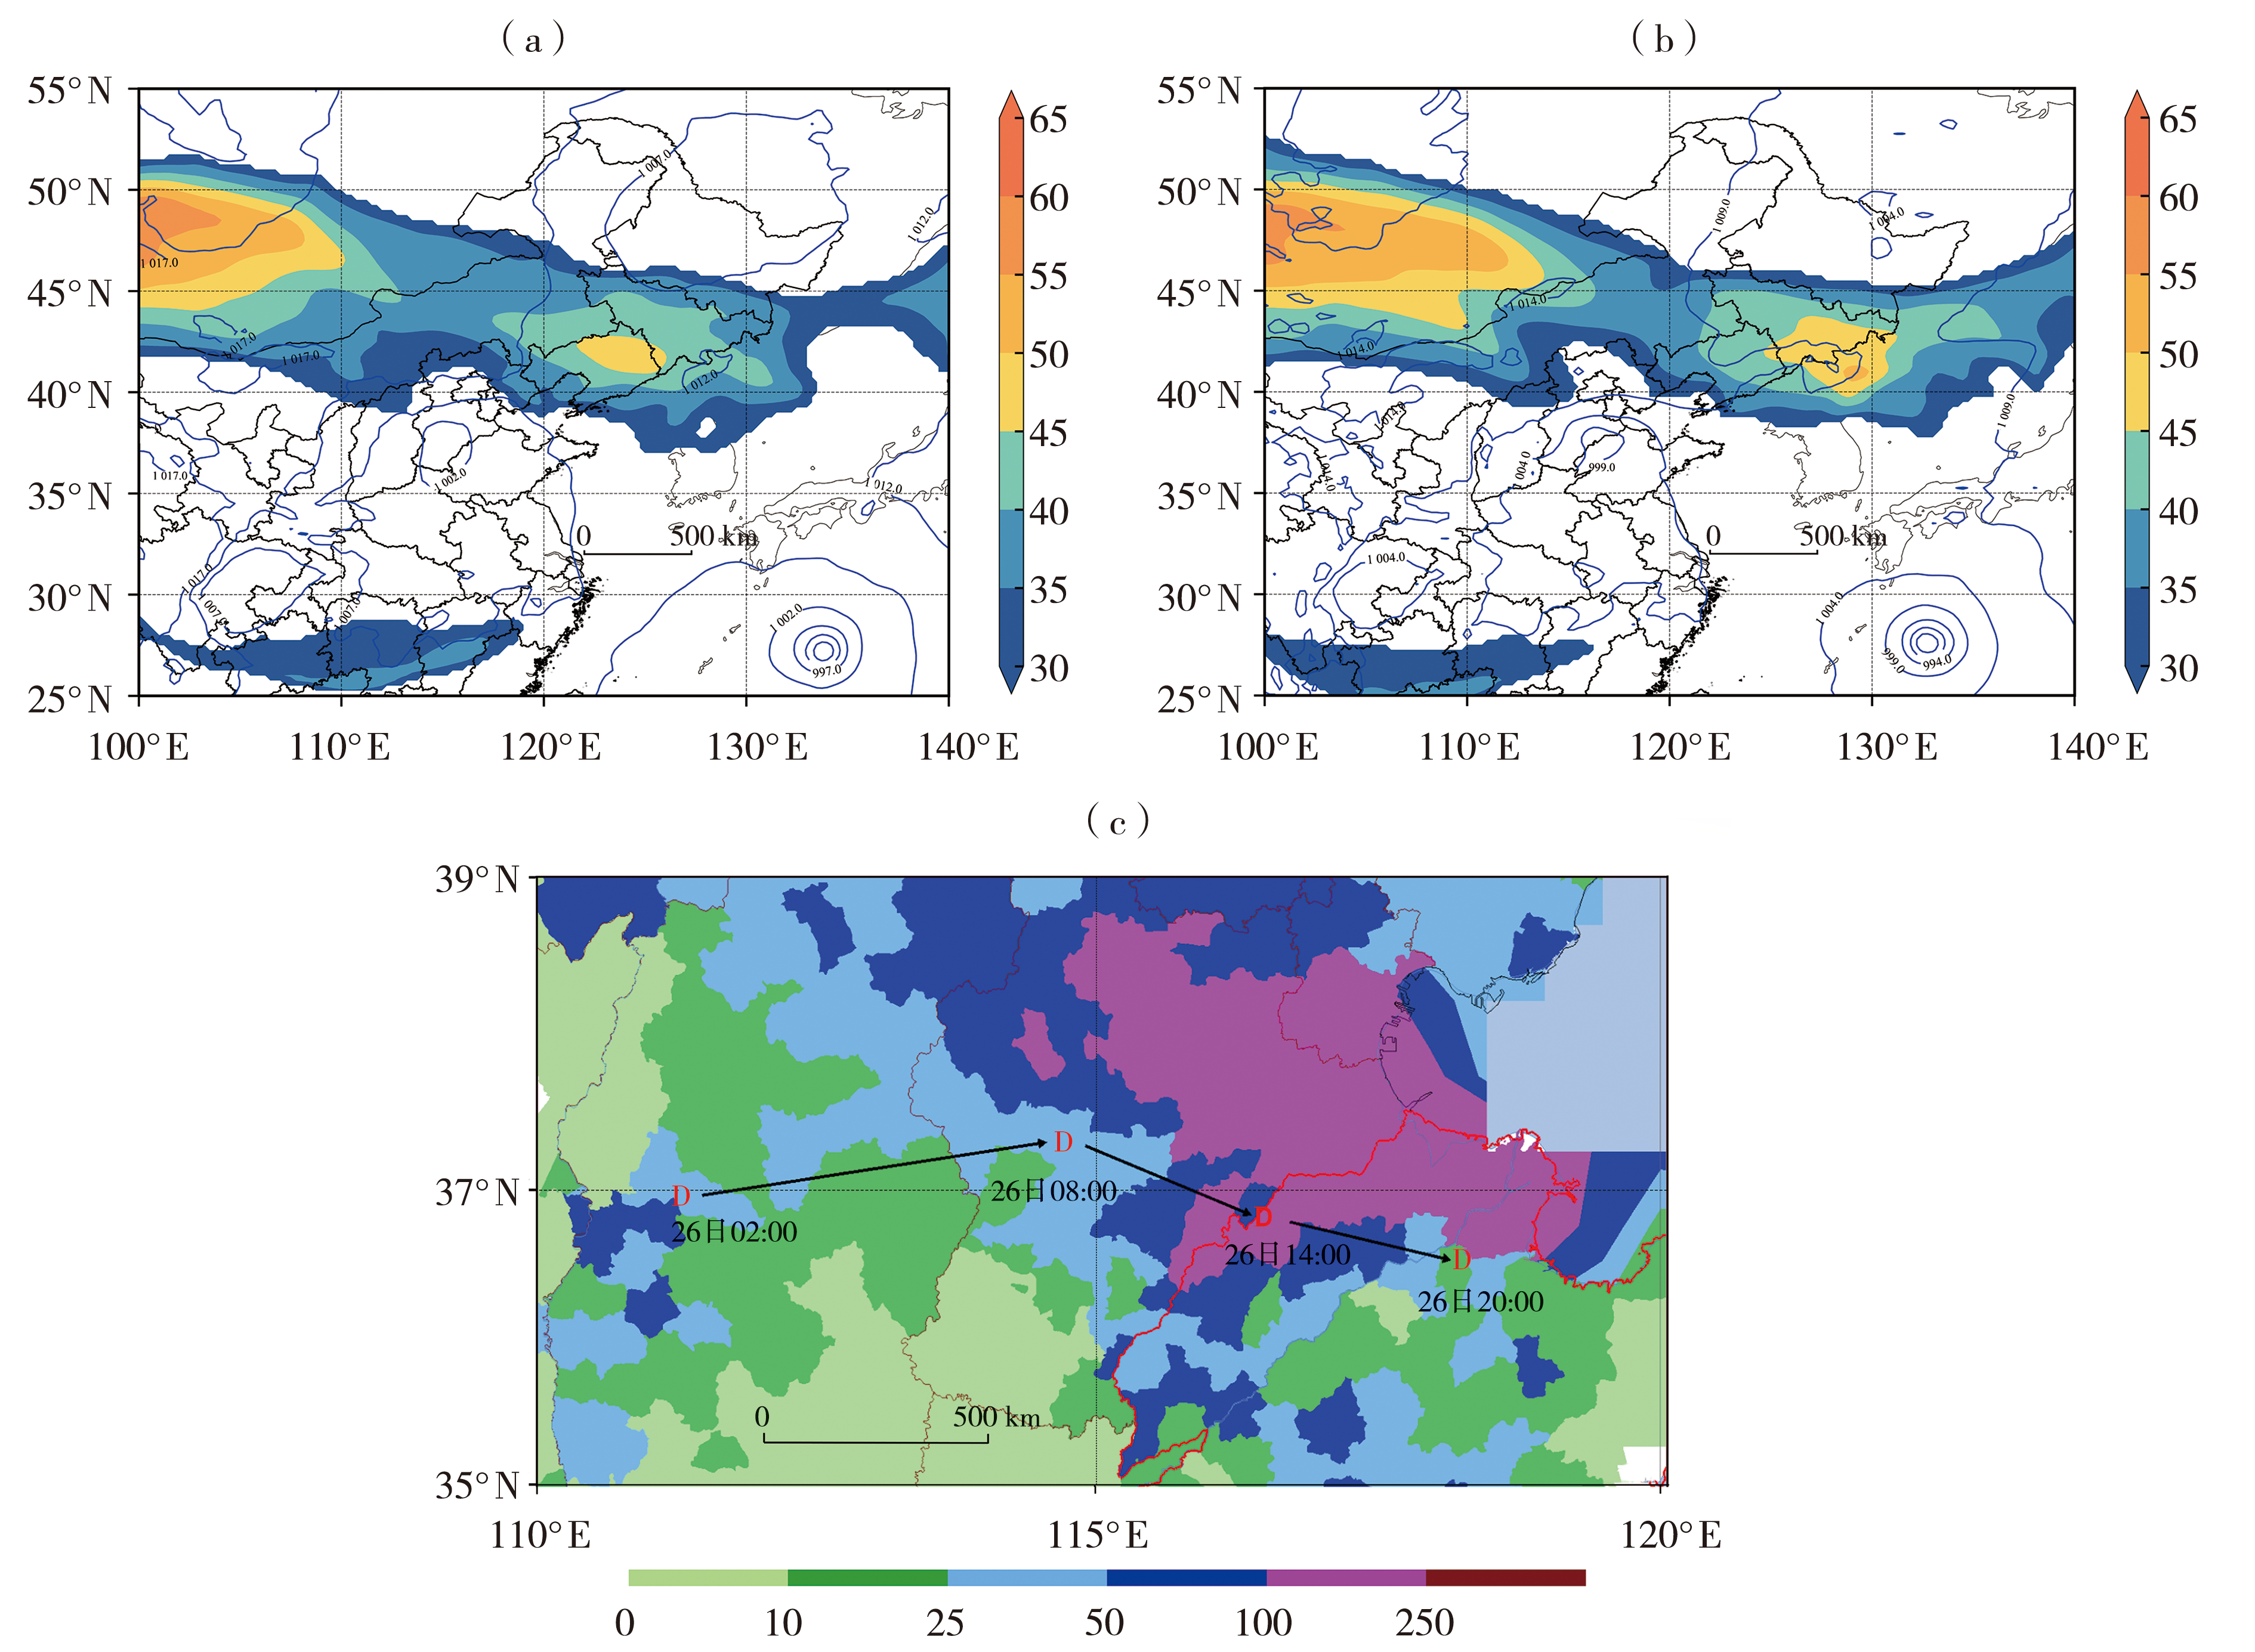
Fig.4 Superimposed plots of surface pressure field (blue lines, the interval is 5.0, Unit: hPa) and 200 hPa wind field (the color shaded, Unit: m·s-1) at 08:00 (a) and 14:00 (b), and the cyclone moving track (c) on 26 August 2024 (The red letter D indicates the low vortex center, the black arrows represent the moving track, the color shaded depicts the 24-hour accumulated precipitation at 20:00 on 26 August, Unit: mm)
Fig.4 Superimposed plots of surface pressure field (blue lines, the interval is 5.0, Unit: hPa) and 200 hPa wind field (the color shaded, Unit: m·s-1) at 08:00 (a) and 14:00 (b), and the cyclone moving track (c) on 26 August 2024 (The red letter D indicates the low vortex center, the black arrows represent the moving track, the color shaded depicts the 24-hour accumulated precipitation at 20:00 on 26 August, Unit: mm)
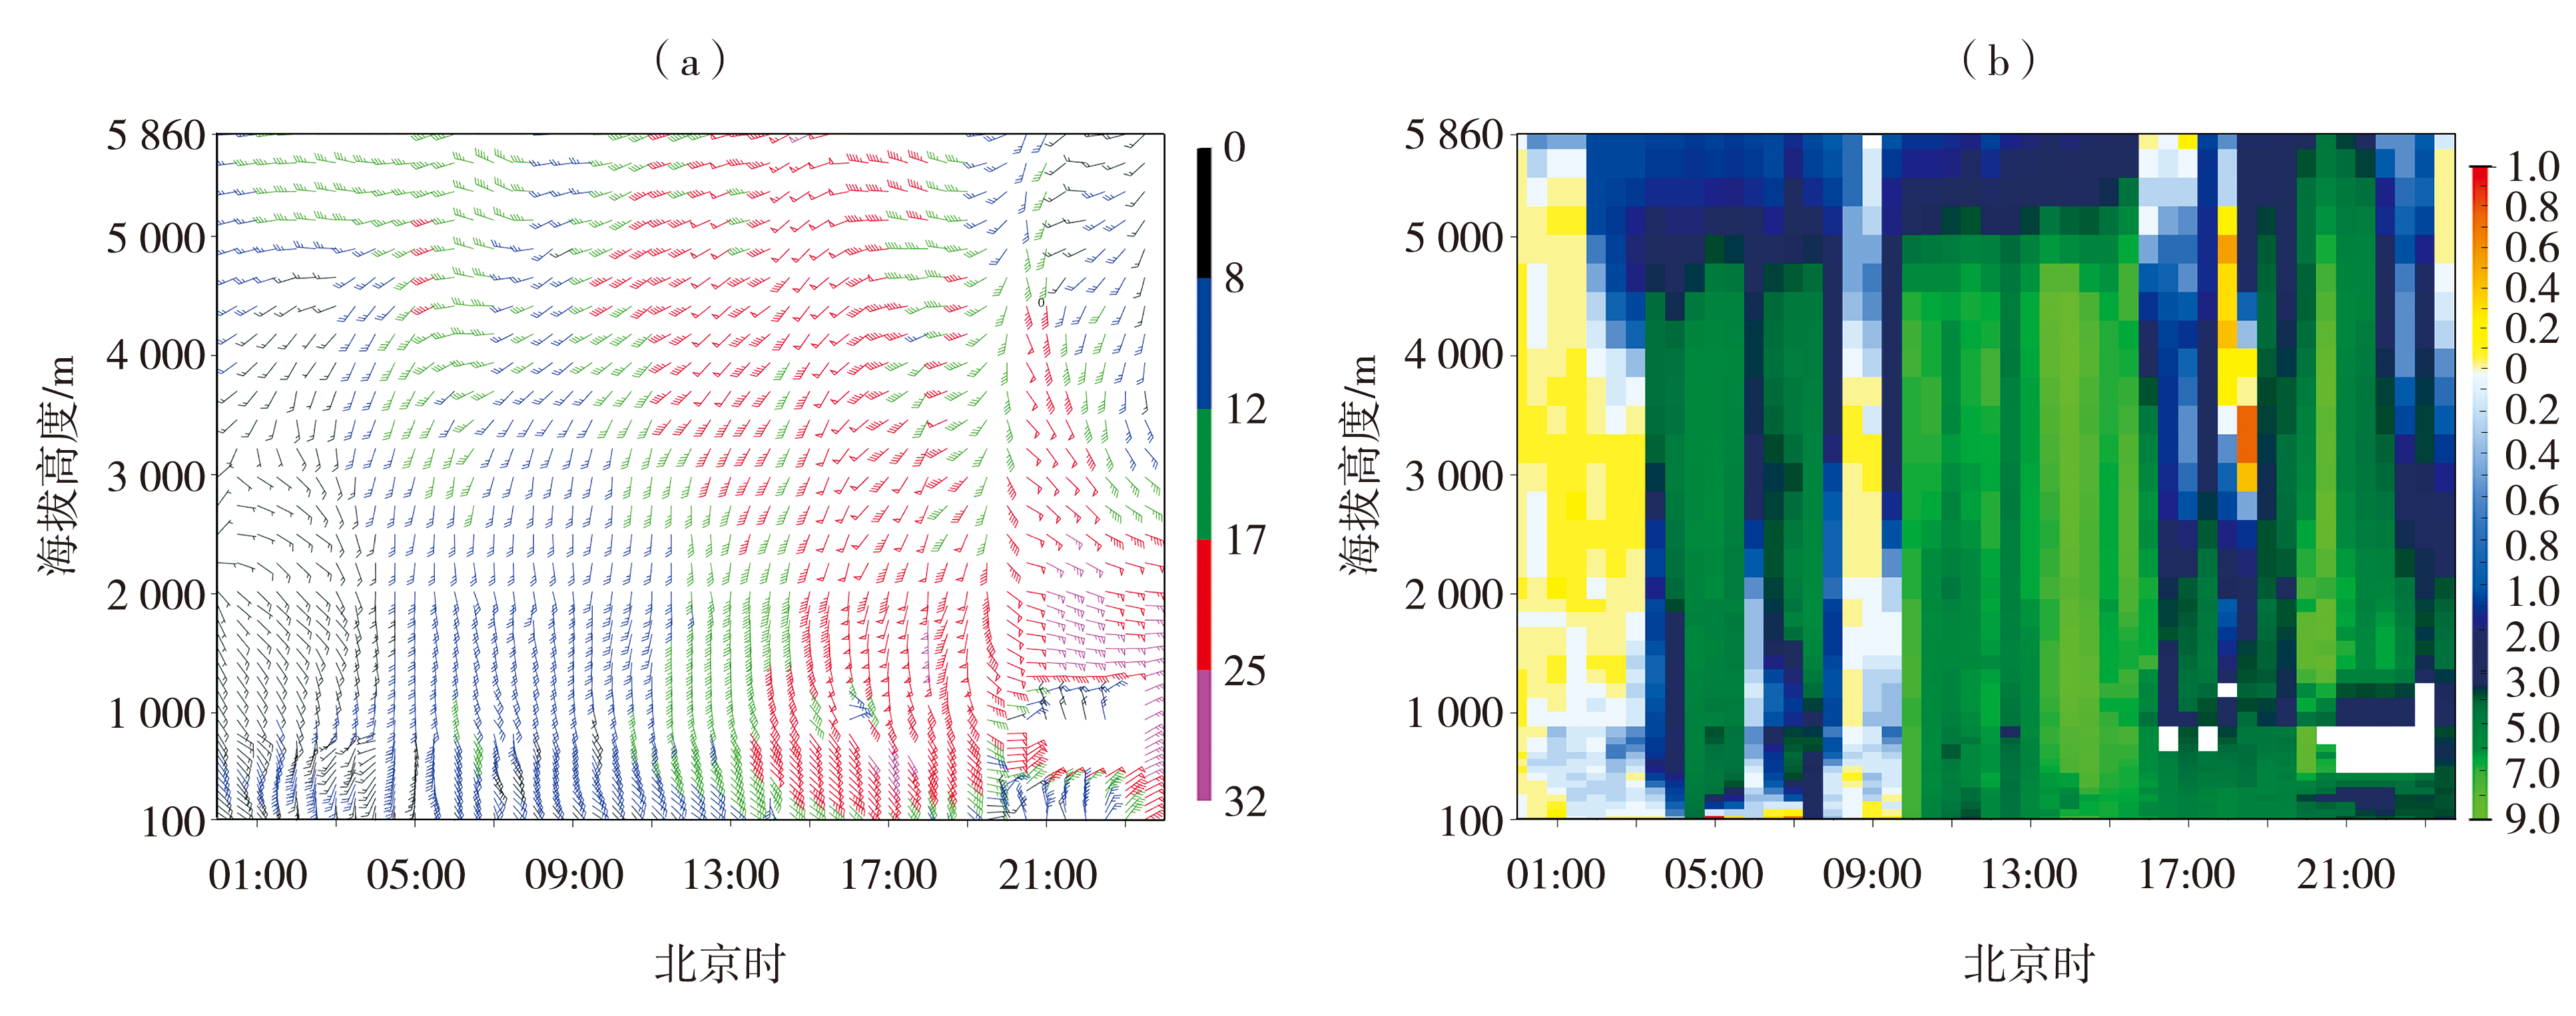
Fig.5 Temporal variations of the horizontal wind field (a, Unit: m·s-1) and the retrieved vertical velocity (b, Unit: m·s-1) from the Dongying wind profiler radar on 26 August 2024
Fig.5 Temporal variations of the horizontal wind field (a, Unit: m·s-1) and the retrieved vertical velocity (b, Unit: m·s-1) from the Dongying wind profiler radar on 26 August 2024
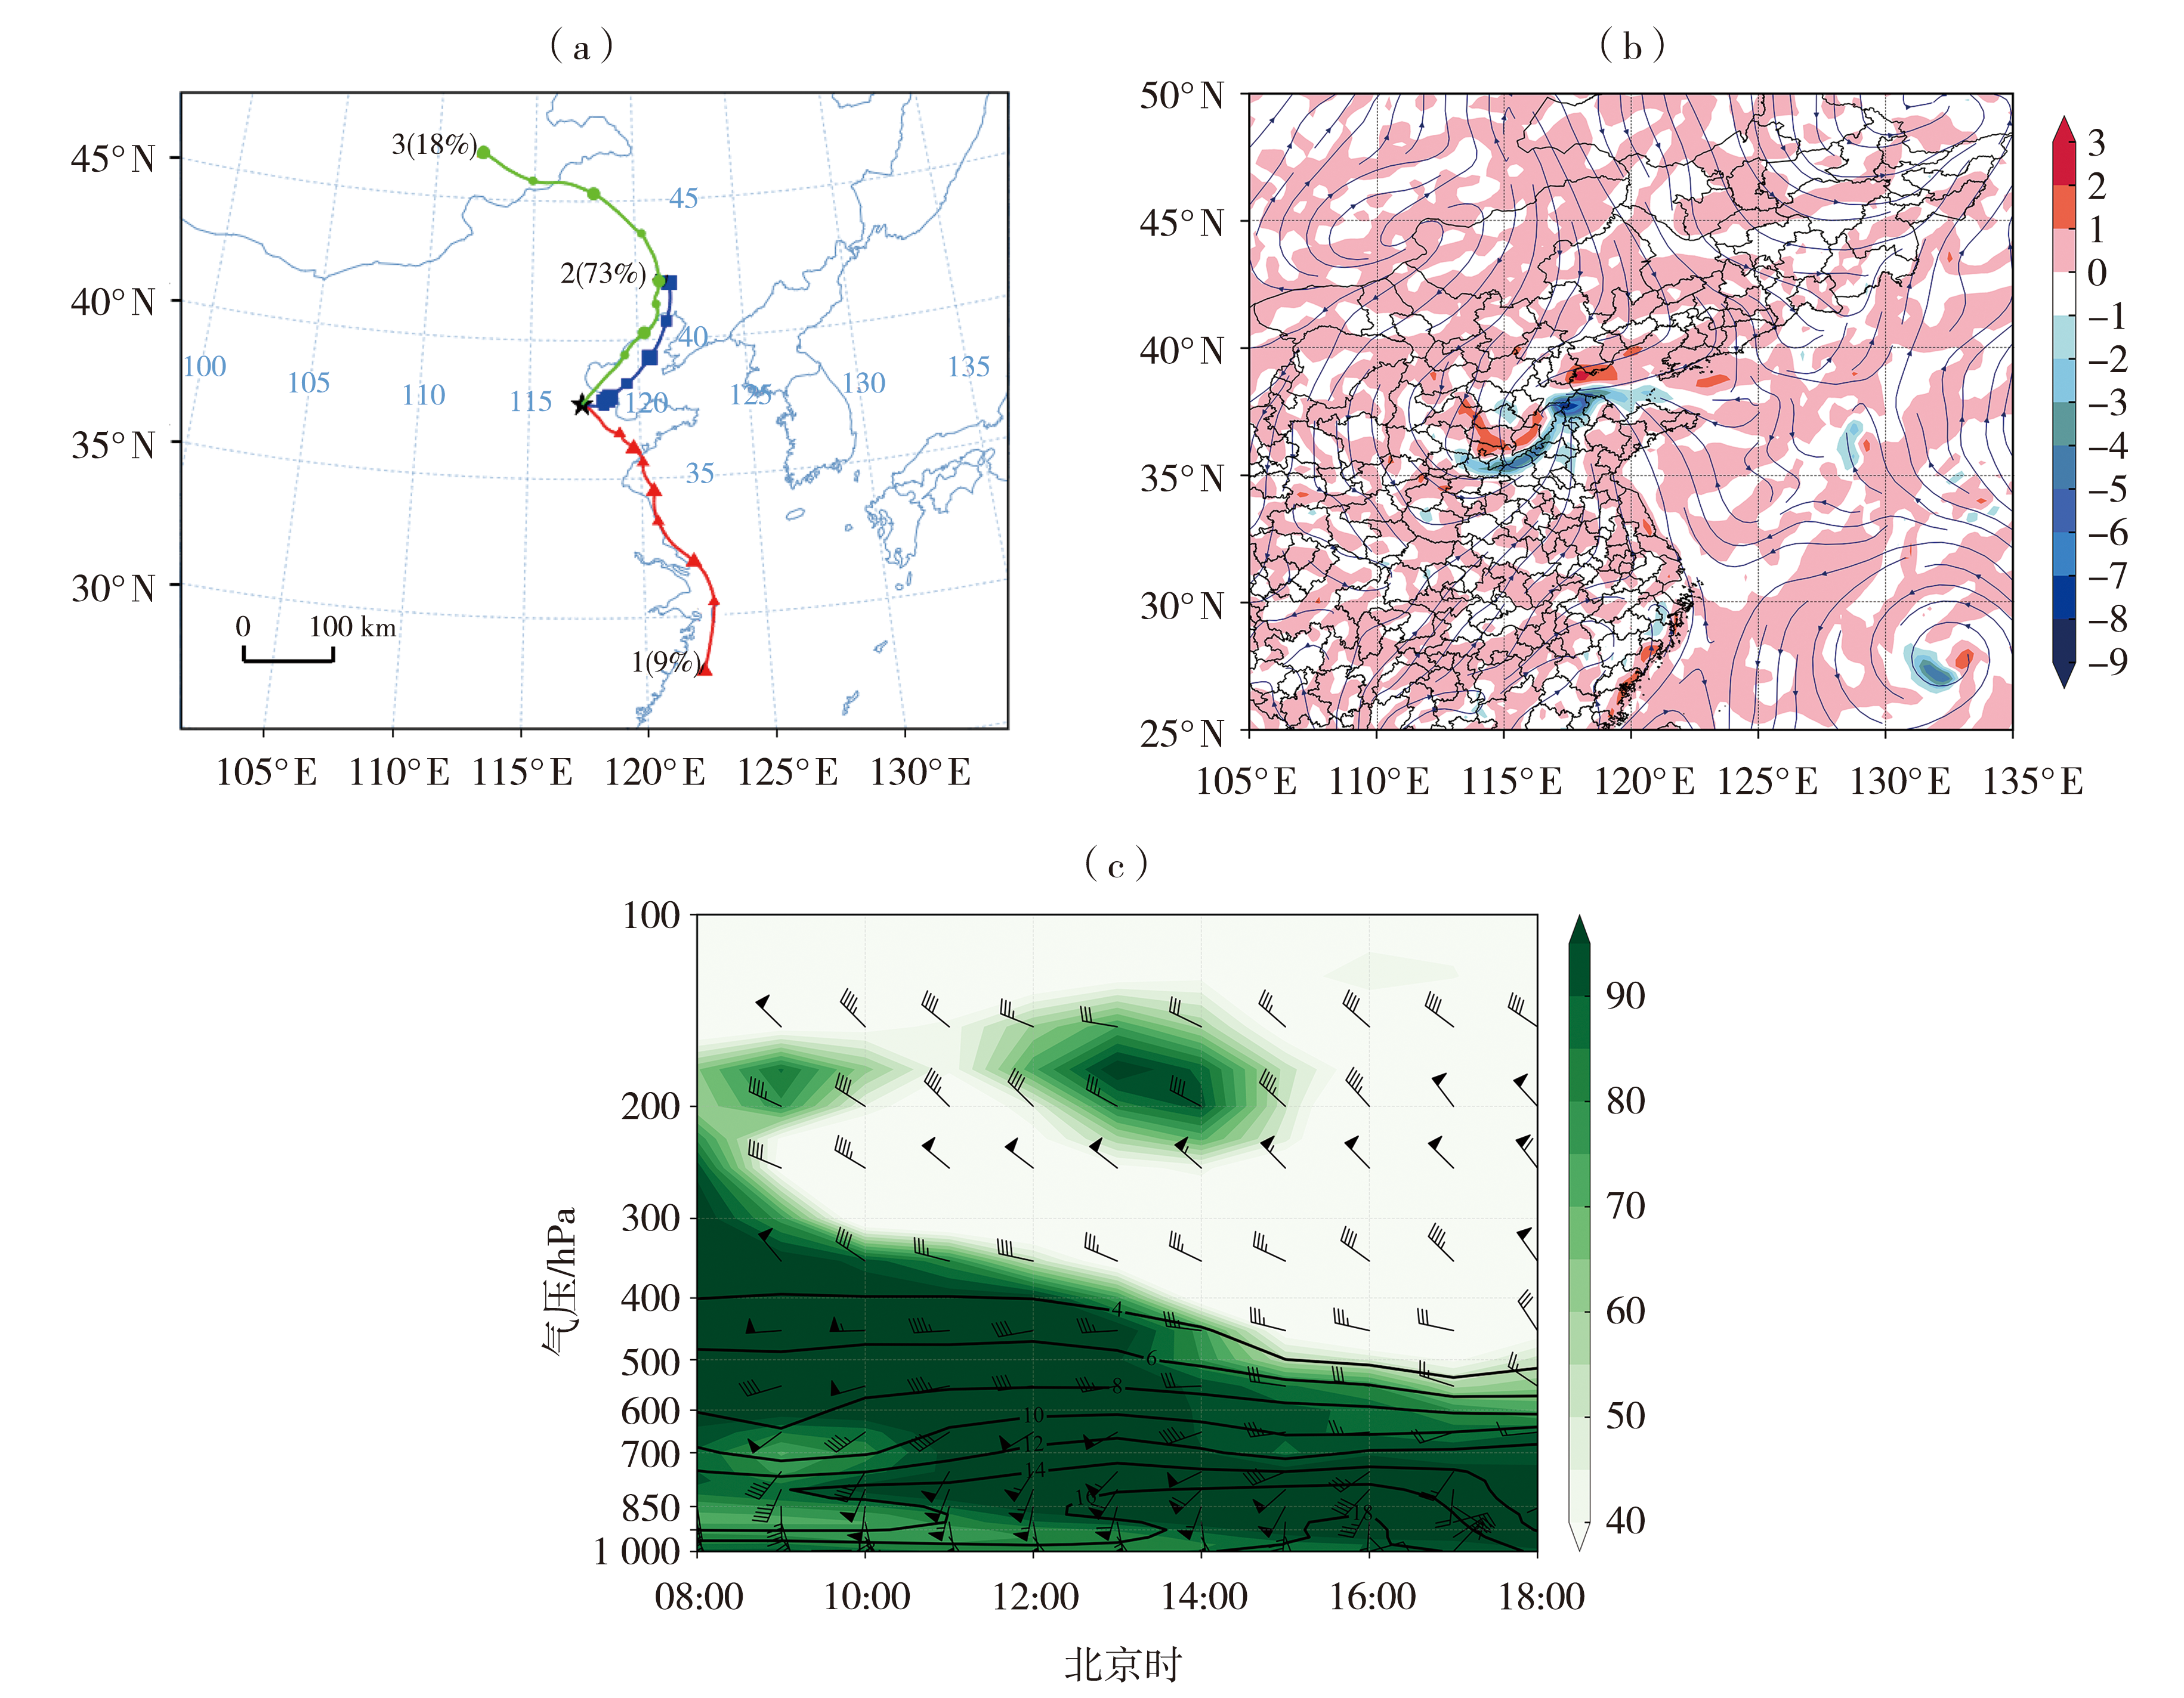
Fig.6 Simulated trajectory clustering on 26 August 2024 (a, green, blue, and red lines for trajectory lines), streamlines (blue lines) and water vapor flux divergence (the color shaded, Unit: kg·m-2·hPa-1·s-1) at 925 hPa at 16:00 on 26 August (b), and the time-height section of wind field (wind vectors, Unit: m·s-1), relative humidity (the color shaded, Unit: %) and specific humidity (black lines, Unit: g·kg-1) at Qingyun Station
Fig.6 Simulated trajectory clustering on 26 August 2024 (a, green, blue, and red lines for trajectory lines), streamlines (blue lines) and water vapor flux divergence (the color shaded, Unit: kg·m-2·hPa-1·s-1) at 925 hPa at 16:00 on 26 August (b), and the time-height section of wind field (wind vectors, Unit: m·s-1), relative humidity (the color shaded, Unit: %) and specific humidity (black lines, Unit: g·kg-1) at Qingyun Station

Fig.7 The reflectivity factor (Unit: dBZ) from the Jinan dual-polarization radar at 08:28 (a) and 08:45 (b) on 26 August 2024, and the vertical cross sections of reflectivity factor (c, Unit: dBZ), ZDR (d, Unit: dB), and KDP (e, Unit: (°)·km-1) along the AB line (the hook echo) at 08:45 on 26 August 2024
Fig.7 The reflectivity factor (Unit: dBZ) from the Jinan dual-polarization radar at 08:28 (a) and 08:45 (b) on 26 August 2024, and the vertical cross sections of reflectivity factor (c, Unit: dBZ), ZDR (d, Unit: dB), and KDP (e, Unit: (°)·km-1) along the AB line (the hook echo) at 08:45 on 26 August 2024
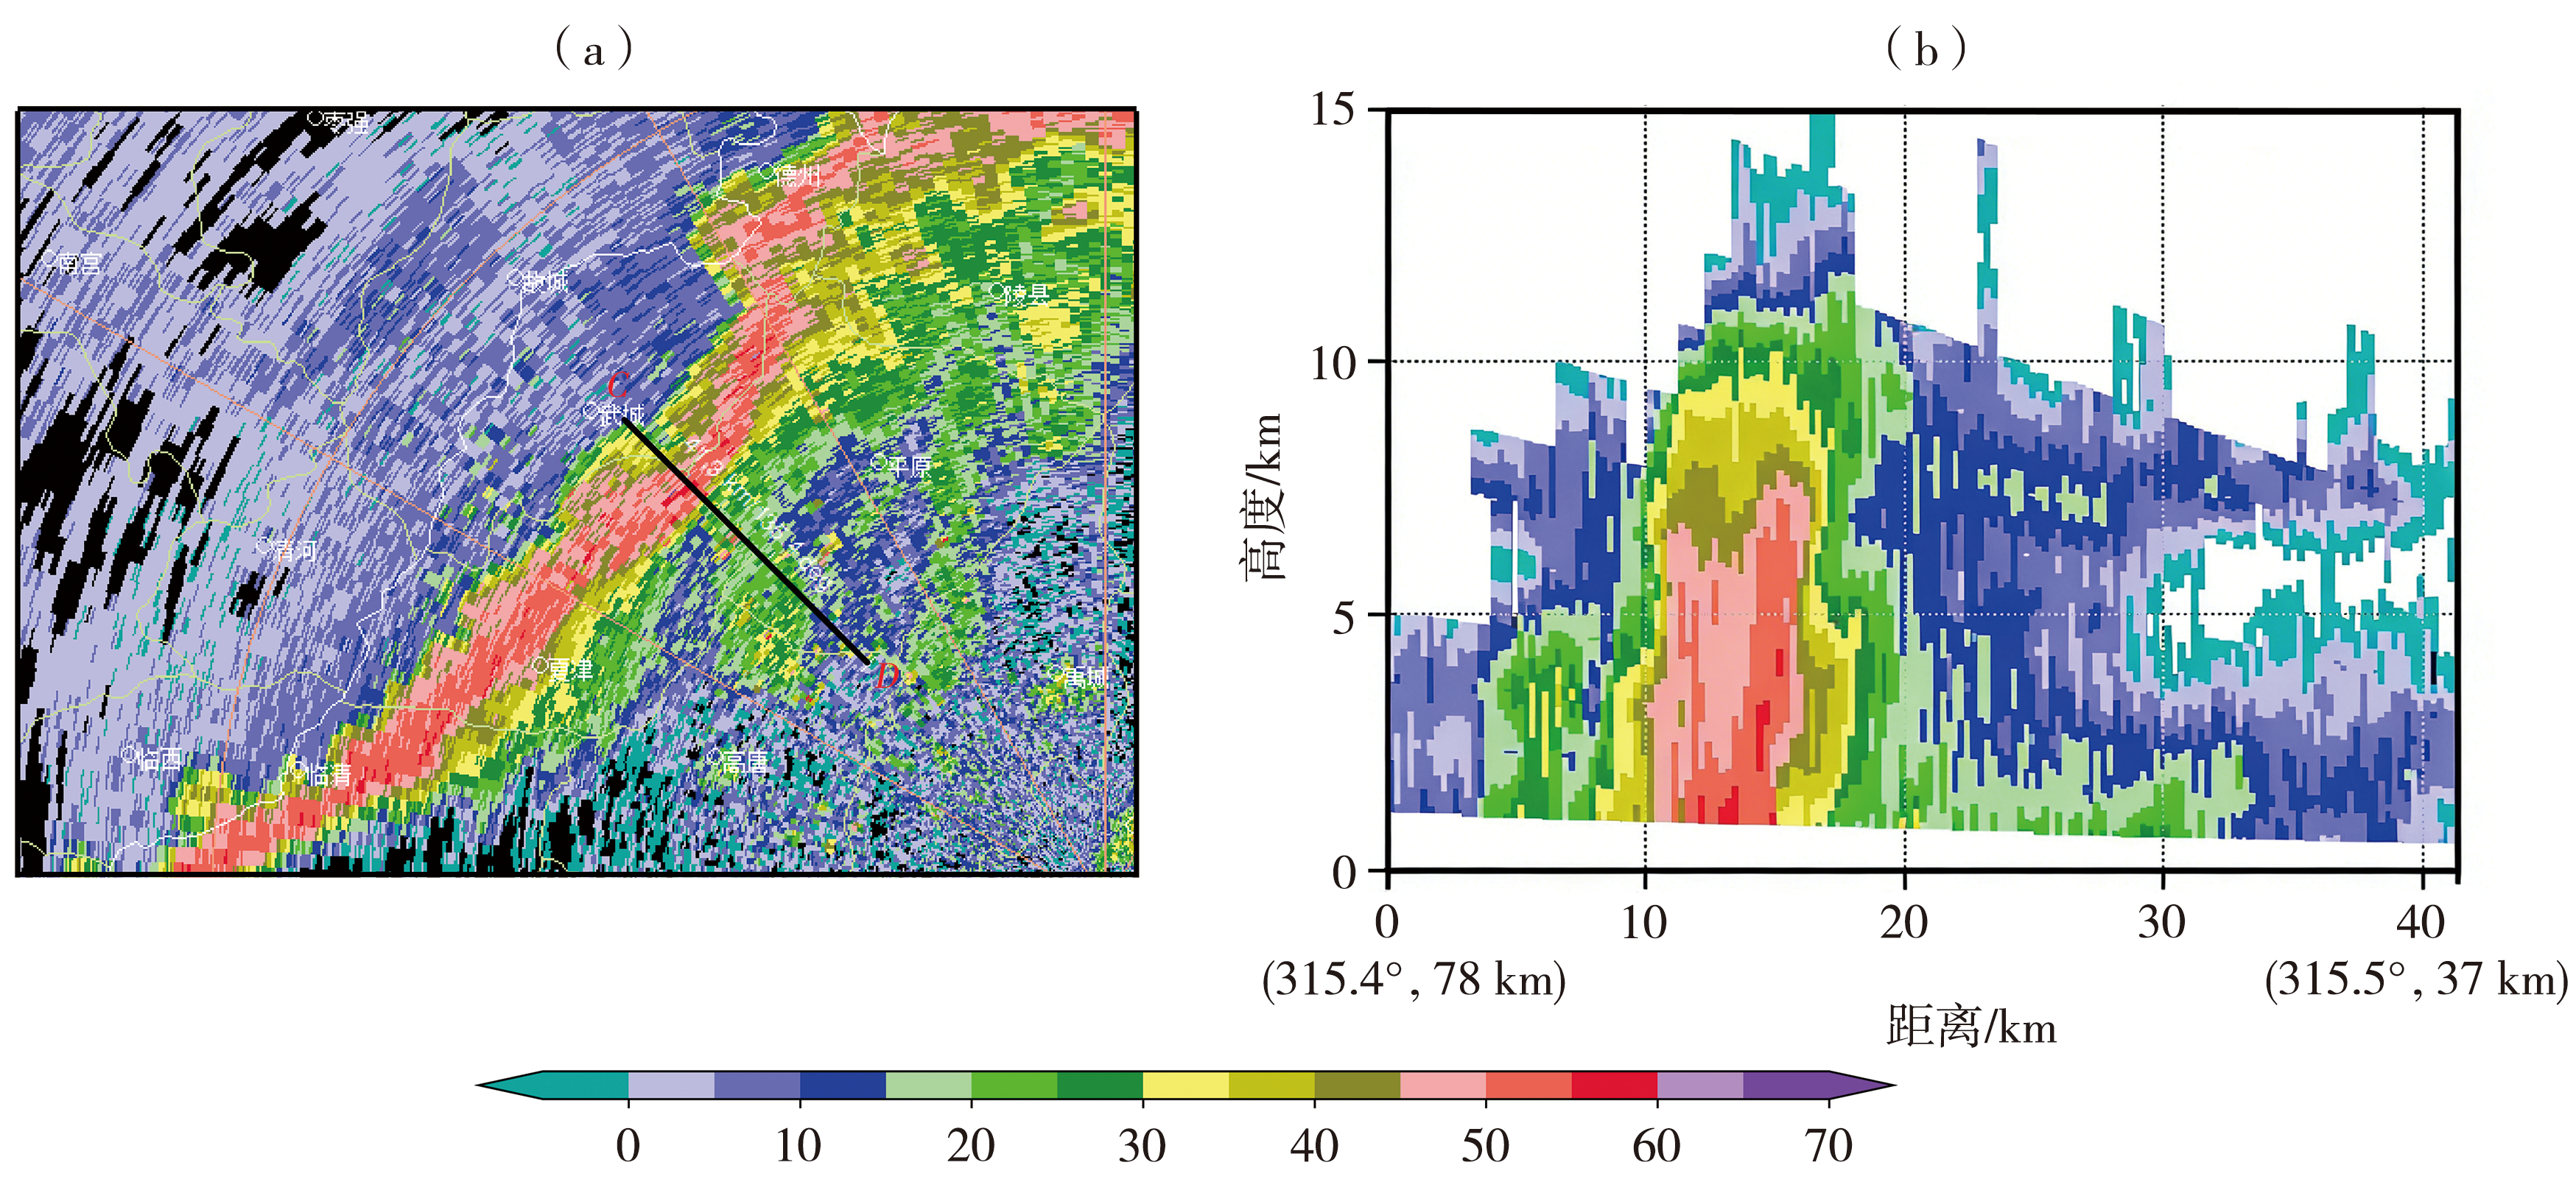
Fig.8 The reflectivity factor (a) from the Jinan dual-polarization radar and its vertical cross section along the CD line (corresponding to the strongest echo for the cold-front precipitation) (b) at 12:15 on 26 August 2024 (Unit: dBZ)
Fig.8 The reflectivity factor (a) from the Jinan dual-polarization radar and its vertical cross section along the CD line (corresponding to the strongest echo for the cold-front precipitation) (b) at 12:15 on 26 August 2024 (Unit: dBZ)

Fig.9 Composite reflectivity factor (Unit: dBZ) from the Binzhou dual-polarization radar at 13:37 (a) and 15:00 (b) on 26 August 2024, and vertical cross sections of reflectivity factor (c, Unit: dBZ) and KDP (d, Unit: (°)·km-1) along the EF line (corresponding to the cold-front precipitation) at 13:37 on 26 August 2024
Fig.9 Composite reflectivity factor (Unit: dBZ) from the Binzhou dual-polarization radar at 13:37 (a) and 15:00 (b) on 26 August 2024, and vertical cross sections of reflectivity factor (c, Unit: dBZ) and KDP (d, Unit: (°)·km-1) along the EF line (corresponding to the cold-front precipitation) at 13:37 on 26 August 2024
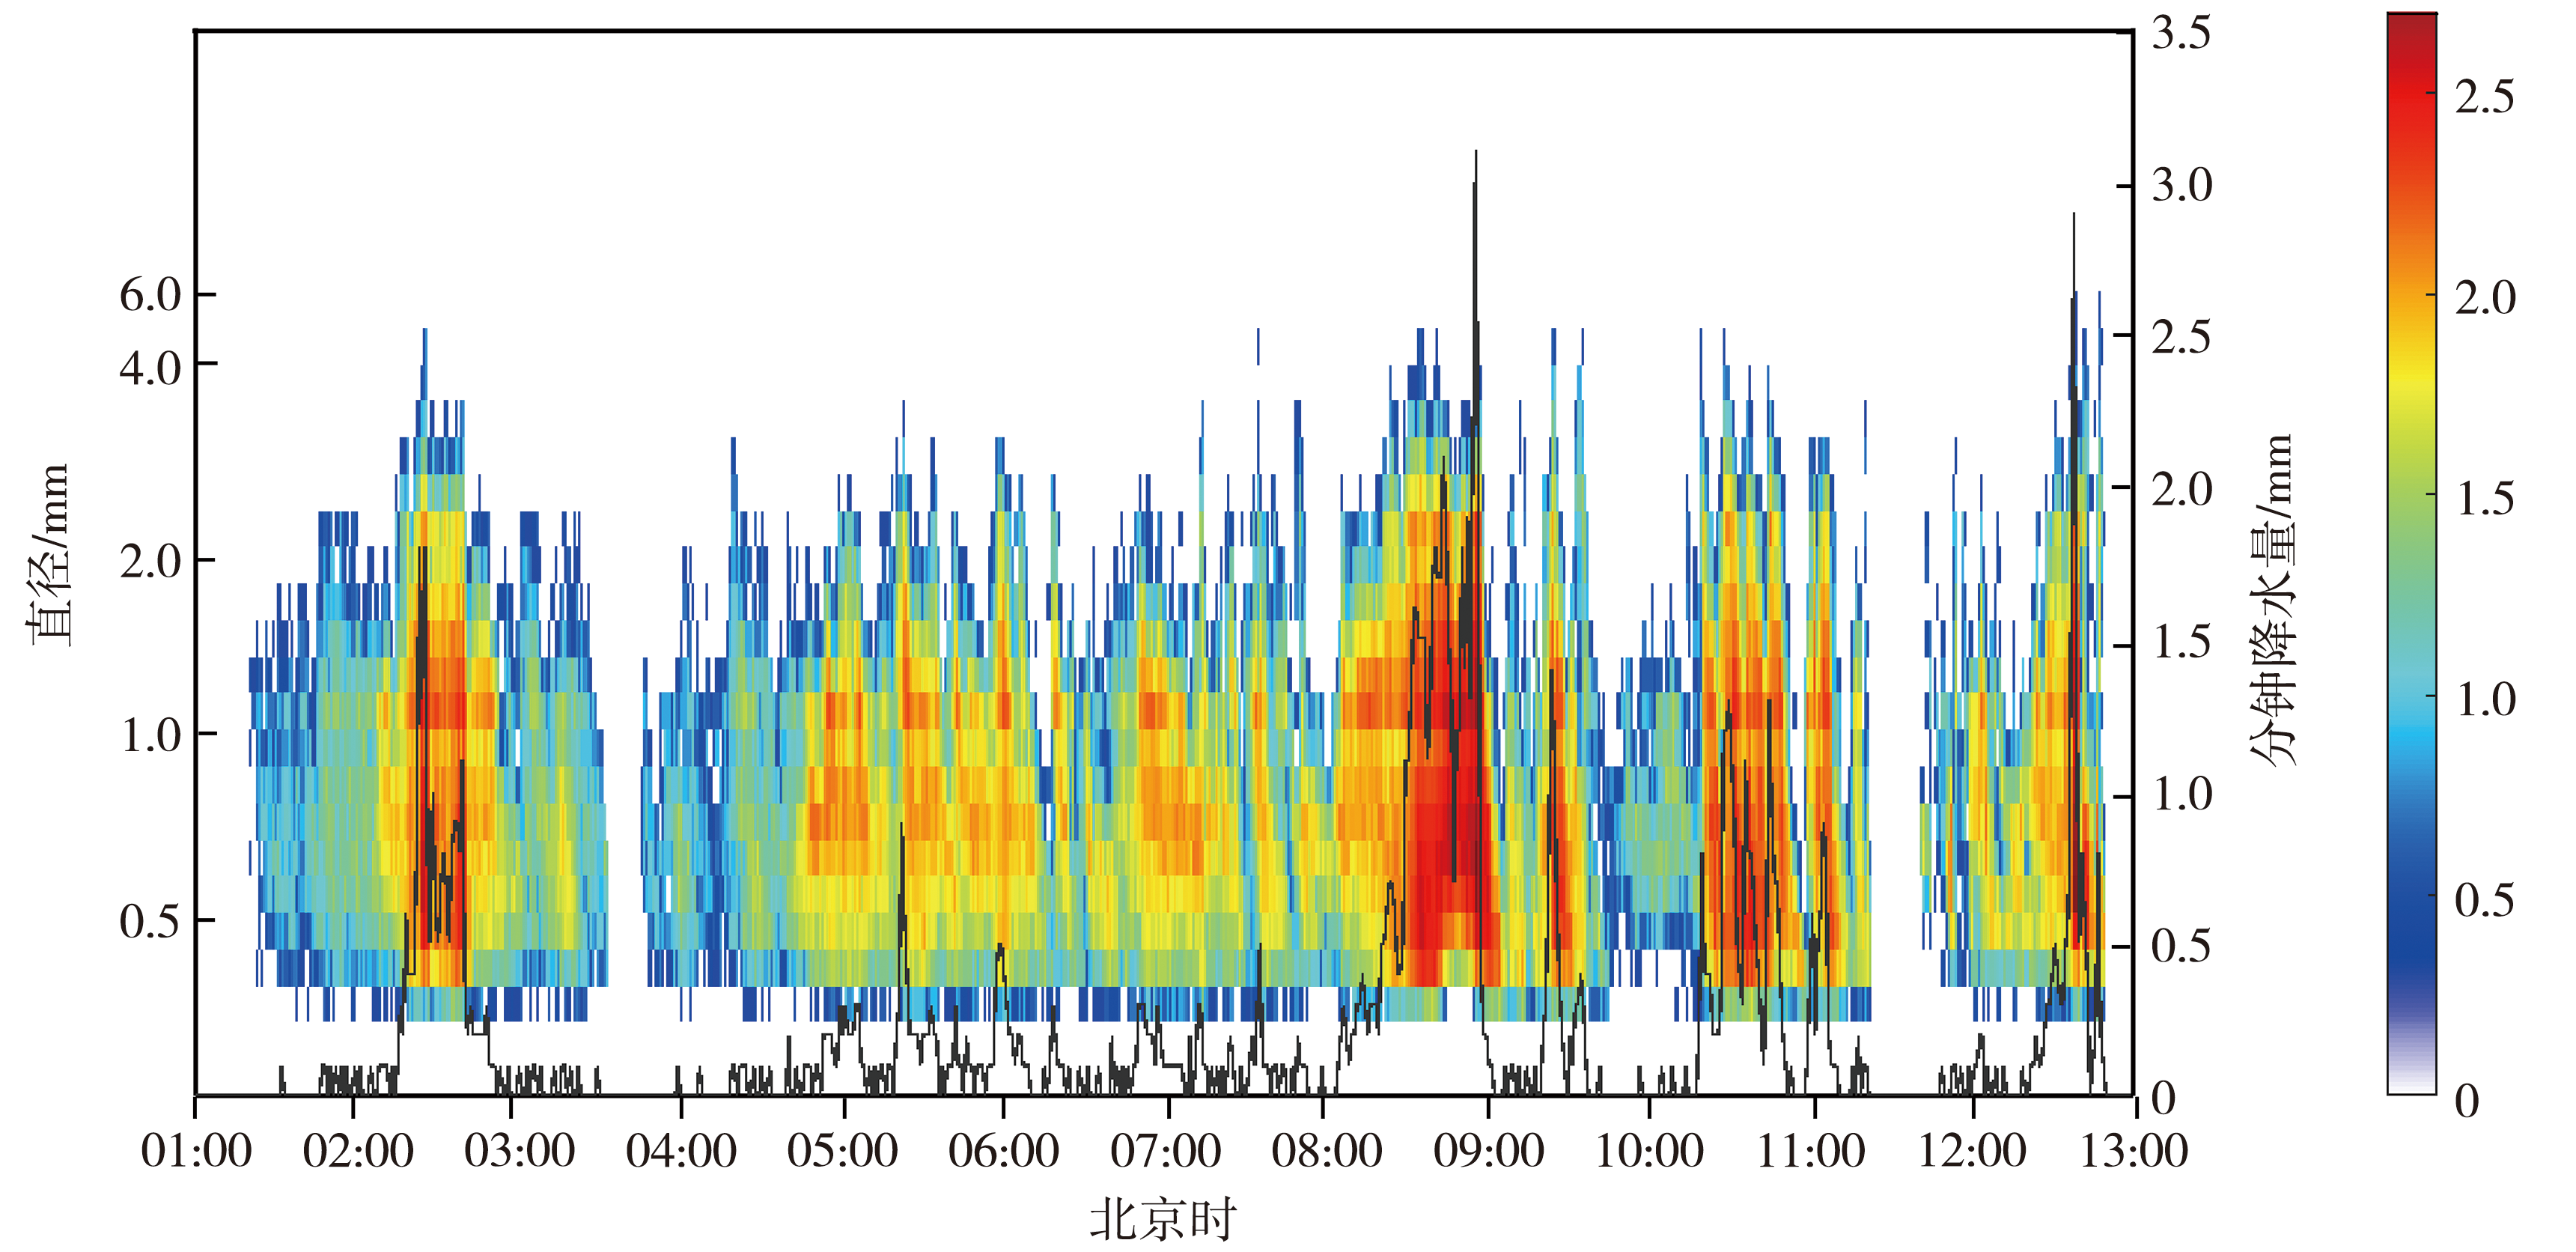
Fig.10 Temporal variations of raindrop size distribution (lg N(D)) (the color shaded, Unit: m-3·mm-1) and minute-by-minute precipitation (black line) observed at Lincheng from 01:00 to 13:00 on 26 August 2024
Fig.10 Temporal variations of raindrop size distribution (lg N(D)) (the color shaded, Unit: m-3·mm-1) and minute-by-minute precipitation (black line) observed at Lincheng from 01:00 to 13:00 on 26 August 2024
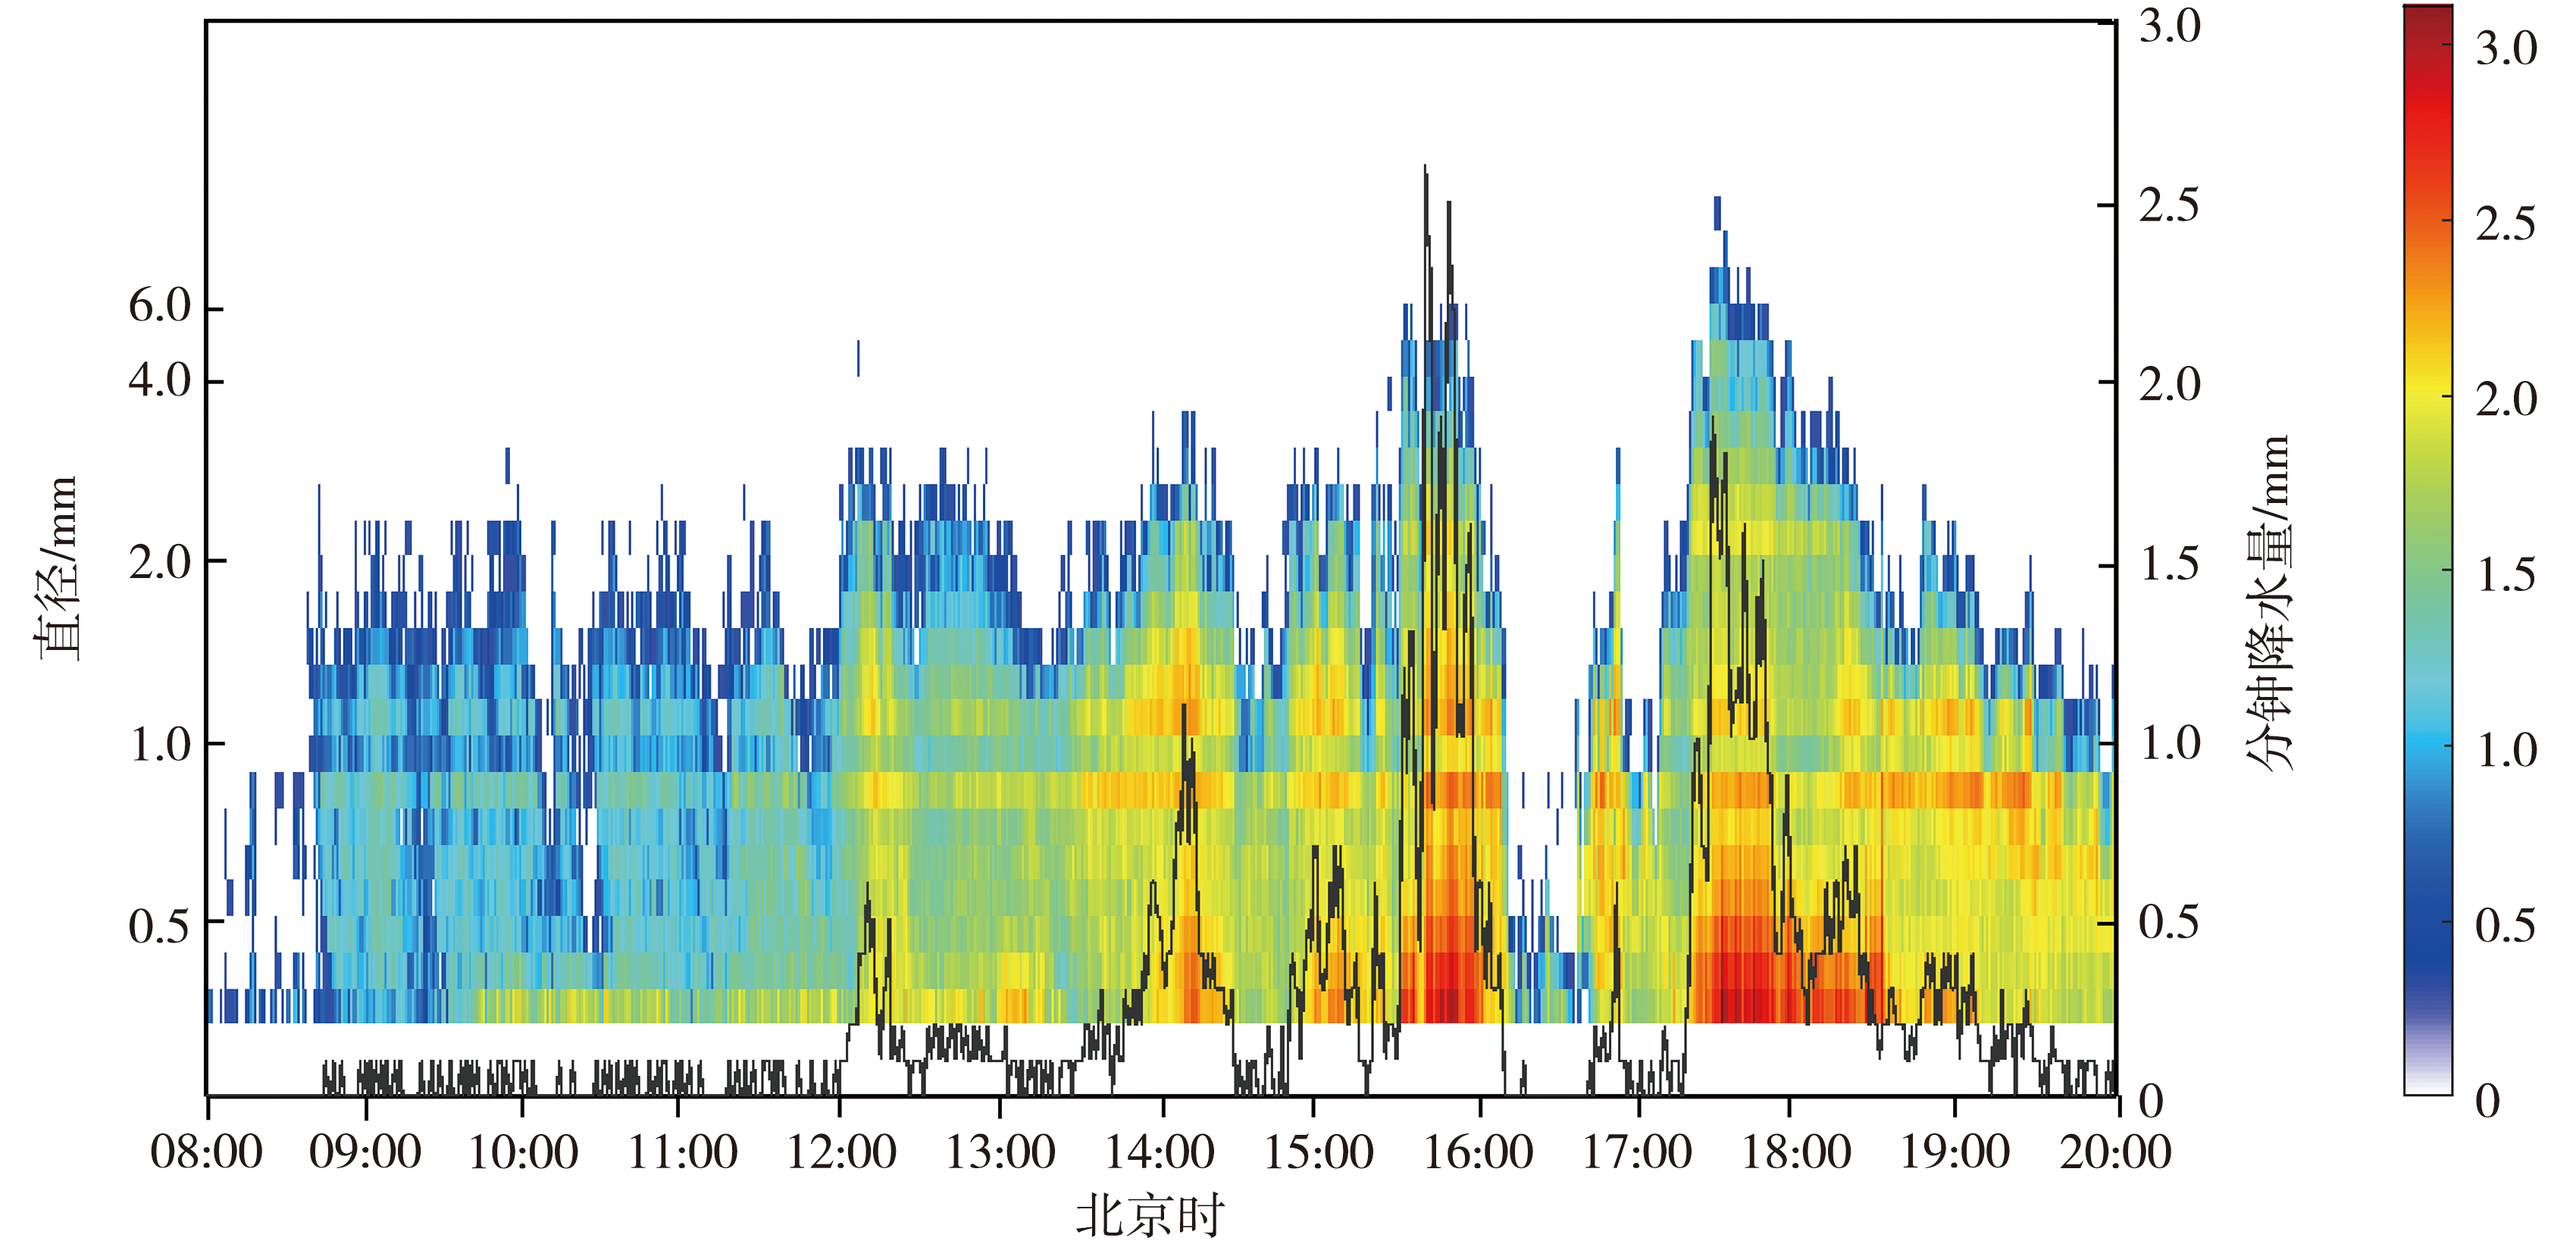
Fig.11 Temporal variations of raindrop size distribution (lg N(D)) (the color shaded, Unit: m-3·mm-1) and minute-by-minute precipitation (black line) observed at Zhanhua from 08:00 to 20:00 on 26 August 2024
Fig.11 Temporal variations of raindrop size distribution (lg N(D)) (the color shaded, Unit: m-3·mm-1) and minute-by-minute precipitation (black line) observed at Zhanhua from 08:00 to 20:00 on 26 August 2024
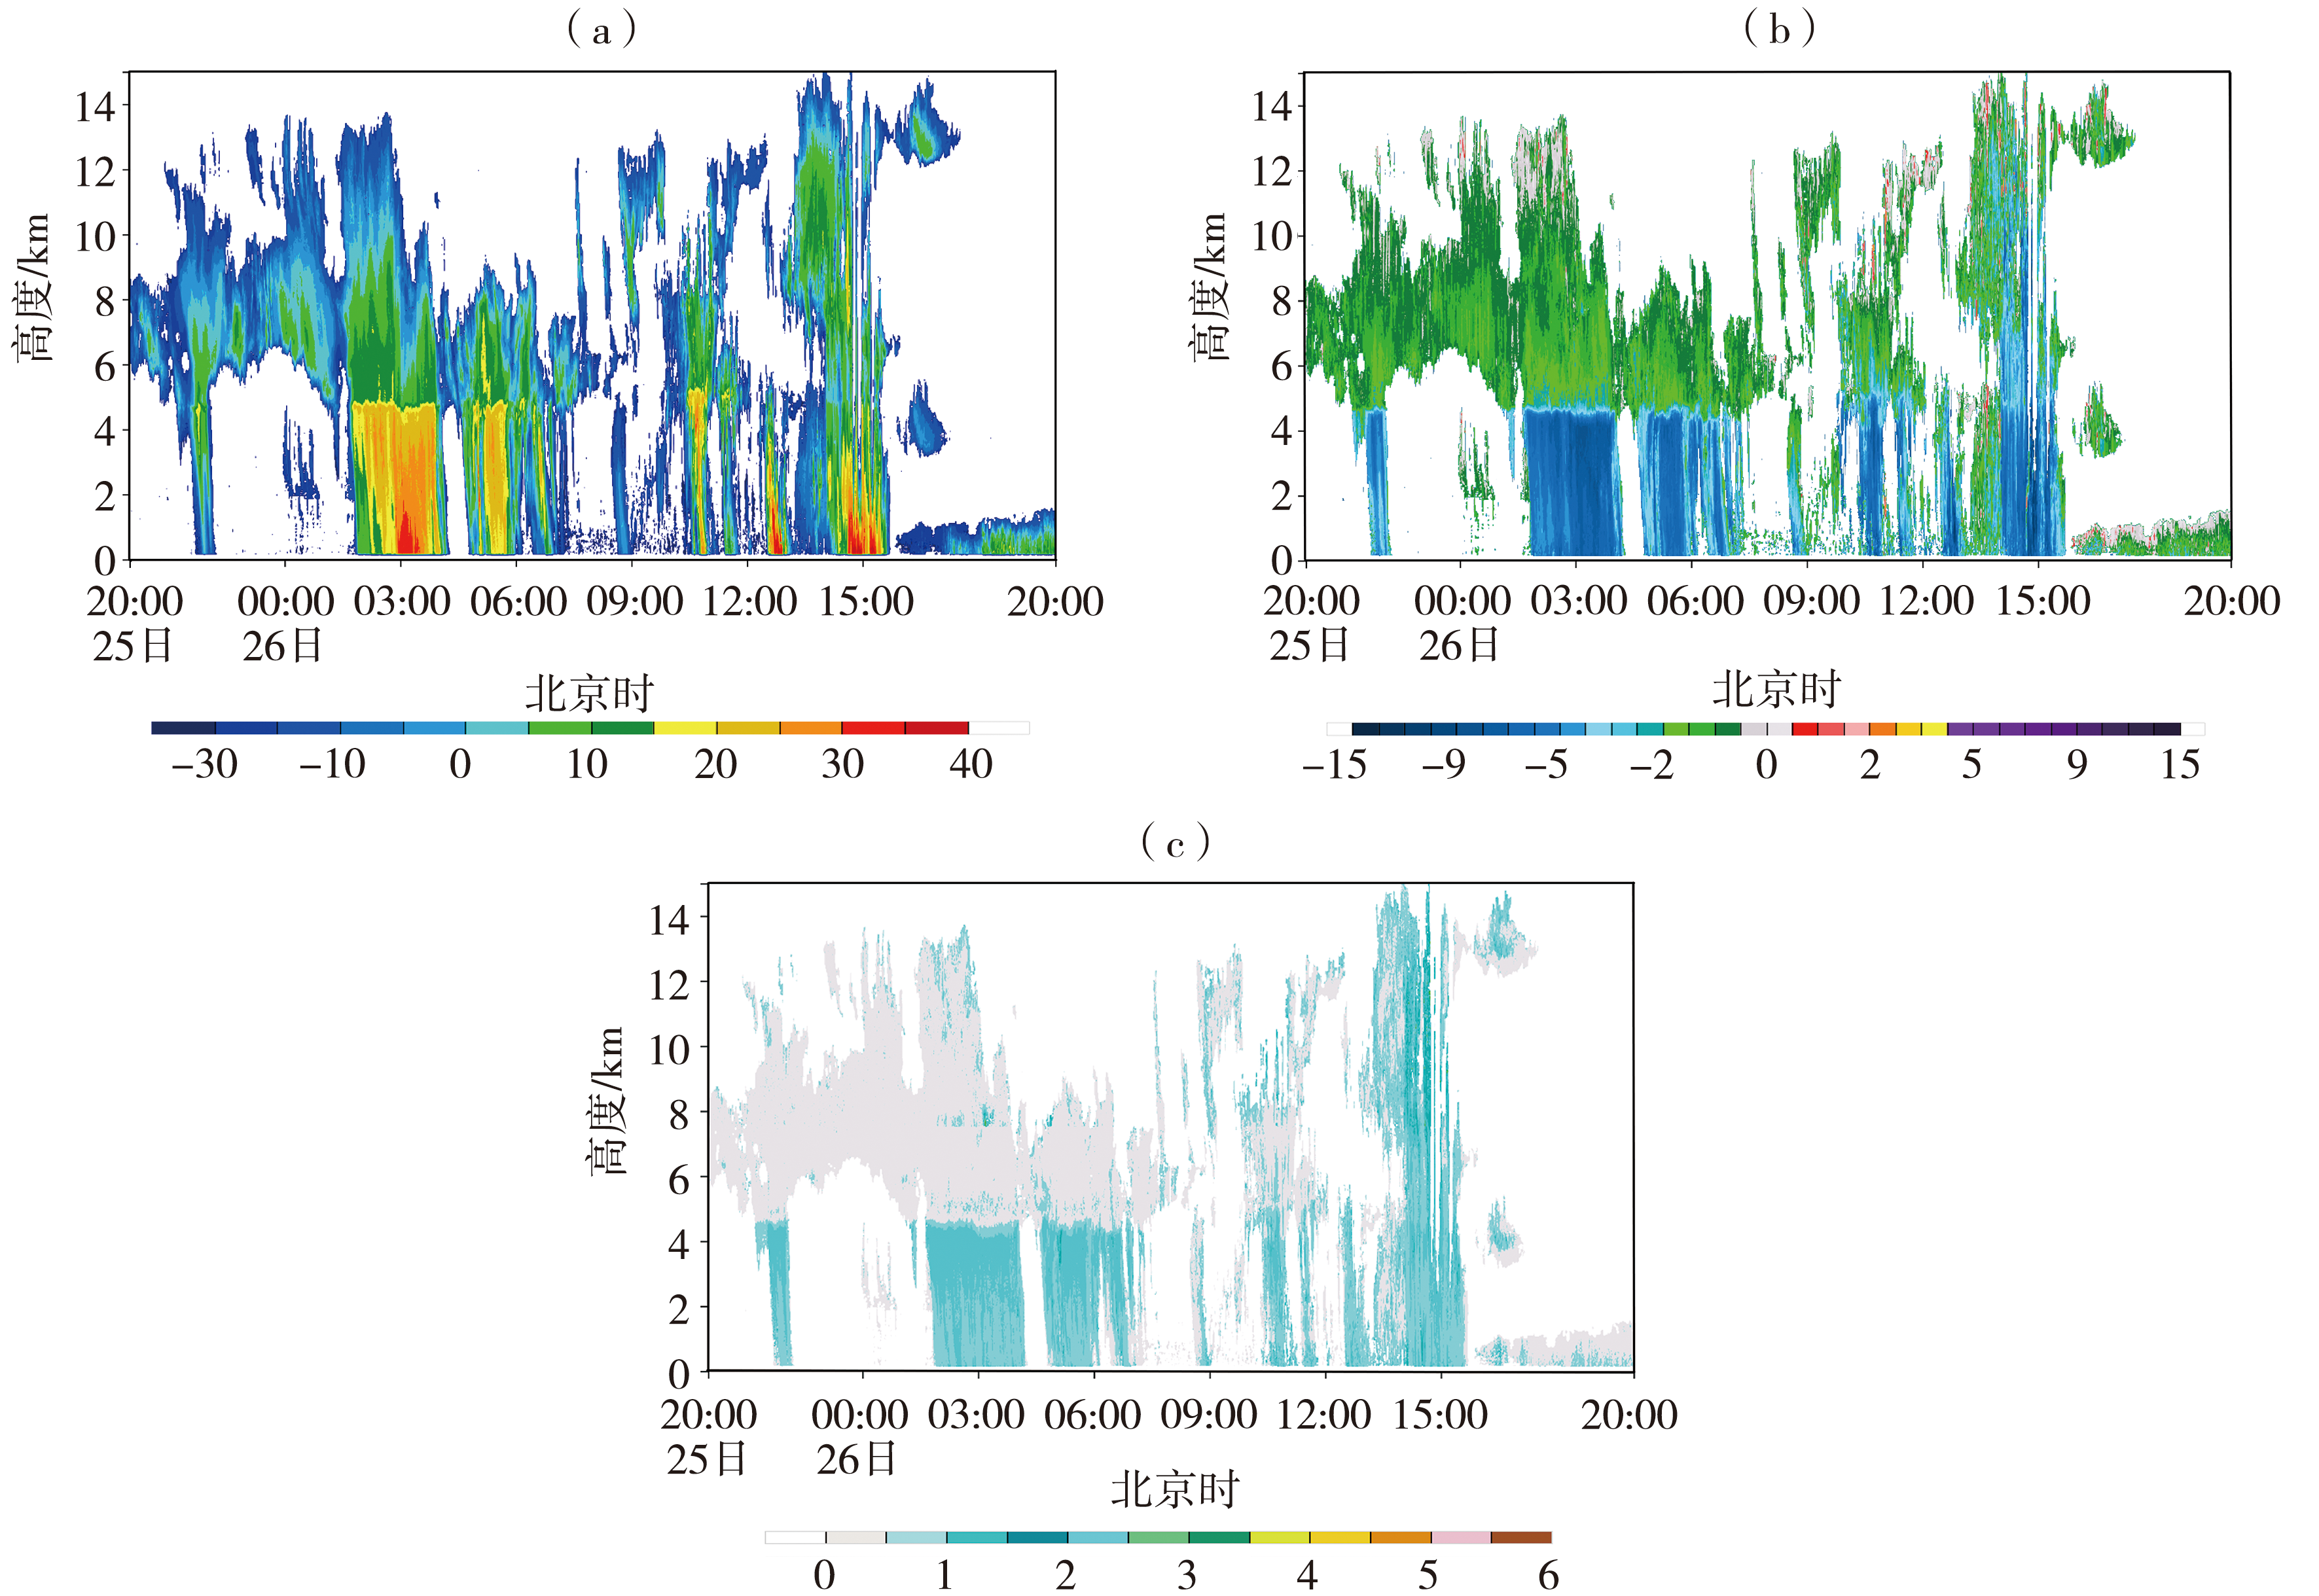
Fig.12 Temporal variations of reflectivity (a, Unit: dBZ), radial velocity (b, Unit: m·s-1) and spectrum width (c, Unit: m·s-1) observed by the Jinan cloud radar from 20:00 on 25 August to 20:00 on 26 August 2024
Fig.12 Temporal variations of reflectivity (a, Unit: dBZ), radial velocity (b, Unit: m·s-1) and spectrum width (c, Unit: m·s-1) observed by the Jinan cloud radar from 20:00 on 25 August to 20:00 on 26 August 2024
| [1] | 陈宏, 杨洋, 张楠, 等, 2024. 2010—2019年海河流域暖季极端小时降水特征分析[J]. 气象与环境科学, 47(4): 23-31. |
| [2] | 刁秀广, 2024. 强冰雹和强降水超级单体风暴双偏振特征差异性[J]. 海洋气象学报, 44(3): 23-36. |
| [3] | 丁一汇, 2019. 中国暴雨理论的发展历程与重要进展[J]. 暴雨灾害, 38(5): 395-406. |
| [4] |
郭立平, 刘姝, 李敬海, 等, 2024. 毫米波云雷达在高影响天气中的预警应用[J]. 干旱气象, 42(3): 465-472.
DOI |
| [5] | 李芳, 刁秀广, 2023. 不同类型强降水风暴低层双偏振参量对比分析[J]. 气象, 49(9): 1 075-1 084. |
| [6] | 李佳, 黄领梅, 申奥, 等, 2025. 海河流域极端降水时空演变特征及未来趋势分析[J]. 人民珠江, 46(9): 84-94. |
| [7] | 刘博文, 李伟, 王希, 等, 2025. 徒骇河-马颊河流域极端降水事件时空演变及未来趋势分析[J/OL]. 水利水电技术: 中英文, 1-19[2025-11-30]. https://link.cnki.net/urlid/10.1746.TV.20250701.1010.004. |
| [8] | 潘佳文, 蒋璐璐, 魏鸣, 等, 2020. 一次强降水超级单体的双偏振雷达观测分析[J]. 气象学报, 78(1): 86-100. |
| [9] | 邱粲, 王栋成, 李娟, 等, 2017. 风廓线雷达垂直速度与地面降雨关系研究:以济南为例[J]. 海洋气象学报, 37(4): 91-100. |
| [10] | 全国气象防灾减灾标准化技术委员会, 2012. 降水量等级:GB/T28592—2012[S]. 北京: 中国标准出版社. |
| [11] | 任伟, 任燕, 李兰兰, 2019. 基于HYSPLIT模式的济南机场一次暴雨过程的水汽输送特征分析[J]. 海洋气象学报, 39(1): 116-122. |
| [12] | 王佳津, 王春学, 陈朝平, 等, 2015. 基于HYSPLIT4的一次四川盆地夏季暴雨水汽路径和源地分析[J]. 气象, 41(11): 1 315-1 327. |
| [13] | 王俊, 郑丽娜, 王洪, 等, 2023. 山东6次台风暴雨雨滴谱统计特征及区域差异[J]. 应用气象学报, 34(4): 475-488. |
| [14] | 王卫民, 徐八林, 雷勇, 等, 2024. Ka波段毫米波云雷达对青藏高原东南缘降水回波的分析[J]. 气象, 50(3): 291-302. |
| [15] |
王文波, 李晓利, 曹云飞, 等, 2025. 风廓线雷达资料在一次对流暴雨过程中的特征分析[J]. 干旱气象, 43(4): 627-636.
DOI |
| [16] | 王赢, 罗亚丽, 刘希, 等, 2025. 南京双偏振雷达2020—2022暖季观测极端降雨的对流云宏微观特征[J]. 热带气象学报, 41(3): 427-439. |
| [17] | 王羽飞, 李健, 于彩霞, 等, 2026. 我国地基毫米波云雷达应用研究进展[J]. 大气与环境光学学报, 21(2): 191-202. |
| [18] | 吴滨滨, 马奉泉, 胡珊珊, 等, 2025. 海河“23·7”流域性特大洪水东淀蓄滞洪区洪水演进复盘分析[J]. 水资源保护, 41(5): 96-105. |
| [19] | 荀爱萍, 张伟, 黄惠镕, 等, 2019. 厦门市S波段双偏振雷达测雨效果分析[J]. 气象与环境科学, 42(4): 103-110. |
| [20] | 颜海帆, 戴竹君, 姜有山, 等, 2024. 基于新型观测资料分析台风“烟花”短时强降水成因[J]. 气象科学, 44(5): 857-869. |
| [21] | 张亚妮, 刘鑫华, 蓝渝, 等, 2025. 河南“21·7”极端降水分钟及小时雨量特征分析[J]. 热带气象学报, 41(3): 359-372. |
| [22] | 张哲, 戚友存, 李东欢, 等, 2022. 2021年郑州“7·20”极端暴雨雨滴谱特征及其对雷达定量降水估测的影响[J]. 大气科学, 46(4): 1 002-1 016. |
| [23] | 郑丽娜, 孙兴池, 2016. 气旋类山东暴雨过程天气学特征分析[J]. 沙漠与绿洲气象, 10(4): 74-80. |
| [24] | 周波涛, 钱进, 2021. IPCC AR6报告解读:极端天气气候事件变化[J]. 气候变化研究进展, 17(6): 713-718. |
| [25] |
周晋红, 王秀明, 田晓婷, 等, 2024. 山西极端暴雨环流特征及水汽异常研究[J]. 干旱气象, 42(3): 426-436.
DOI |
| [26] | 周黎明, 王庆, 李芳, 2015. 山东不同天气系统下暴雨雨滴谱特征分析[J]. 自然灾害学报, 41(2): 217-223. |
| [27] | 朱乾根, 林锦瑞, 寿绍文, 等, 2000. 天气学原理和方法[M]. 3版. 北京: 气象出版社. |
| [28] | 庄园煌, 陈宏, 孙密娜, 等, 2025. 气候变化背景下海河流域极端降水特征及不同重现期降水量估计[J]. 大气科学学报, 48(2): 278-288. |
| [29] |
BRINGI V N, CHANDRASEKAR V, HUBBERT J, et al, 2003. Raindrop size distribution in different climatic regimes from disdrometer and dual-polarized radar analysis[J]. Journal of the Atmospheric Sciences, 60(2): 354-365.
DOI URL |
| [30] |
HERSBACH H, BELL B, BERRISFORD P, et al, 2020. The ERA5 global reanalysis[J]. Quarterly Journal of the Royal Meteorological Society, 146(730): 1 999-2 049.
DOI URL |
| [31] |
HU S M, HUANG X Y, MA Y R, 2021. Turbulence and rainfall microphysical parameters retrieval and their relationship analysis based on wind profiler radar data[J]. Journal of Tropical Meteorology, 27(3): 291-302.
DOI URL |
| [32] |
PORCÙ F, D’ADDERIO L P, PRODI F, et al, 2014. Rain drop size distribution over the Tibetan Plateau[J]. Atmospheric Research, 150: 21-30.
DOI URL |
| [33] |
WILLIS P T, TATTELMAN P, 1989. Drop-size distributions associated with intense rainfall[J]. Journal of Applied Meteorology, 28(1): 3-15.
DOI URL |
| [34] |
ZHAO C F, LIU L P, WANG Q Q, et al, 2017. MMCR-based characteristic properties of non-precipitating cloud liquid droplets at Naqu site over Tibetan Plateau in July 2014[J]. Atmospheric Research, 190: 68-76.
DOI URL |
| Viewed | ||||||
|
Full text |
|
|||||
|
Abstract |
|
|||||