Journal of Arid Meteorology ›› 2026, Vol. 44 ›› Issue (1): 159-171.DOI: 10.11755/j.issn.1006-7639-2026-01-0159
• Technical Reports • Previous Articles Next Articles
Evaluation of the predictive performance of the SEAS5 model for summer precipitation in Heilongjiang Province
WANG Hao1,2( ), MA Hao3(), LI Yongsheng1,2, LIU Changzheng4, JIANG Yuhan5
- 1. Heilongjiang Climate Centre,Harbin 150030,China
2. Wuying National Climatological Observatory,Yichun 153000,Heilongjiang,China
3. Zhejiang Climate Centre,Hangzhou 310052,China
4. National Climate Center,Beijing 100081,China
5. Heilongjiang Eco-Meteorology Center,Harbin 150030,China
-
Received:2025-07-29Revised:2025-12-08Online:2026-02-28Published:2026-03-25
SEAS5模式对黑龙江省夏季降水的预测性能评估
王昊1,2(), 马浩3(), 李永生1,2, 刘长征4, 姜雨函5
- 1.黑龙江省气候中心,黑龙江 哈尔滨 150030
2.五营国家气候观象台,黑龙江 伊春 153000
3.浙江省气候中心,浙江 杭州 310052
4.国家气候中心,北京 100081
5.黑龙江省生态气象中心,黑龙江 哈尔滨 150030
-
通讯作者:马浩 -
作者简介:王昊(1996—),女,黑龙江哈尔滨人,工程师,主要从事气候预测与气候变化研究。E-mail: 1005115621@qq.com。 -
基金资助:中国气象局气象能力提升联合研究专项(22NLTSY001);黑龙江省自然科学基金项目(LH202D022);中国气象局青年创新团队气象灾害风险评估配套项目(CMA2023QN01);浙江省自然科学基金联合基金重大项目(LZJMD24D050002);中国气象局沈阳大气环境研究所联合开放基金项目(2024SYIAEKFMS09);松辽流域气象科技创新项目(SL2025014)
CLC Number:
Cite this article
WANG Hao, MA Hao, LI Yongsheng, LIU Changzheng, JIANG Yuhan. Evaluation of the predictive performance of the SEAS5 model for summer precipitation in Heilongjiang Province[J]. Journal of Arid Meteorology, 2026, 44(1): 159-171.
王昊, 马浩, 李永生, 刘长征, 姜雨函. SEAS5模式对黑龙江省夏季降水的预测性能评估[J]. 干旱气象, 2026, 44(1): 159-171.
share this article
Add to citation manager EndNote|Ris|BibTeX
URL: http://www.ghqx.org.cn/EN/10.11755/j.issn.1006-7639-2026-01-0159
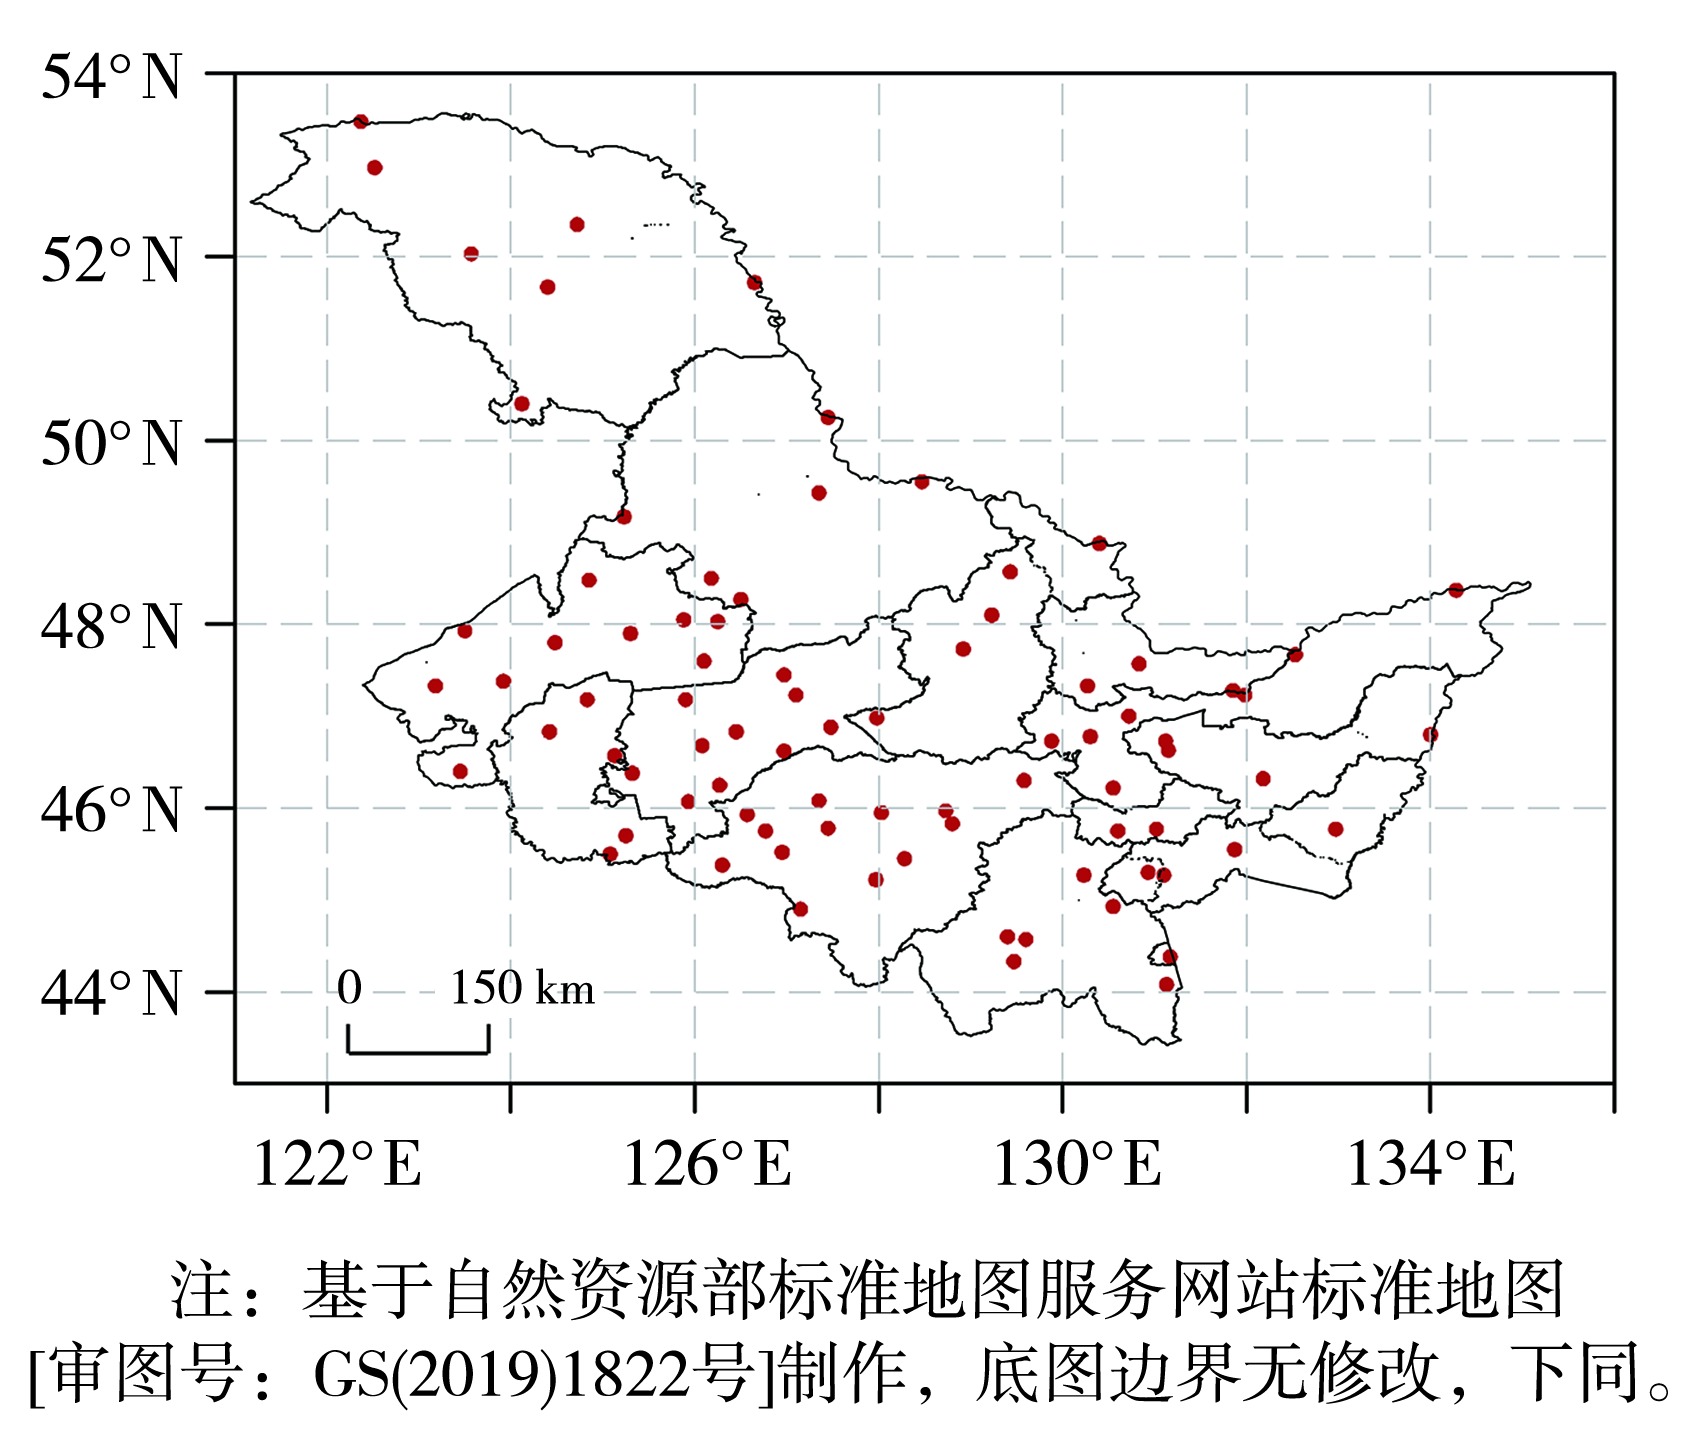
Fig.1 Spatial distribution of 83 conventional meteorological stations in Heilongjiang Province
Fig.1 Spatial distribution of 83 conventional meteorological stations in Heilongjiang Province
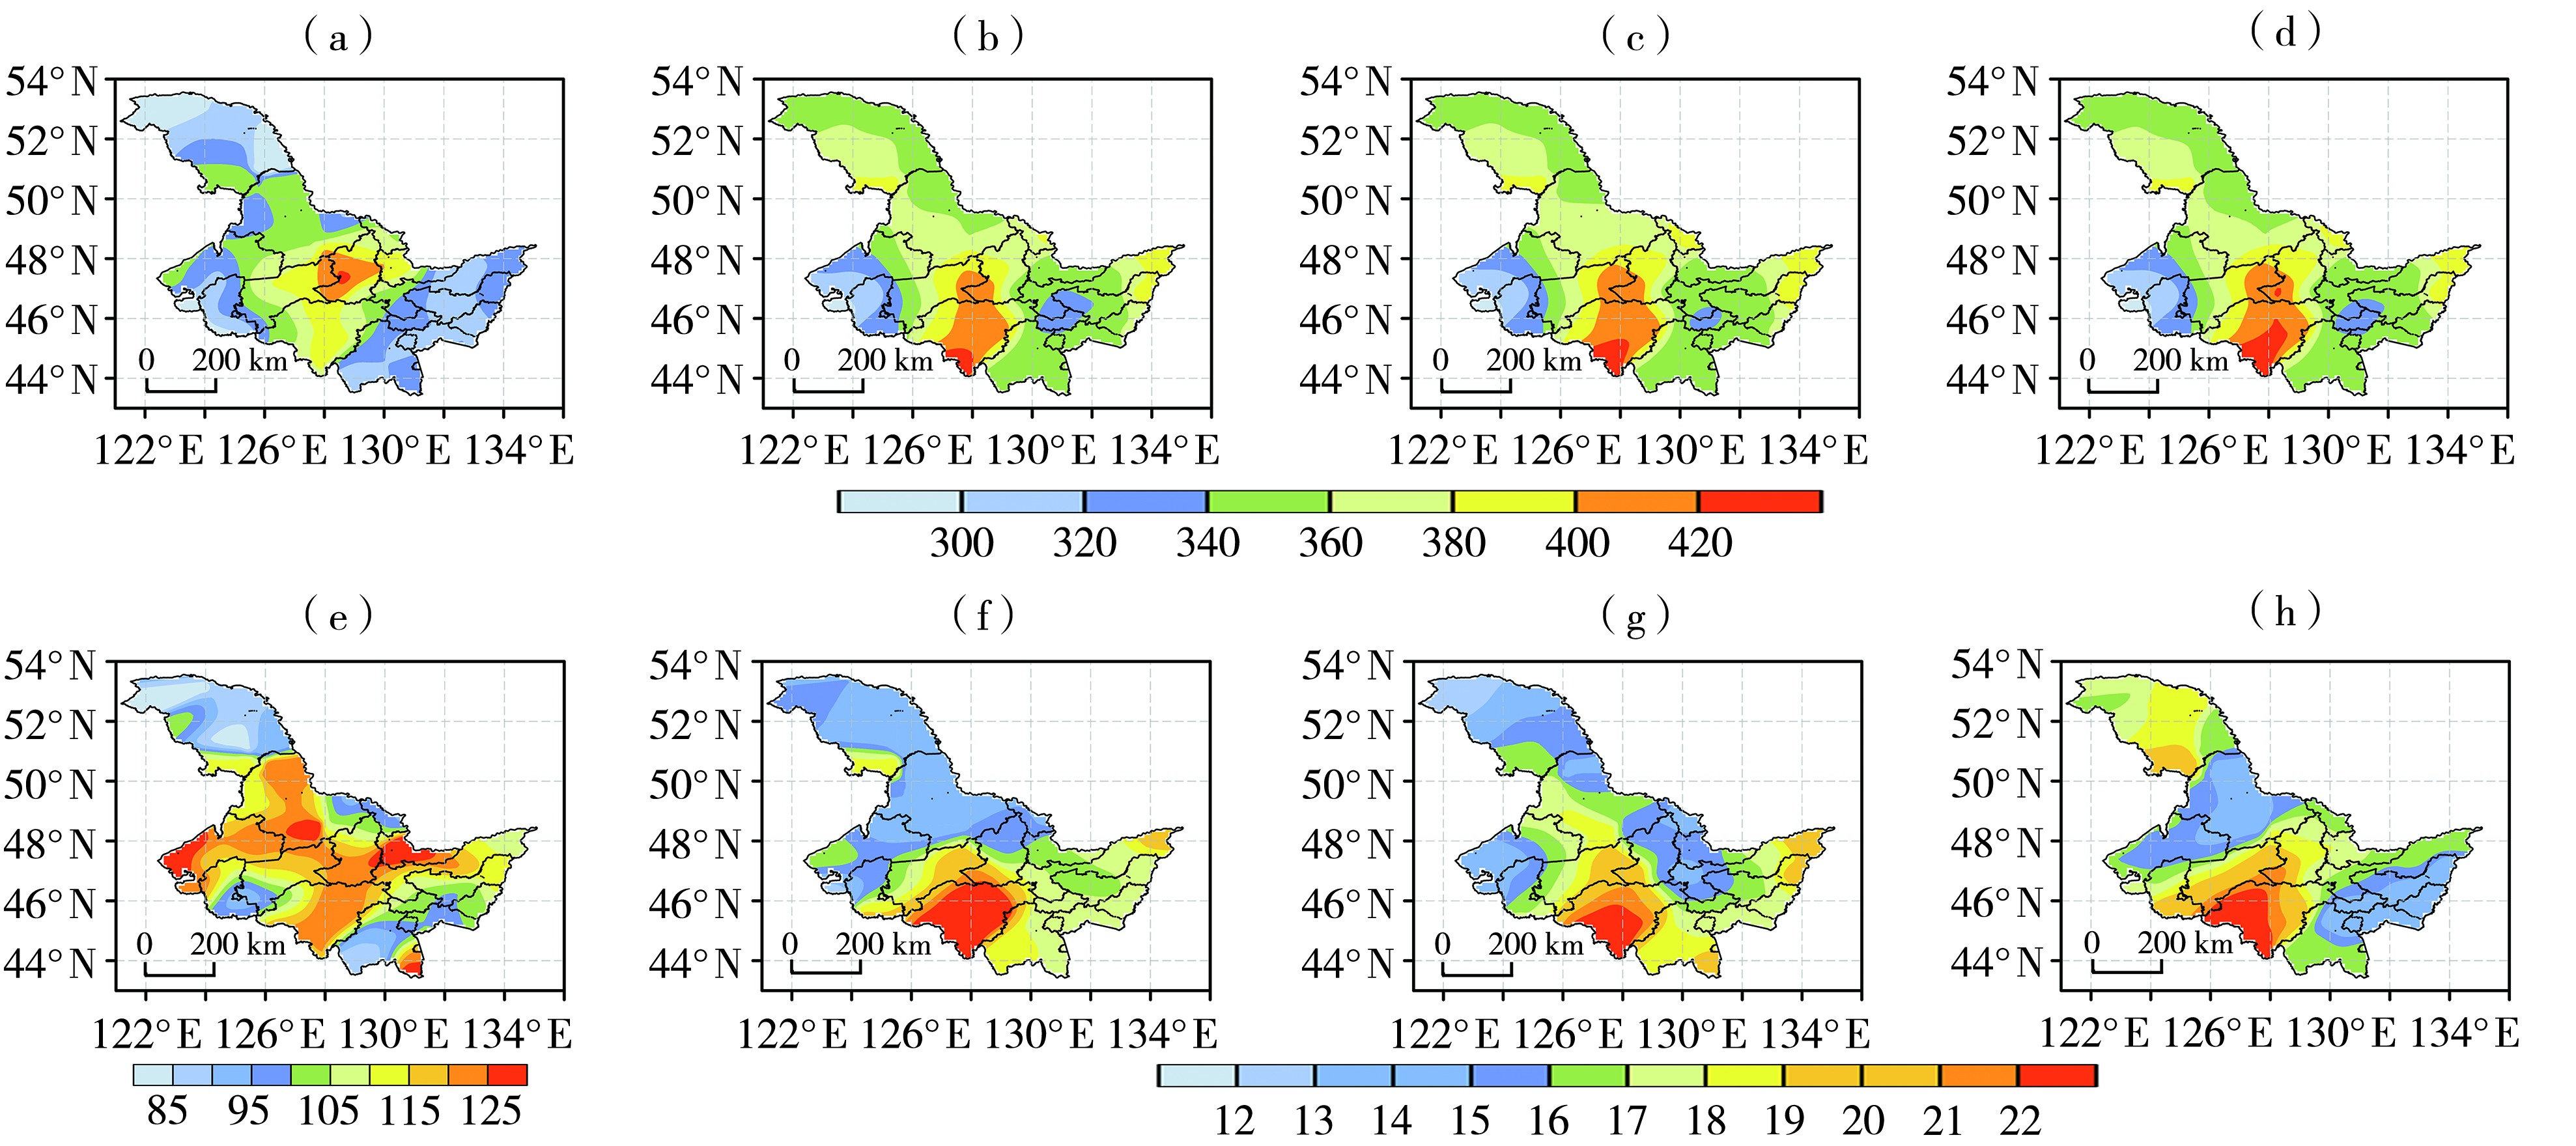
Fig.2 Spatial distribution of the multi-year average (a, b, c, d) and the mean square error (e, f, g, h) of summer total precipitation from observations (a, e) and SEAS5 forecasts of Sf3 (b, f), Sf4 (c, g), and Sf5 (d, h) in Heilongjiang during 1993-2023 (Unit: mm)
Fig.2 Spatial distribution of the multi-year average (a, b, c, d) and the mean square error (e, f, g, h) of summer total precipitation from observations (a, e) and SEAS5 forecasts of Sf3 (b, f), Sf4 (c, g), and Sf5 (d, h) in Heilongjiang during 1993-2023 (Unit: mm)
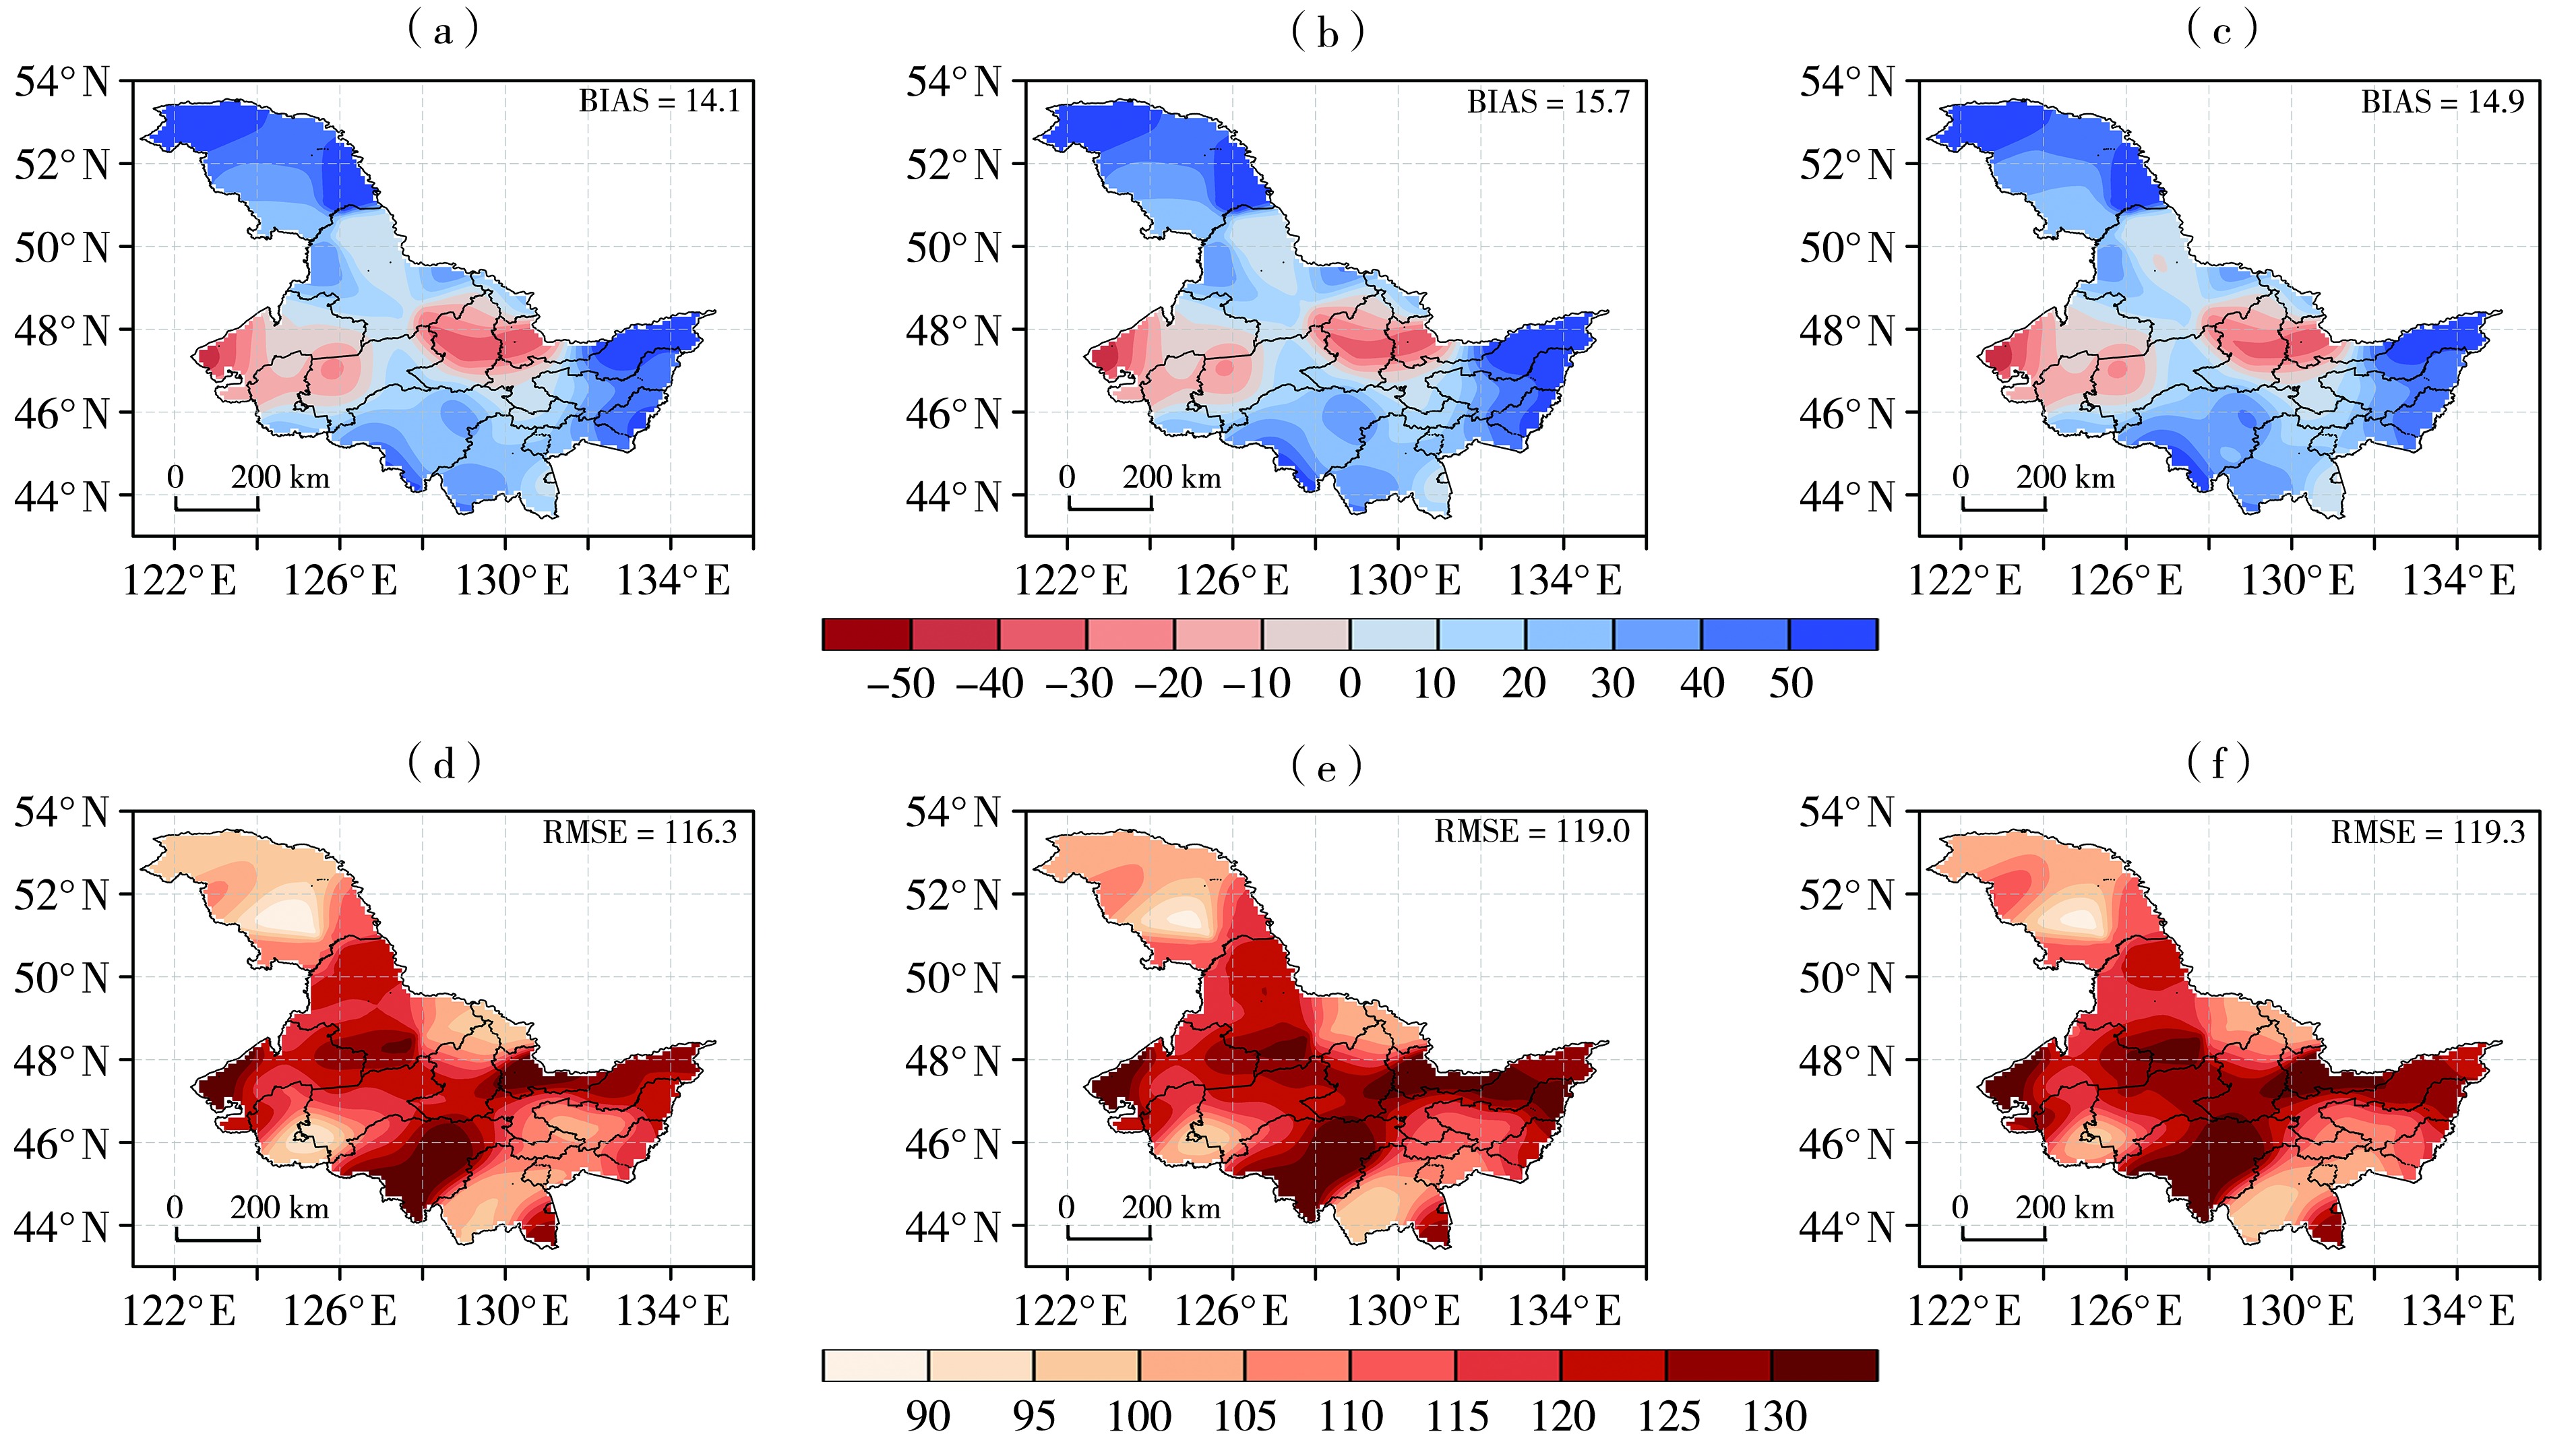
Fig.3 Spatial distribution of multi-year mean bias (model values minus observation) (a, b, c) and RMSE (d, e, f) of SEAS5 forecast of summer total precipitation of Sf3 (a, d), Sf4 (b, e), and Sf5 (c, f) in Heilongjiang during 1993-2023 (Unit: mm) (The number in the figure denotes the provincial mean, the same as below)
Fig.3 Spatial distribution of multi-year mean bias (model values minus observation) (a, b, c) and RMSE (d, e, f) of SEAS5 forecast of summer total precipitation of Sf3 (a, d), Sf4 (b, e), and Sf5 (c, f) in Heilongjiang during 1993-2023 (Unit: mm) (The number in the figure denotes the provincial mean, the same as below)
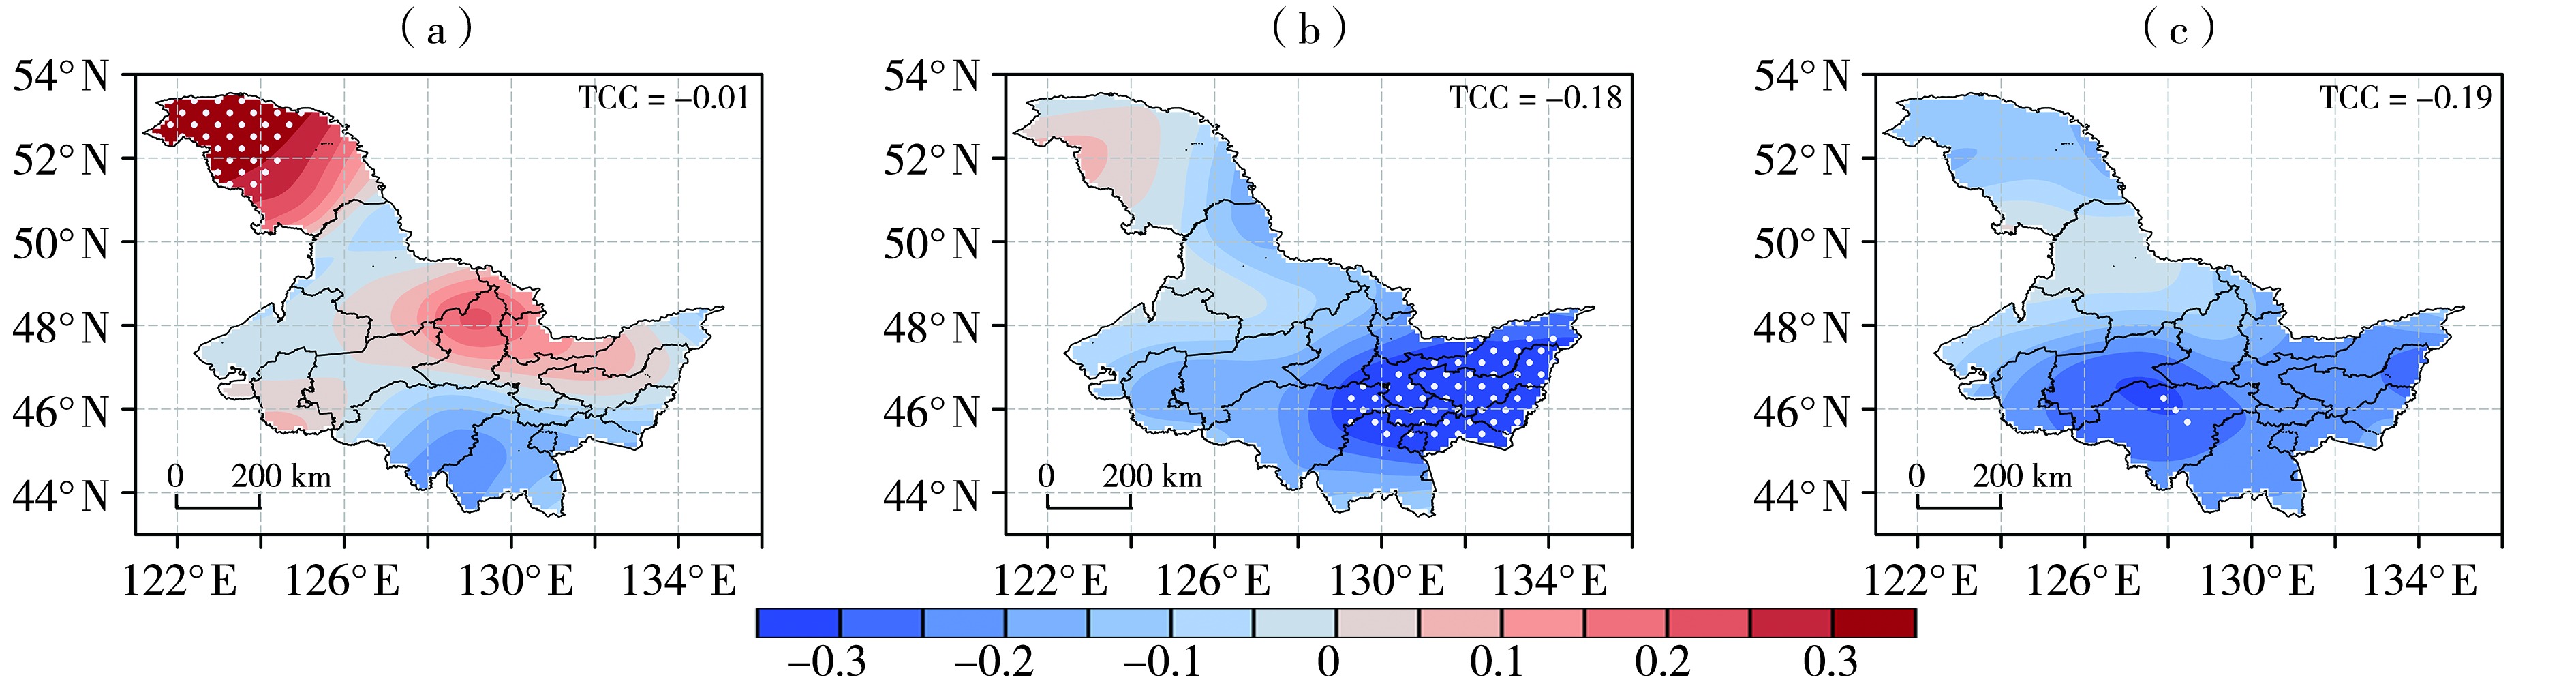
Fig.4 The TCC of summer total precipitation between observations and SEAS5 forecasts of Sf3 (a),Sf4 (b),and Sf5 (c) in Heilongjiang during 1993-2023 (the dotted area passing the significance test at 90% confidence level)
Fig.4 The TCC of summer total precipitation between observations and SEAS5 forecasts of Sf3 (a),Sf4 (b),and Sf5 (c) in Heilongjiang during 1993-2023 (the dotted area passing the significance test at 90% confidence level)
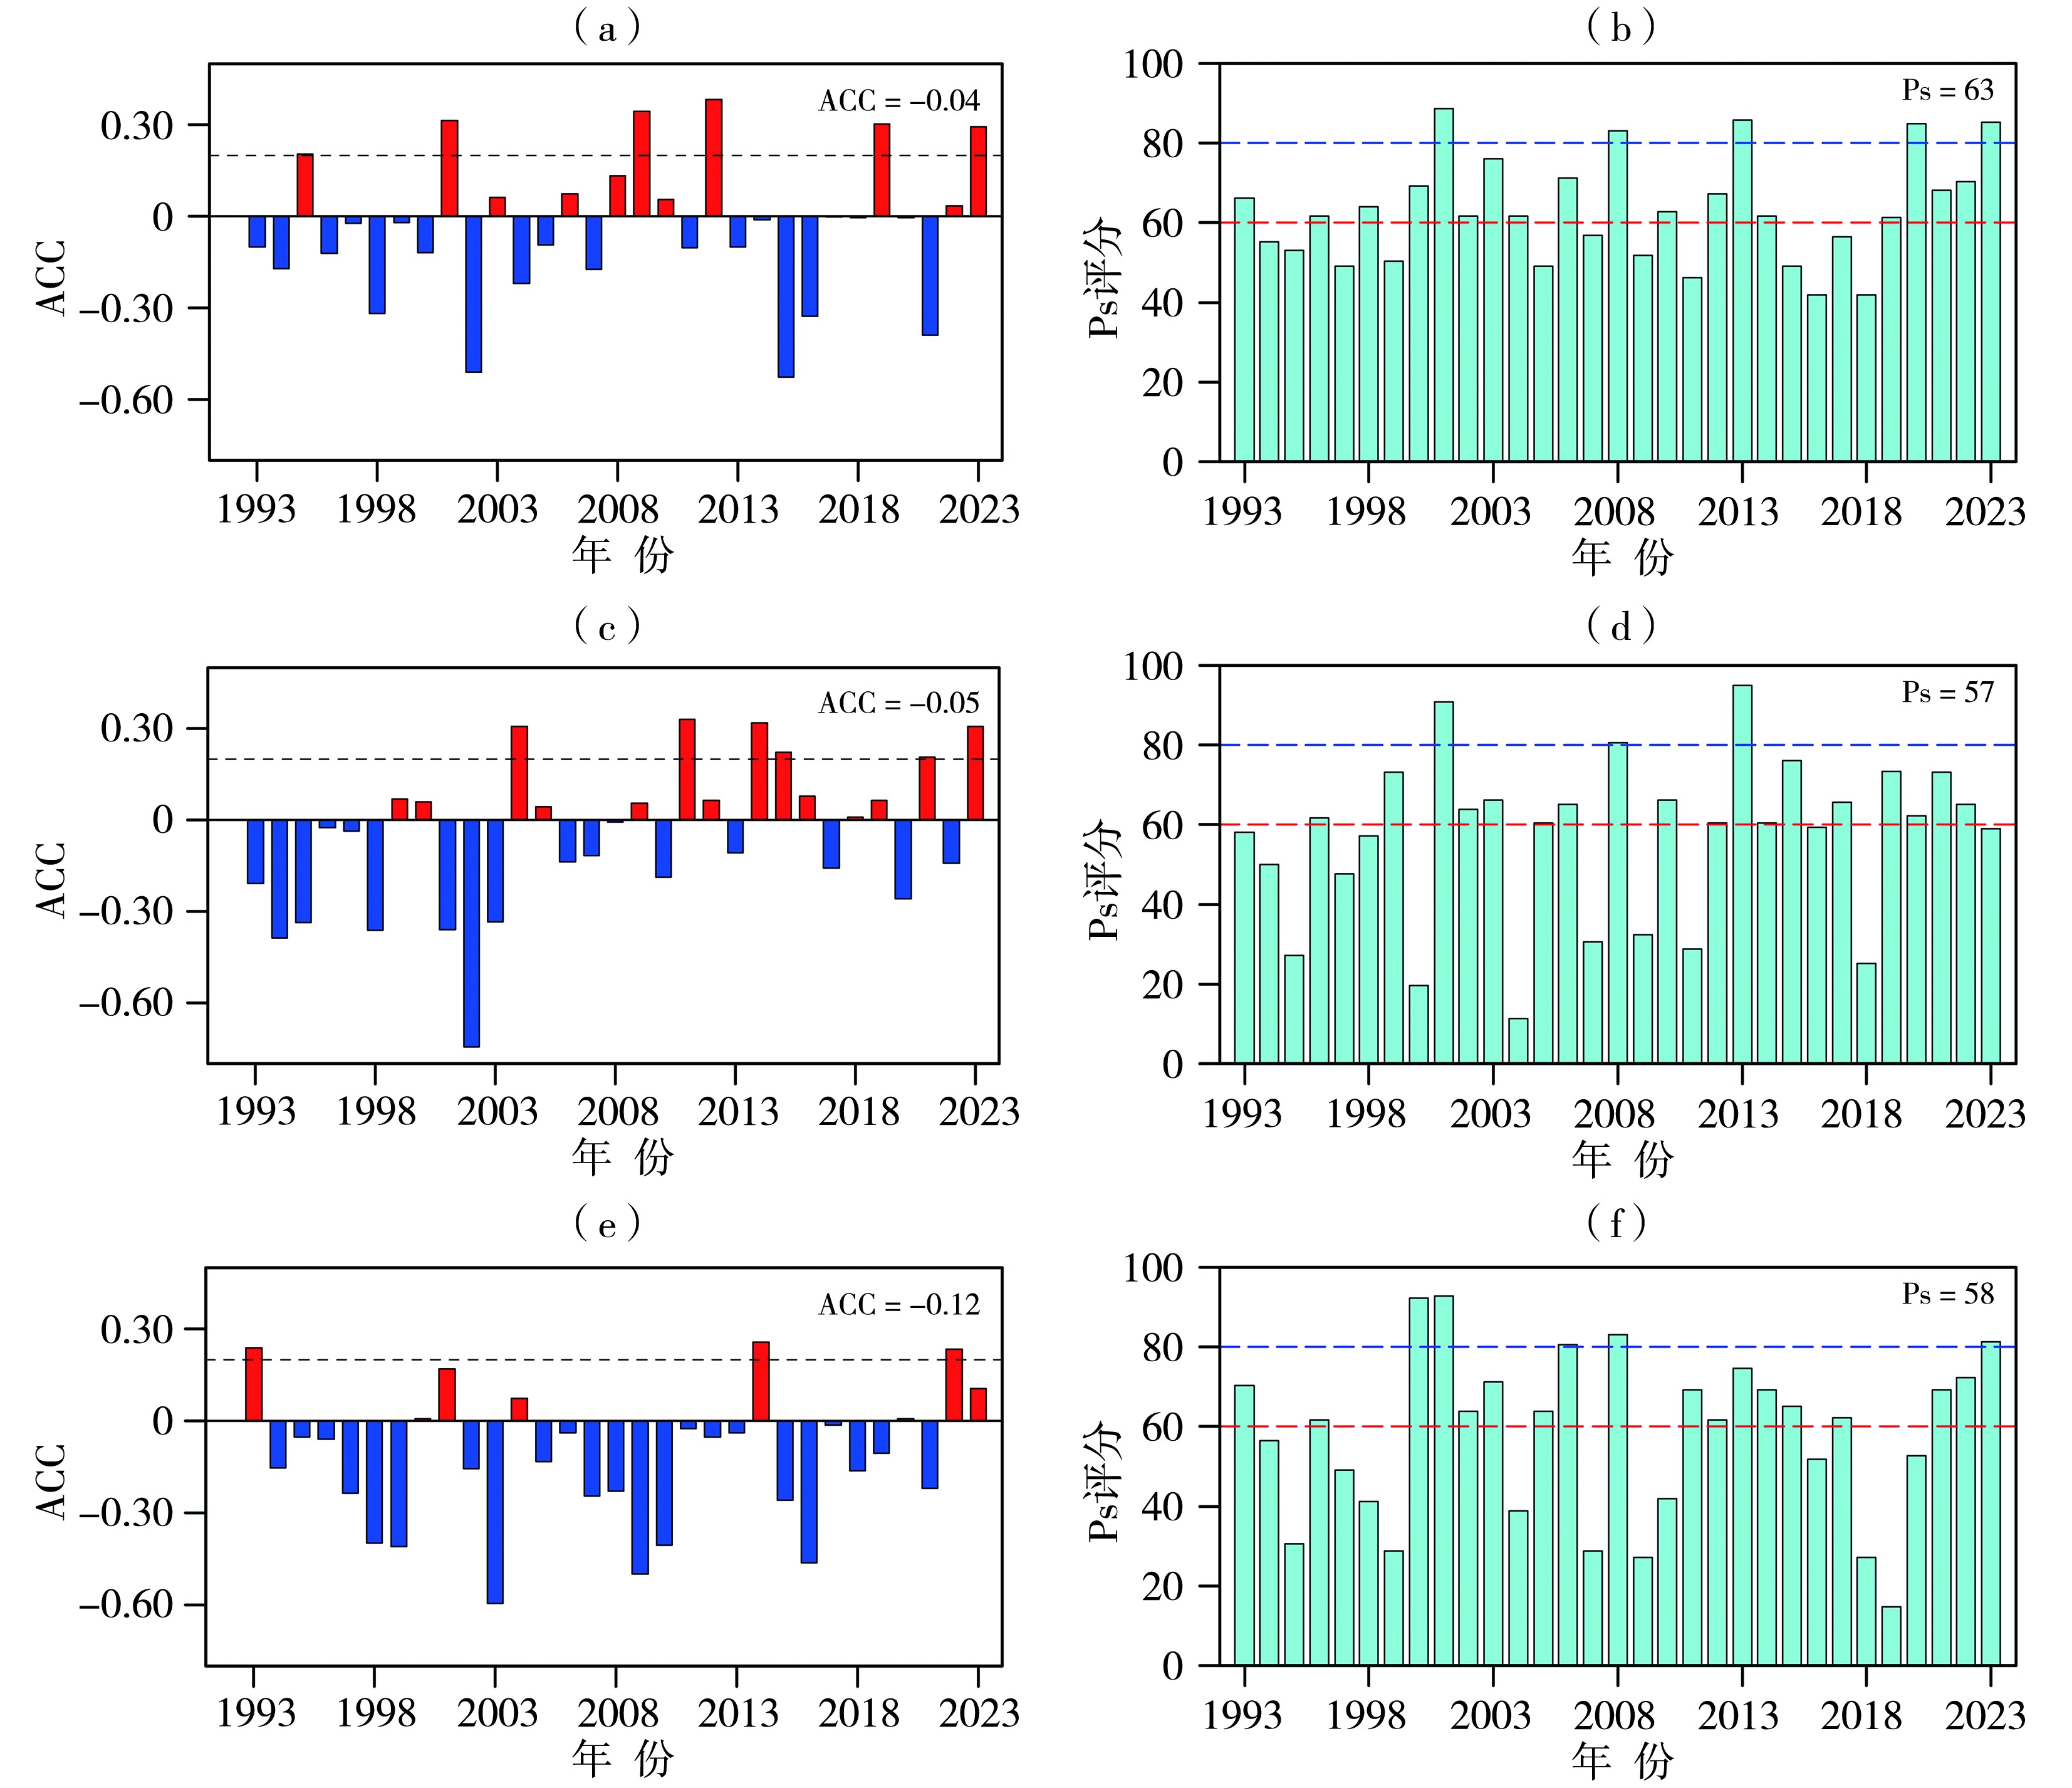
Fig.5 Interannual variations of ACC (a, c, e) and Ps score (b, d, f) for percentage of anomalies of summer precipitation in Heilongjiang from SEAS5 forecasts of Sf3 (a, b), Sf4 (c, d), and Sf5 (e, f) during 1993-2023 (The black dotted line represents ACC=0.20, the red dotted line represents Ps=60, and the blue dotted line represents Ps=80)
Fig.5 Interannual variations of ACC (a, c, e) and Ps score (b, d, f) for percentage of anomalies of summer precipitation in Heilongjiang from SEAS5 forecasts of Sf3 (a, b), Sf4 (c, d), and Sf5 (e, f) during 1993-2023 (The black dotted line represents ACC=0.20, the red dotted line represents Ps=60, and the blue dotted line represents Ps=80)
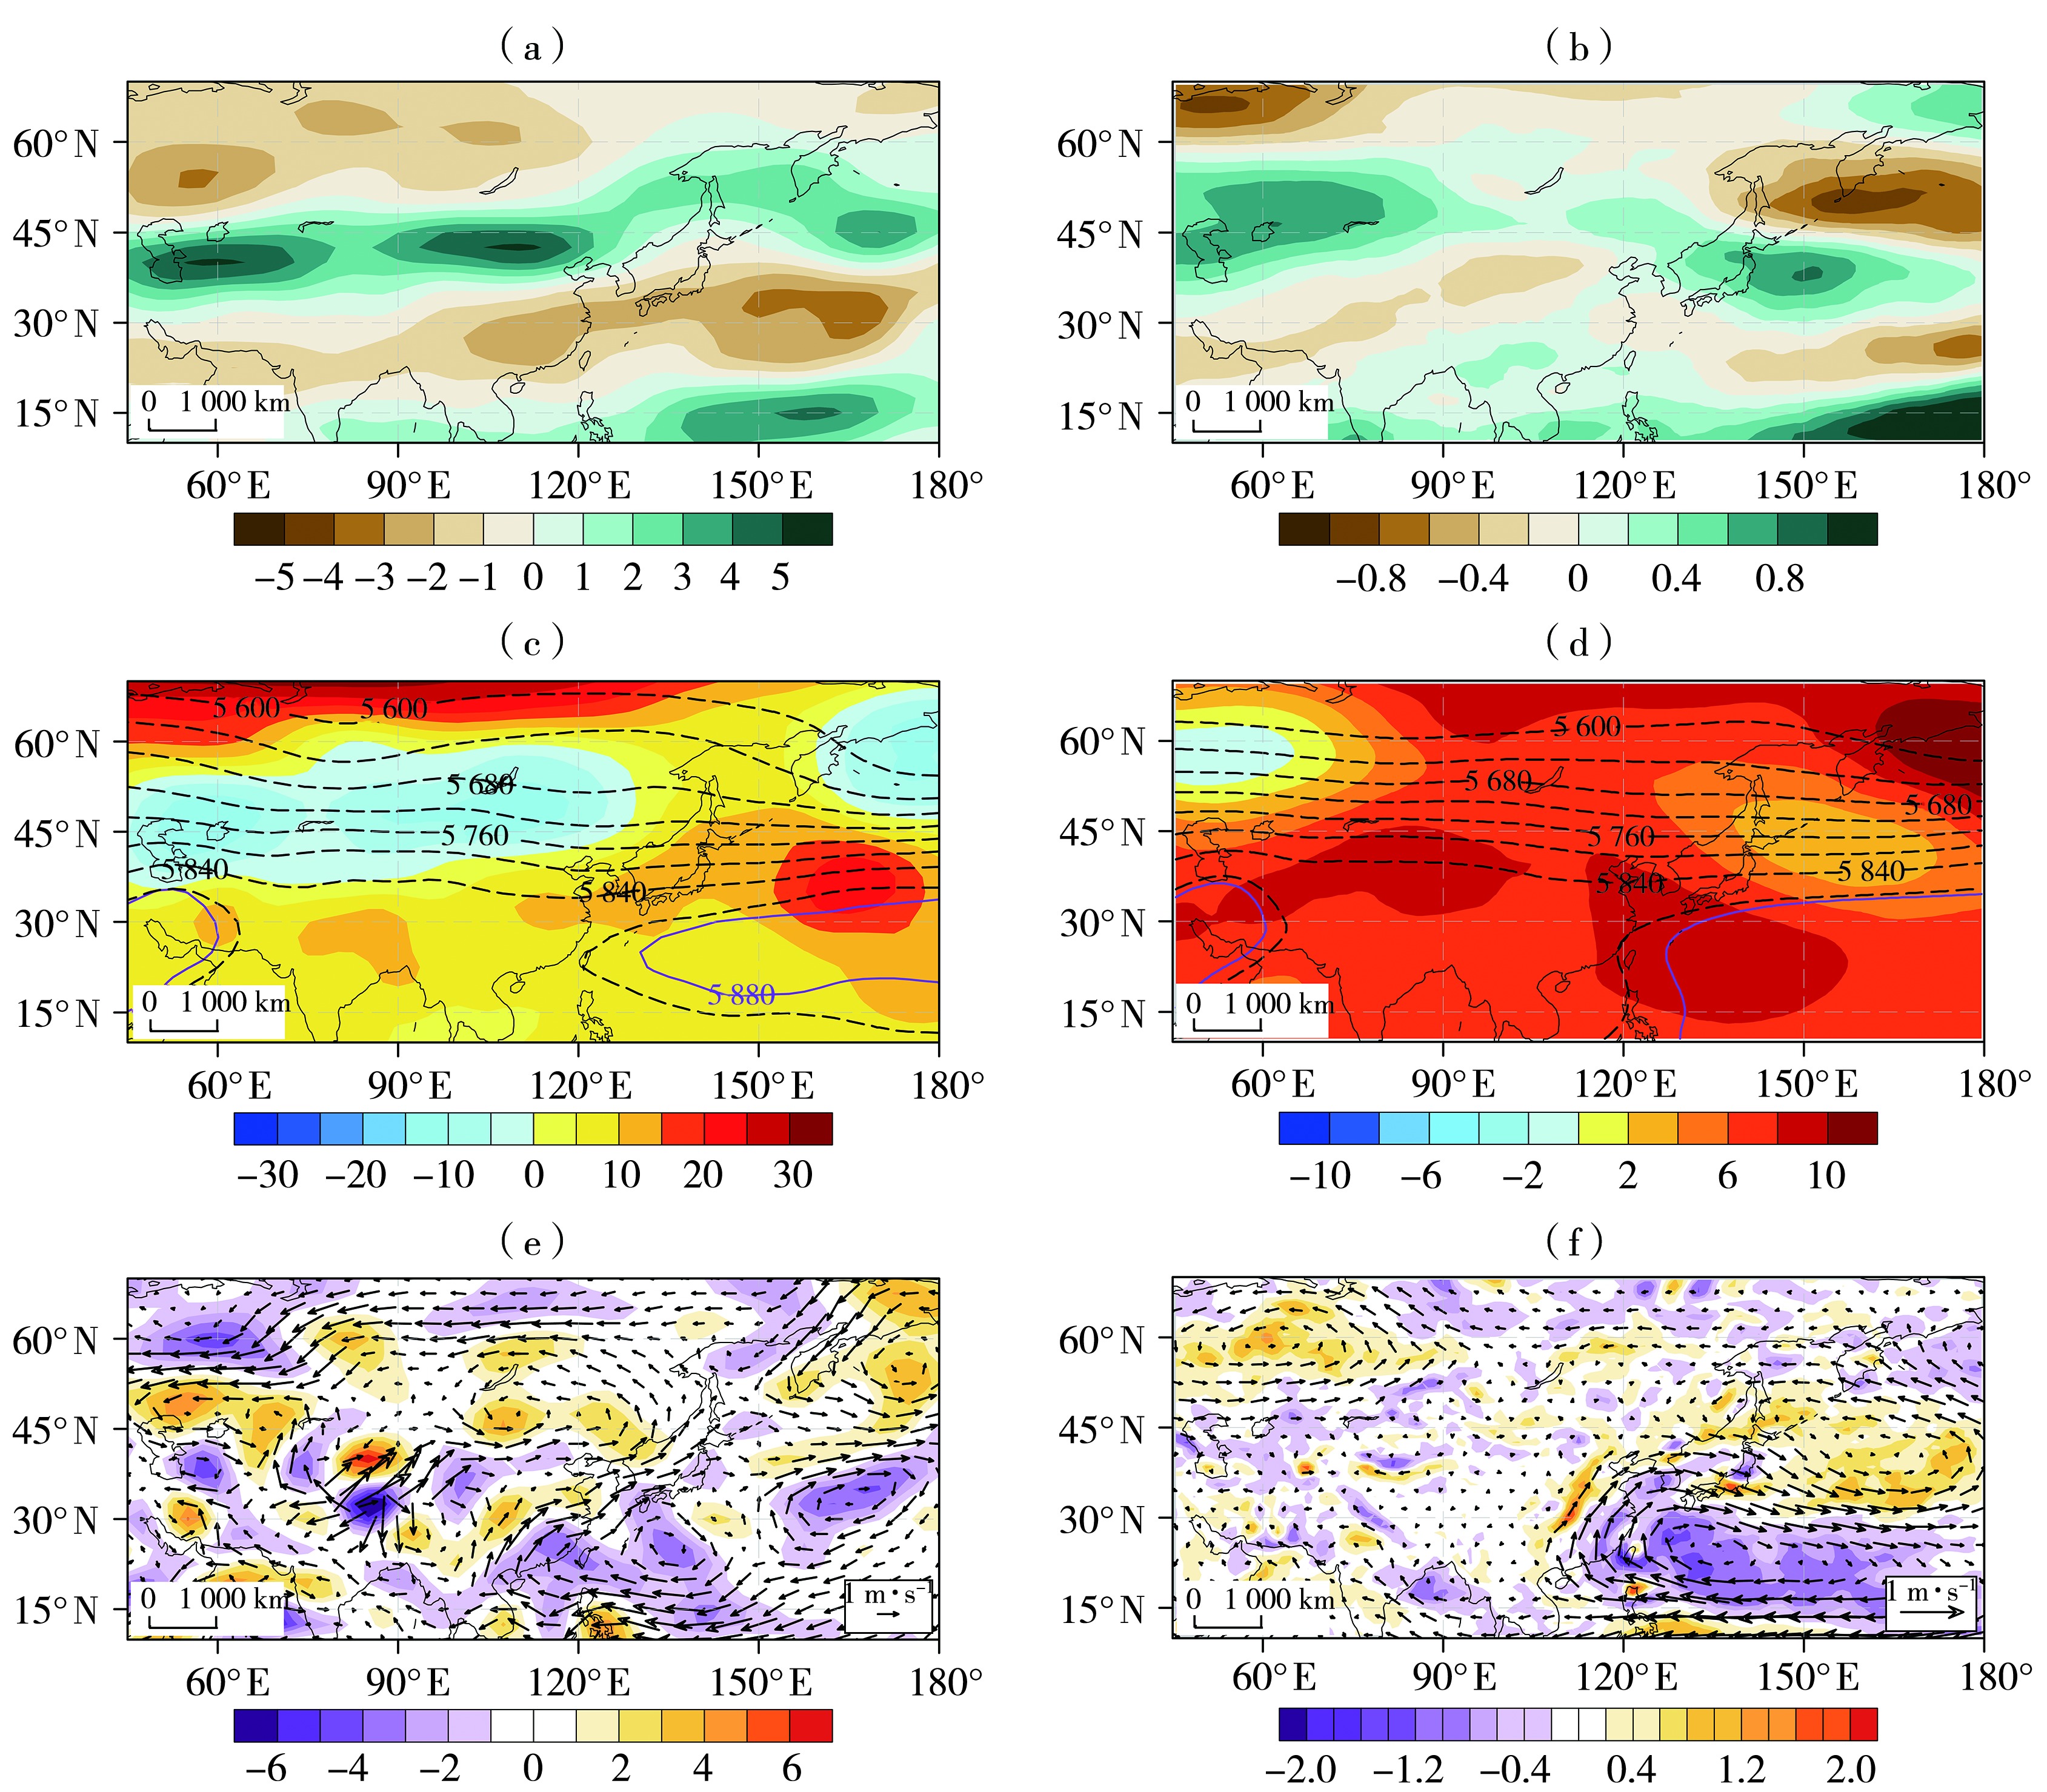
Fig.6 Composite analysis of 200 hPa zonal wind field anomalies (a, b, Unit: m·s-1), 500 hPa geopotential height field (the contour lines) and its anomalies (the color shaded) (c, d, Unit: gpm), 850 hPa horizontal wind field (arrow vectors, Unit: m·s-1) and vorticity (the color shaded, Unit: 10-6 s-1) anomalies (e, f) from observations (a, c, e) and SEAS5 Sf3 forecasts (b, d, f) for high-skill years with above-normal summer precipitation in Heilongjiang during 1993-2023 (The purple line represents the climatological 5 880 gpm geopotential height contour, the same as below)
Fig.6 Composite analysis of 200 hPa zonal wind field anomalies (a, b, Unit: m·s-1), 500 hPa geopotential height field (the contour lines) and its anomalies (the color shaded) (c, d, Unit: gpm), 850 hPa horizontal wind field (arrow vectors, Unit: m·s-1) and vorticity (the color shaded, Unit: 10-6 s-1) anomalies (e, f) from observations (a, c, e) and SEAS5 Sf3 forecasts (b, d, f) for high-skill years with above-normal summer precipitation in Heilongjiang during 1993-2023 (The purple line represents the climatological 5 880 gpm geopotential height contour, the same as below)
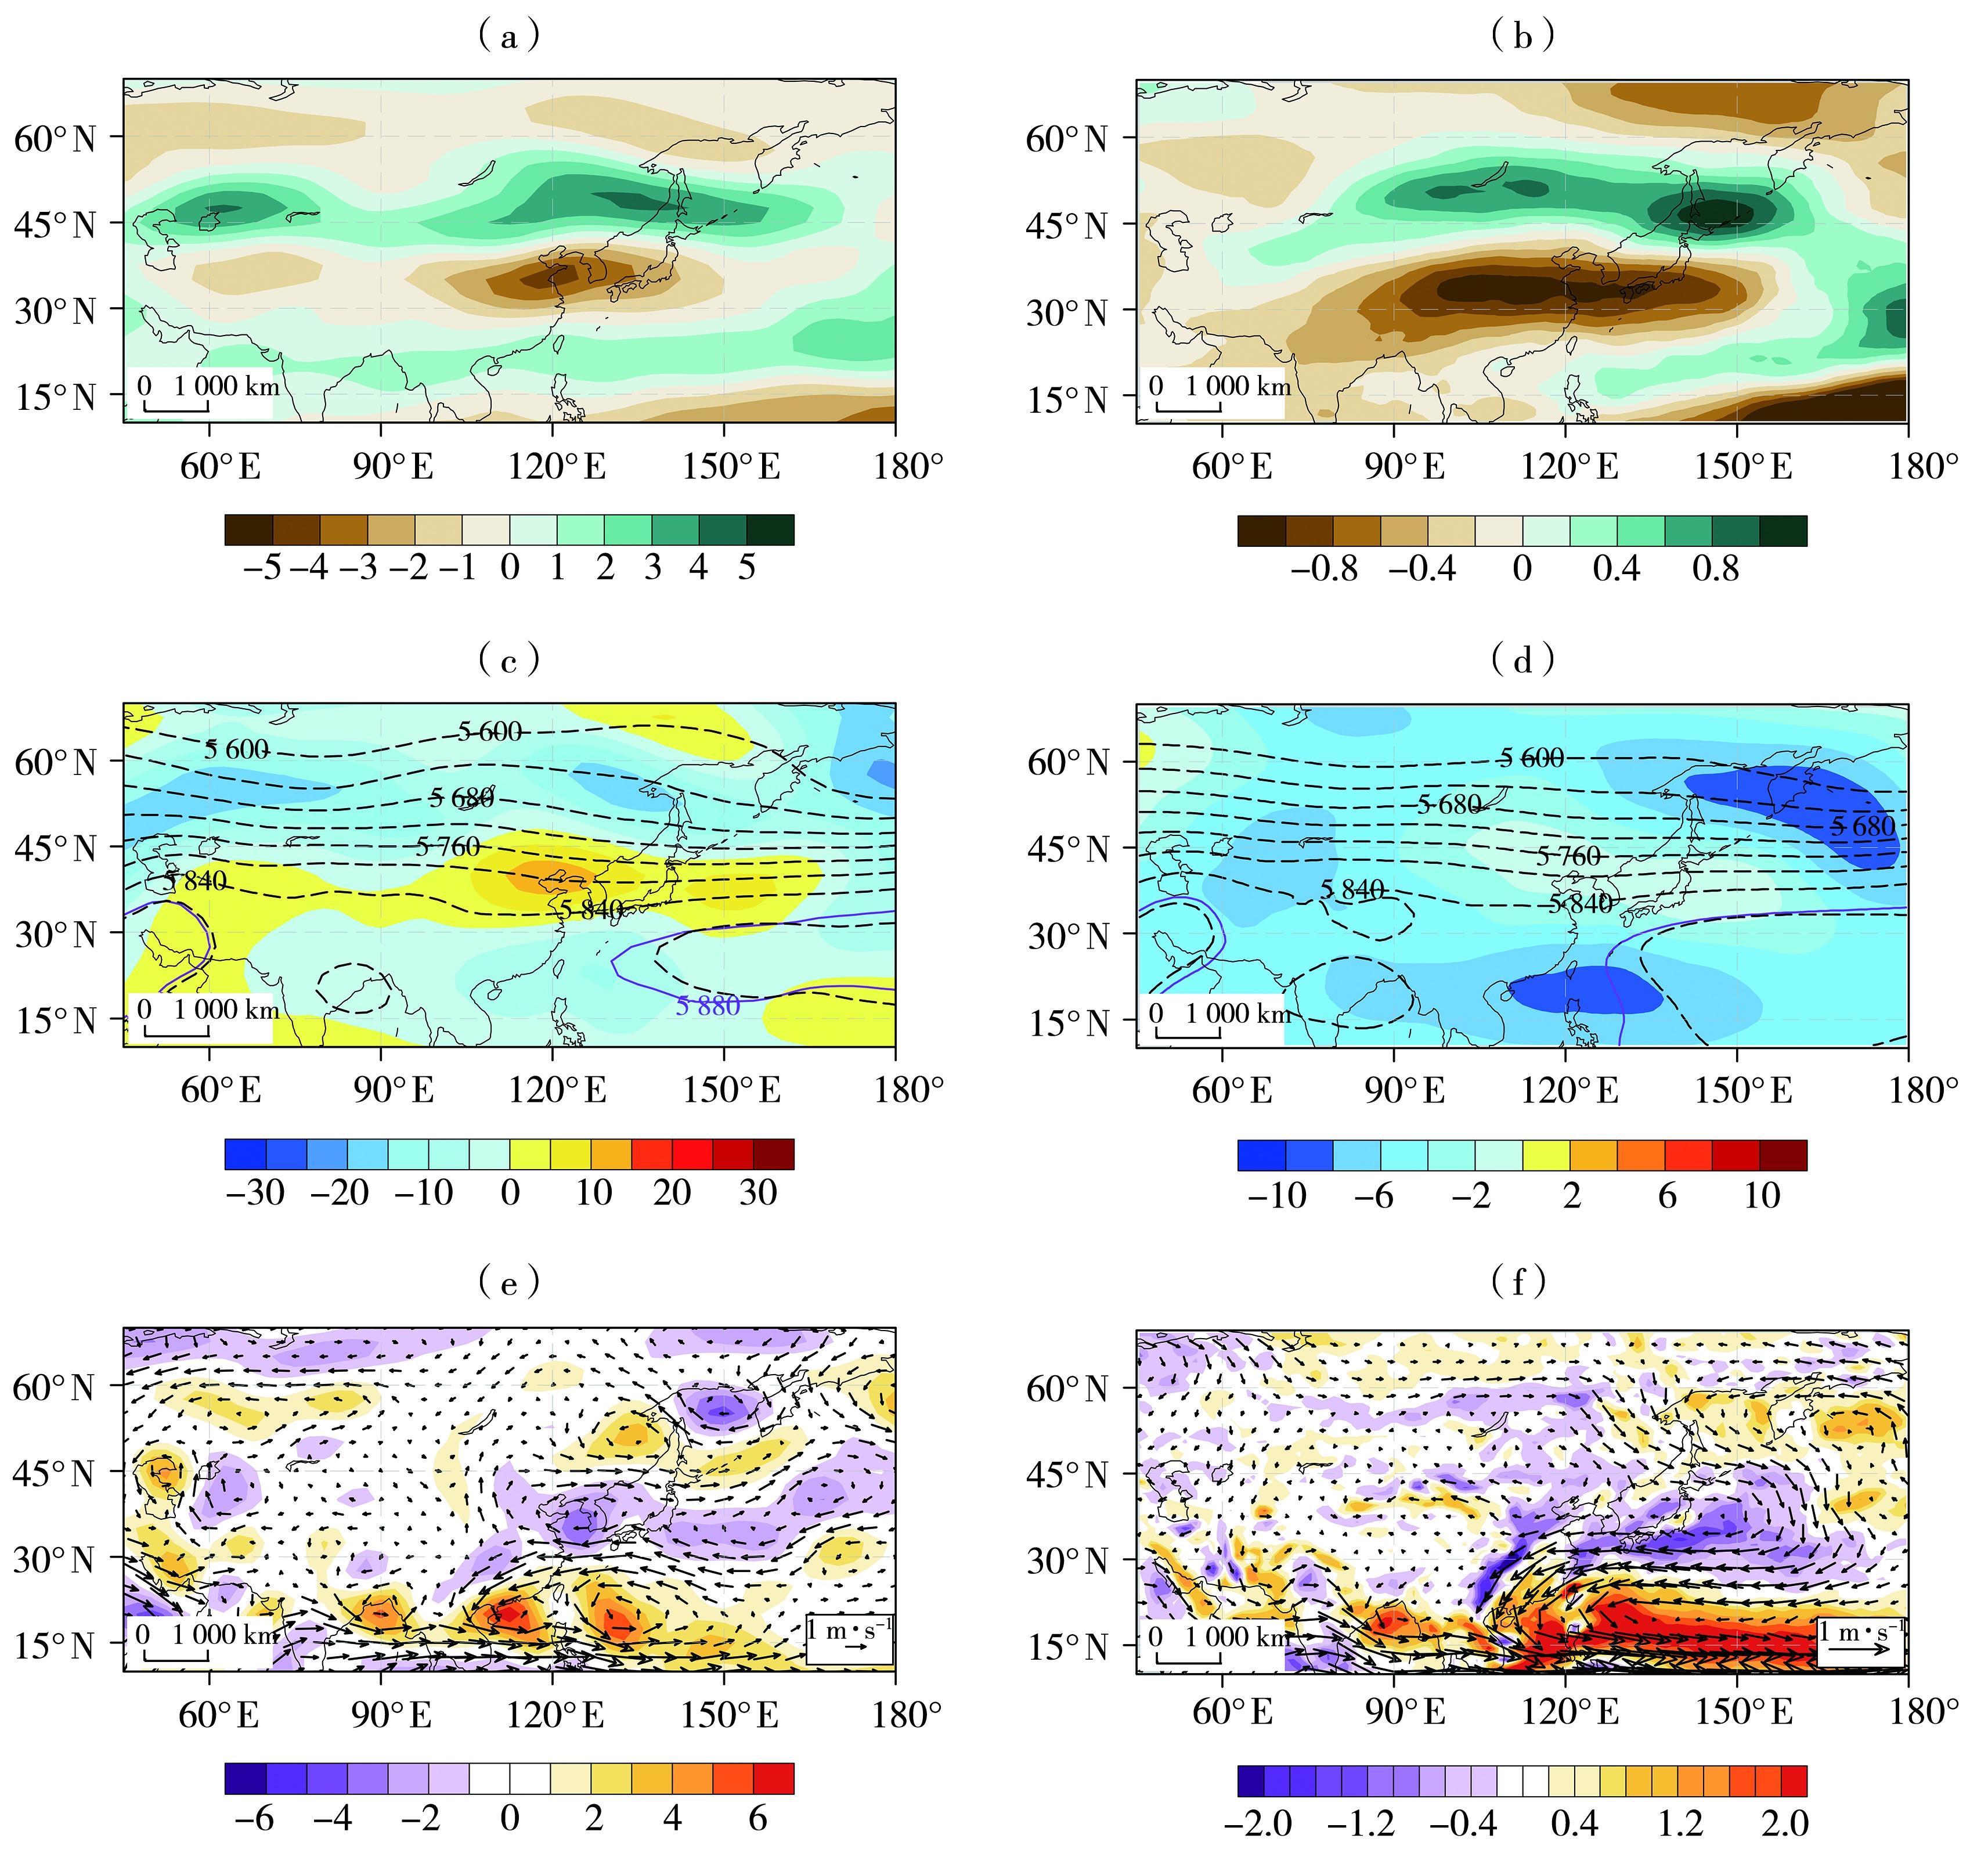
Fig.7 Composite analysis of 200 hPa zonal wind field anomalies (a, b, Unit: m·s-1), 500 hPa geopotential height field (the contour lines) and its anomalies (the color shaded) (c, d, Unit: gpm), 850 hPa horizontal wind field (arrow vectors, Unit: m·s-1) and vorticity (the color shaded, Unit: 10-6 s-1) anomalies (e, f) from observations (a, c, e) and SEAS5 Sf3 forecasts (b, d, f) for low-skill years with above-normal summer precipitation in Heilongjiang during 1993-2023
Fig.7 Composite analysis of 200 hPa zonal wind field anomalies (a, b, Unit: m·s-1), 500 hPa geopotential height field (the contour lines) and its anomalies (the color shaded) (c, d, Unit: gpm), 850 hPa horizontal wind field (arrow vectors, Unit: m·s-1) and vorticity (the color shaded, Unit: 10-6 s-1) anomalies (e, f) from observations (a, c, e) and SEAS5 Sf3 forecasts (b, d, f) for low-skill years with above-normal summer precipitation in Heilongjiang during 1993-2023
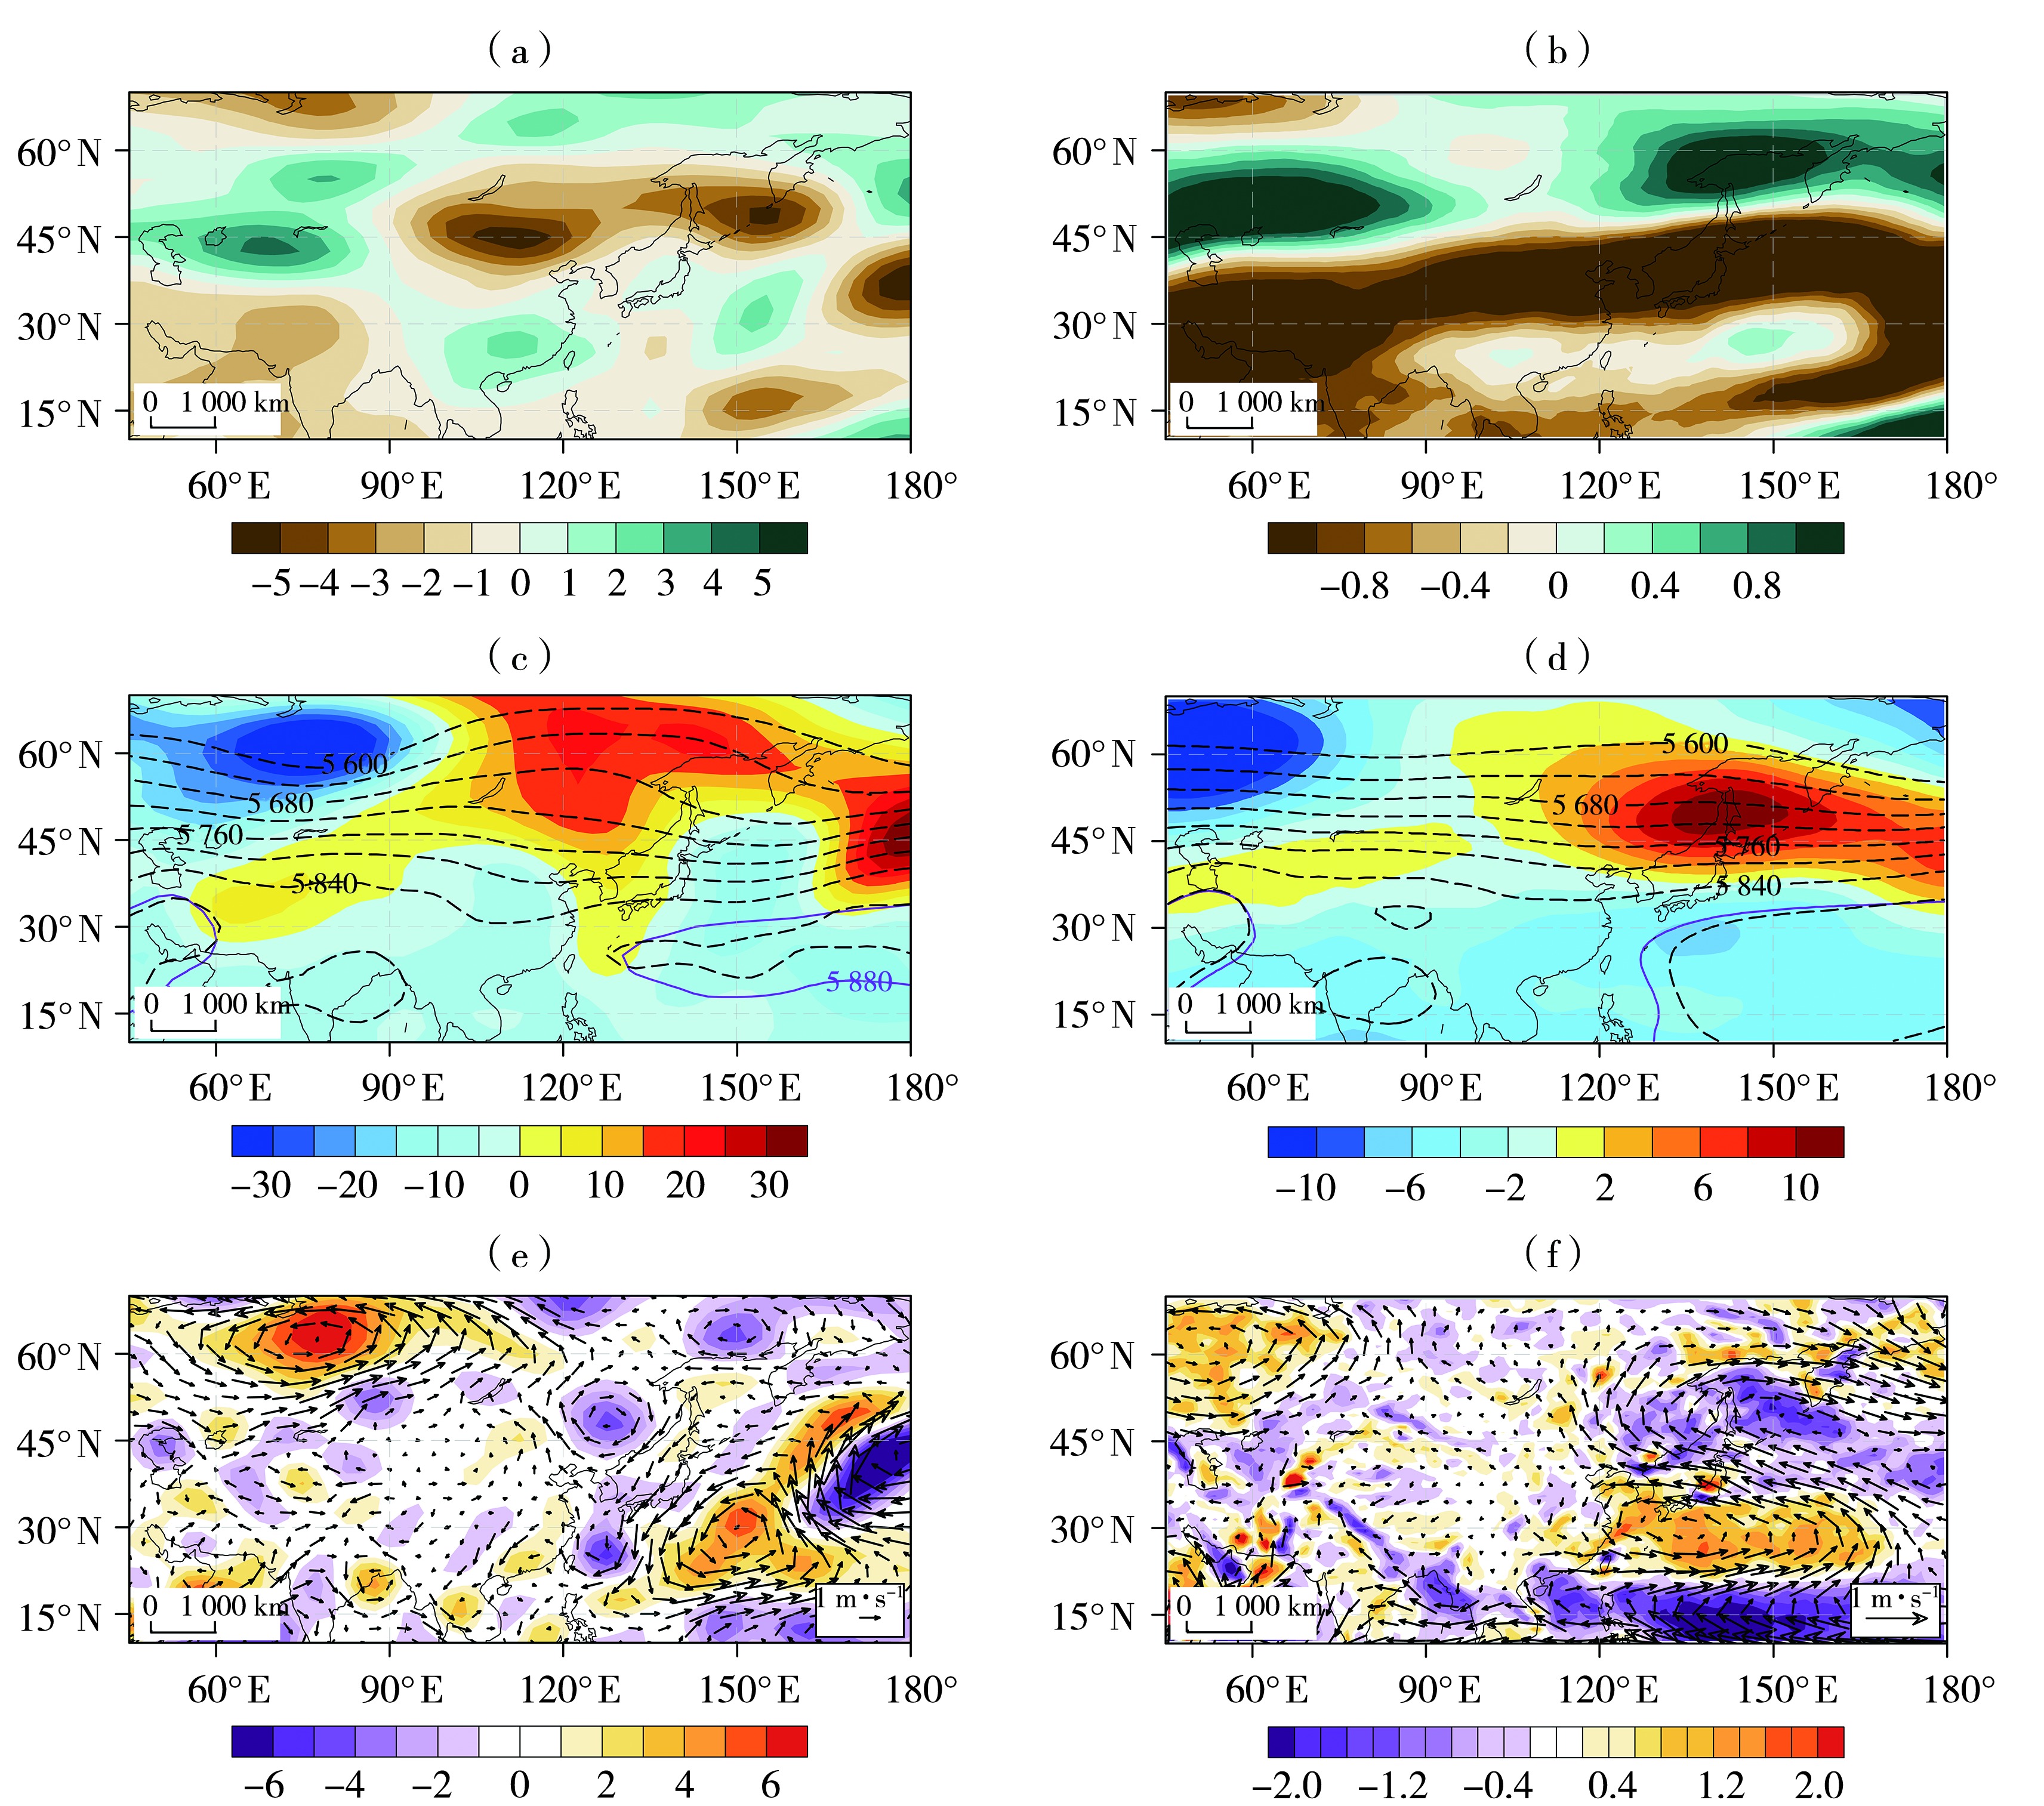
Fig.8 Composite analysis of 200 hPa zonal wind field anomalies (a, b, Unit: m·s-1), 500 hPa geopotential height field (the contour lines) and its anomalies (the color shaded) (c, d, Unit: gpm), 850 hPa horizontal wind field (arrow vectors, Unit: m·s-1) and vorticity (the color shaded, Unit: 10-6 s-1) anomalies (e, f) from observations (a, c, e) and SEAS5 Sf3 forecasts (b, d, f) for high-skill years with below-normal summer precipitation in Heilongjiang during 1993-2023
Fig.8 Composite analysis of 200 hPa zonal wind field anomalies (a, b, Unit: m·s-1), 500 hPa geopotential height field (the contour lines) and its anomalies (the color shaded) (c, d, Unit: gpm), 850 hPa horizontal wind field (arrow vectors, Unit: m·s-1) and vorticity (the color shaded, Unit: 10-6 s-1) anomalies (e, f) from observations (a, c, e) and SEAS5 Sf3 forecasts (b, d, f) for high-skill years with below-normal summer precipitation in Heilongjiang during 1993-2023
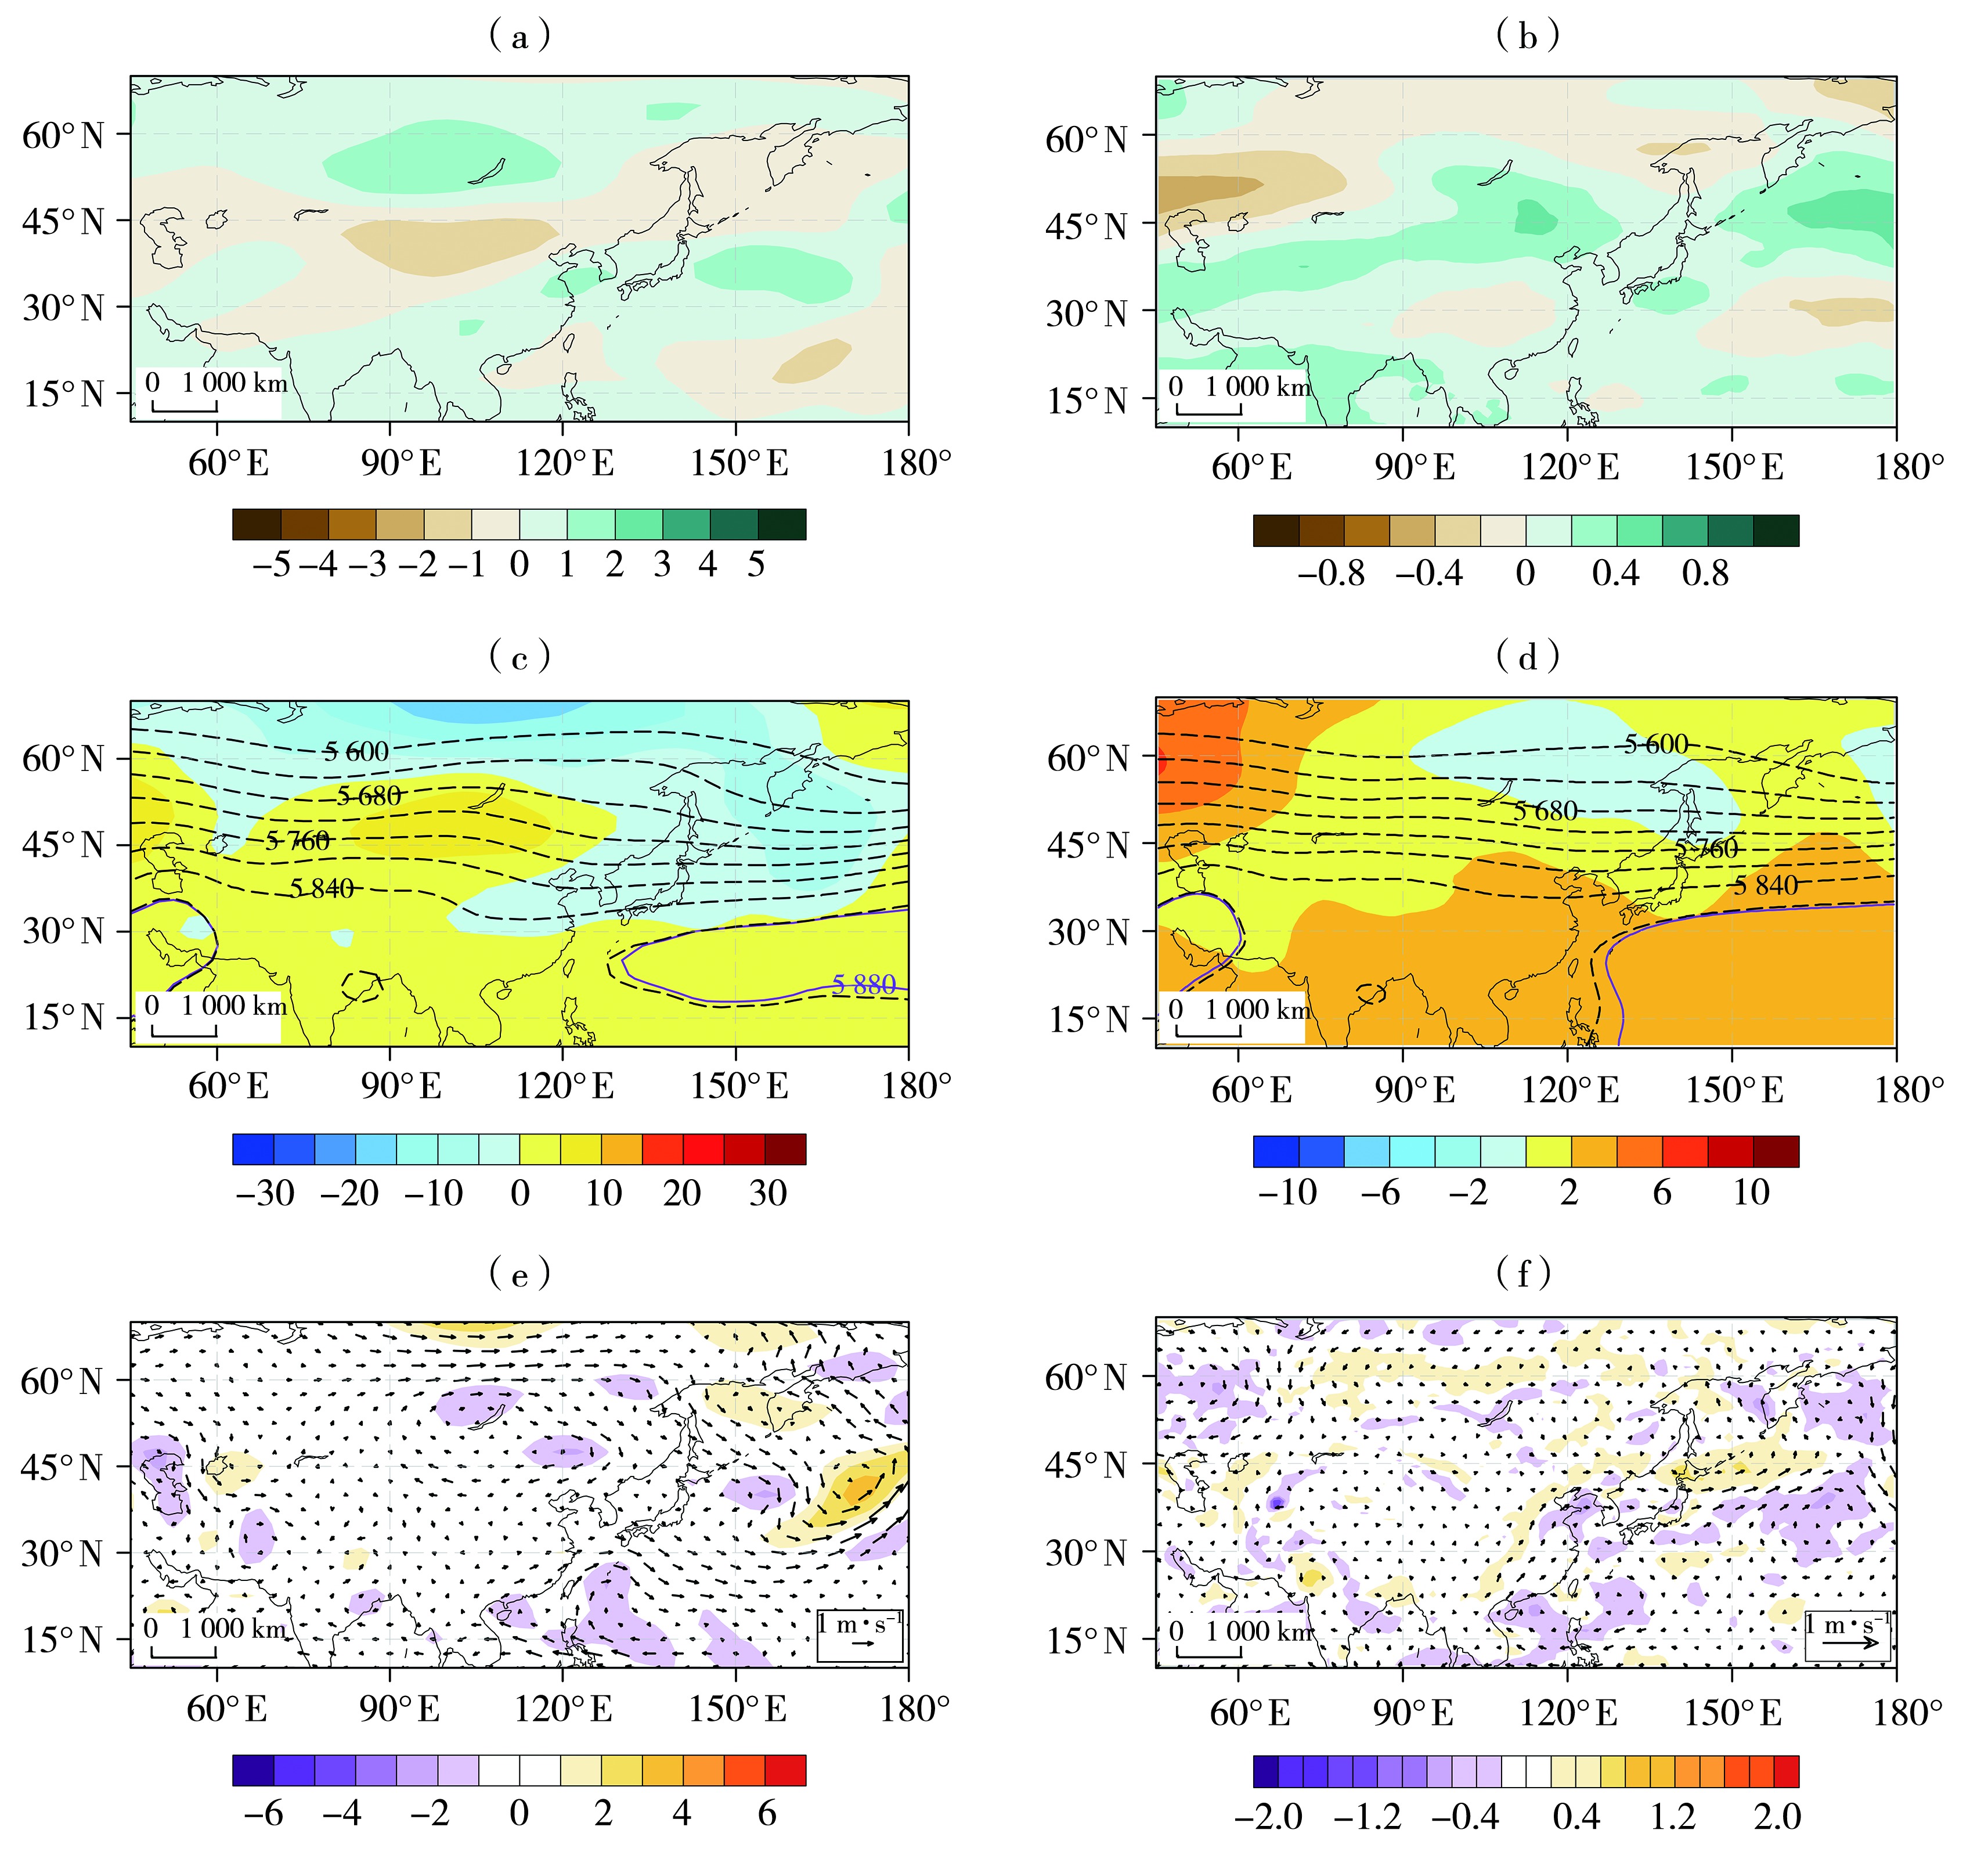
Fig.9 Composite analysis of 200 hPa zonal wind field anomalies (a, b, Unit: m·s-1), 500 hPa geopotential height field (the contour lines) and its anomalies (the color shaded) (c, d, Unit: gpm), 850 hPa horizontal wind field (arrow vectors, Unit: m·s-1) and vorticity (the color shaded, Unit: 10-6 s-1) anomalies (e, f) from observations (a, c, e) and SEAS5 Sf3 forecasts (b, d, f) for low-skill years with below-normal summer precipitation in Heilongjiang during 1993-2023
Fig.9 Composite analysis of 200 hPa zonal wind field anomalies (a, b, Unit: m·s-1), 500 hPa geopotential height field (the contour lines) and its anomalies (the color shaded) (c, d, Unit: gpm), 850 hPa horizontal wind field (arrow vectors, Unit: m·s-1) and vorticity (the color shaded, Unit: 10-6 s-1) anomalies (e, f) from observations (a, c, e) and SEAS5 Sf3 forecasts (b, d, f) for low-skill years with below-normal summer precipitation in Heilongjiang during 1993-2023
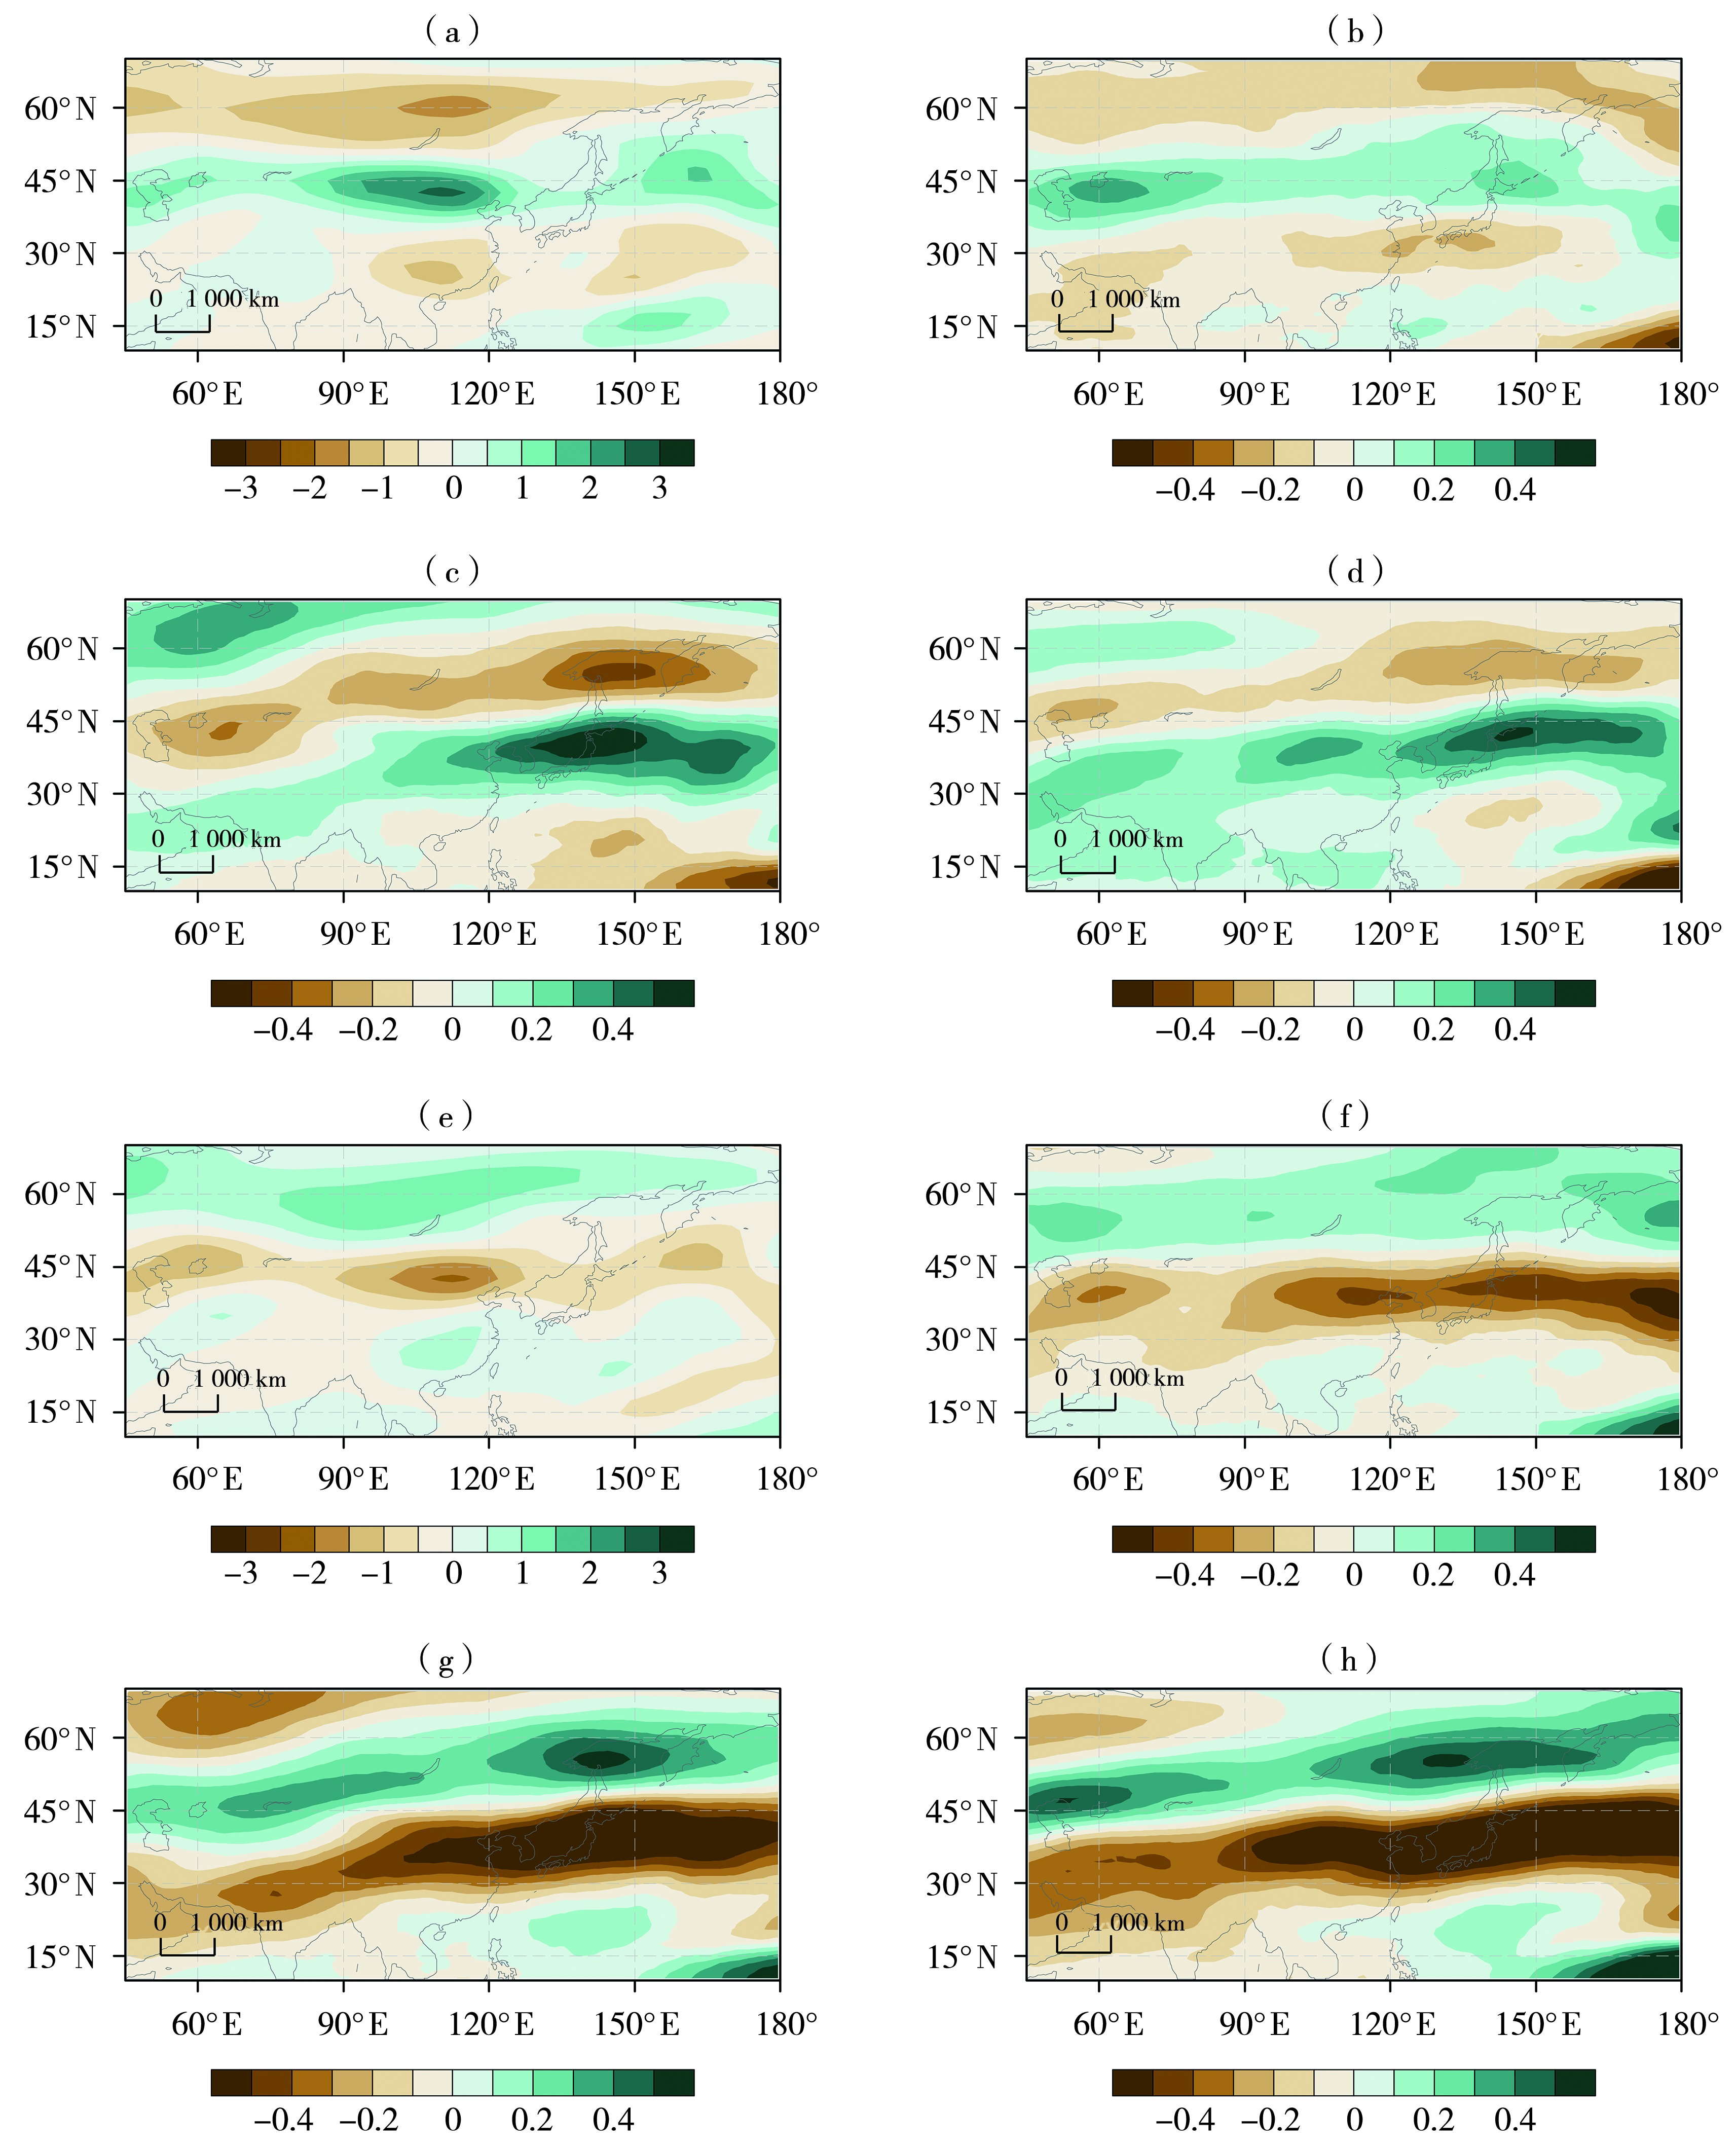
Fig.10 The composite anomalies of 200 hPa zonal wind field of observations (a, e) and SEAS5 forecasts of Sf3 (b, f), Sf4 (c, g), and Sf5 (d, h) for years with above-normal (a, b, c, d) and below-normal (e, f, g, h) summer precipitation in Heilongjiang during 1993-2023 (Unit: m·s-1)
Fig.10 The composite anomalies of 200 hPa zonal wind field of observations (a, e) and SEAS5 forecasts of Sf3 (b, f), Sf4 (c, g), and Sf5 (d, h) for years with above-normal (a, b, c, d) and below-normal (e, f, g, h) summer precipitation in Heilongjiang during 1993-2023 (Unit: m·s-1)
| [1] | 陈明升, 宋敏红, 梁潇云, 等, 2024. CMA-CPSv3对夏季南亚高压和西太副高的预测能力评估[J]. 高原气象, 43(5):1 138-1 151. |
| [2] |
丁婷, 陈丽娟, 崔大海, 2015. 东北夏季降水的年代际特征及环流变化[J]. 高原气象, 34(1):220-229.
DOI |
| [3] | 顾伯辉, 郑志海, 封国林, 等, 2017. 季节预测模式对东亚夏季环流的预测能力及其对热带海洋的响应分析[J]. 大气科学, 41(1):91-105. |
| [4] | 郭渠, 刘向文, 吴统文, 等, 2017. 基于BCC CSM模式的中国东部夏季降水预测检验及订正[J]. 大气科学, 41(1):71-90. |
| [5] | 何慧根, 李巧萍, 吴统文, 等, 2014. 月动力延伸预测模式业务系统DERF2.0对中国气温和降水的预测性能评估[J]. 大气科学, 38(5):950-964. |
| [6] | 何金海, 吴志伟, 祁莉, 等, 2006. 北半球环状模和东北冷涡与我国东北夏季降水关系分析[J]. 气象与环境学报, 22(1):1-5. |
| [7] | 李海燕, 颉卫华, 吴统文, 等, 2023. 天山北坡次季节-季节尺度降水集合预测[J]. 应用气象学报, 34(1):39-51. |
| [8] | 李维京, 1999. 1998年大气环流异常及其对中国气候异常的影响[J]. 气象, 25(4):20-25. |
| [9] | 李永生, 张健, 于梅, 等, 2014. 2013年黑龙江省夏季洪涝灾害成因分析[J]. 气象与环境学报, 30(3):31-37. |
| [10] | 刘长征, 杜良敏, 柯宗建, 等, 2013. 国家气候中心多模式解释应用集成预测[J]. 应用气象学报, 24(6):677-685. |
| [11] |
刘玉莲, 李秀芬, 康恒元, 等, 2025. 1961—2023年黑龙江省多尺度干旱时空特征[J]. 干旱气象, 43(2):186-194.
DOI |
| [12] | 马浩, 于翡, 葛敬文, 等, 2022. CFSv2对2018年浙江梅雨降水多尺度预测的性能评估[J]. 气象科学, 42(5):690-702. |
| [13] | 沈柏竹, 林中达, 陆日宇, 等, 2011. 影响东北初夏和盛夏降水年际变化的环流特征分析[J]. 中国科学:地球科学, 41(3):402-412. |
| [14] | 孙力, 安刚, 丁立, 等, 2000. 中国东北地区夏季降水异常的气候分析[J]. 气象学报, 58(1):70-82. |
| [15] | 孙照渤, 曹蓉, 倪东鸿, 2016. 东北夏季降水分型及其大气环流特征[J]. 大气科学学报, 39(1):18-27. |
| [16] | 汪栩加, 郑志海, 封国林, 等, 2017. 延伸期预报中大气初值与海温边值的相对作用[J]. 气象学报, 75(1):111-122. |
| [17] | 吴黎, 解文欢, 张有智, 等, 2022. 基于温度植被干旱指数的黑龙江省20年干旱时空特征研究[J]. 水土保持研究, 29(5):358-363. |
| [18] | 吴遥, 唐红玉, 蒋兴文, 等, 2024. NCEP CFSv2模式对中国西南月尺度降水预测能力评估[J]. 高原山地气象研究, 44(3):67-75. |
| [19] | 肖颖, 庞轶舒, 马振峰, 等, 2023. NCEP CFSv2模式对川渝夏季降水次季节预测技巧评估及预报偏差分析[J]. 高原气象, 42(6):1 576-1 588. |
| [20] | 张庆云, 陶诗言, 2003. 夏季西太平洋副热带高压异常时的东亚大气环流特征[J]. 大气科学, 27(3):369-380. |
| [21] | 赵俊虎, 熊开国, 陈丽娟, 2020. 东北夏季降水预测技巧偏低的原因探讨[J]. 大气科学, 44(5):913-934. |
| [22] | 赵珊珊, 高歌, 黄大鹏, 等, 2017. 2004—2013年中国气象灾害损失特征分析[J]. 气象与环境学报, 33(1):101-107. |
| [23] | 郑嘉雯, 蔡宏珂, 吴捷, 等, 2021. 三个气候系统模式对500 hPa高度场预报的检验对比分析[J]. 高原山地气象研究, 41(2):115-124. |
| [24] | 周秀杰, 那济海, 潘华盛, 2011. 黑龙江省夏季干旱气候特征及成因分析[J]. 自然灾害学报, 20(5):131-135. |
| [25] |
GUBLER S, SEDLMEIER K, BHEND J, et al, 2019. Assessment of ECMWF SEAS5 seasonal forecast performance over south America[J]. Weather and Forecasting, 35(2): 561-584.
DOI URL |
| [26] |
KALNAY E, KANAMITSU M, KISTLER R, et al, 1996. The NCEP/NCAR 40-year reanalysis project[J]. Bulletin of the American Meteorological Society, 77(3): 437-471.
DOI URL |
| [27] |
LIANG L Q, LI L J, LIU Q, 2011. Precipitation variability in Northeast China from 1961 to 2008[J]. Journal of Hydrology, 404(1/2): 67-76.
DOI URL |
| [28] | LIU B, YANG K, LIU X W, et al, 2023. Improved Indian Ocean dipole seasonal prediction in the new generation of CMA prediction system[J]. Geoscience Letters, 10: 60. DOI:10.1186/s40562-023-00315-5. |
| [29] |
LIU X W, WU T W, YANG S, et al, 2015. Performance of the seasonal forecasting of the Asian summer monsoon by BCC_CSM1.1(m)[J]. Advances in Atmospheric Sciences, 32(8):1 156-1 172.
DOI URL |
| [30] | SUN Y M, SIMPSON I, WEI H L, et al, 2024. Probabilistic seasonal forecasts of North Atlantic atmospheric circulation using complex systems modelling and comparison with dynamical models[J]. Meteorological Applications, 31: e2178. DOI: 10.1002/met.2178. |
| [31] |
TAKEMURA K, MAEDA S, YAMADA K, et al, 2023. Improved predictability of summertime rossby wave breaking frequency near Japan in JMA/MRI-CPS3 seasonal forecasts[J]. Weather and Forecasting, 38(6): 999-1 010.
DOI URL |
| [32] |
WANG B, LEE J Y, KANG I S, et al, 2009. Advance and prospectus of seasonal prediction: Assessment of the APCC/CliPAS 14-model ensemble retrospective seasonal prediction (1980-2004)[J]. Climate Dynamics, 33(1): 93-117.
DOI URL |
| [33] | WANG Q J, SHAO Y W, SONG Y, et al, 2019. An evaluation of ECMWF SEAS5 seasonal climate forecasts for Australia using a new forecast calibration algorithm[J]. Environmental Modelling & Software, 122: 104550. DOI: 10.1016/j.envsoft.2019.104550. |
| [34] |
WU J, REN H L, WAN J H, et al, 2024. Verification of seasonal prediction by the upgraded China multi-model ensemble prediction system (CMMEv2.0)[J]. Journal of Meteorological Research, 38(5): 880-900.
DOI |
| [1] | REN Li, BU Wenhui, YU Zhenyu, BAI Junjie, LI Yao. Analysis of a northeast cold vortex process accompanied by extreme precipitation [J]. Journal of Arid Meteorology, 2025, 43(6): 939-952. |
| [2] | LI Shuping, QUAN Wenjie, WANG Zheng, CHEN Yizhuo, SU Tao, YAN Pengcheng. Evaluation of the ability of BCC-CSM2-MR global climate model in simulating precipitation and temperature in East Asia [J]. Journal of Arid Meteorology, 2023, 41(6): 984-996. |
| [3] | MA Yang, CUI Yang, ZHANG Wen, LI Xin. Projection of the future temperature changes of Yellow River Basin Ningxia section based on CMIP6 models [J]. Journal of Arid Meteorology, 2023, 41(1): 43-53. |
| [4] | REN Li, YANG Yanmin. Dynamic and Thermal Characteristics of a Heavy Rain Caused by MCC at Bottom of Northeast Cold Vortex [J]. Journal of Arid Meteorology, 2021, 39(1): 65-75. |
| [5] | WANG Yahua1,HE Hongrang1,ZANG Zengliang1,PAN Xiaobin1,HE Mianzhong2,LIU Zhehui2. The Kinetic Energy Spectrum Analysis Based on the Global GRAPES Model [J]. Journal of Arid Meteorology, 2015, 33(2): 220-226. |
| [6] | YE Gengxin,LIU Zhuanghua,LIU Guoyu. Characteristic of a Rare Moving Left Supercell Storm [J]. Journal of Arid Meteorology, 2014, 32(3): 431-438. |
| Viewed | ||||||
|
Full text |
|
|||||
|
Abstract |
|
|||||