Journal of Arid Meteorology ›› 2023, Vol. 41 ›› Issue (1): 91-102.DOI: 10.11755/j.issn.1006-7639(2023)-01-0091
• Articles • Previous Articles Next Articles
Effect of different boundary layer parameterization schemes on simulation of the heavy rainfall during Typhoon In-Fa(2106) moving northward period
XING Rui1,2( ), YANG Jianbo1,3(), TIAN Meng1,3, QIU Xiaobin1,3, ZHUANG Ting4, ZHU Xiaojing2
- 1. Tianjin Key Laboratory of Oceanic Meteorology, Tianjin 300074, China
2. Tianjin Binhai New Area Meteorological Service, Tianjin 300457, China
3. Tianjin Institute of Meteorological Science, Tianjin 300074, China
4. Tianjin Meteorological Observation Centre, Tianjin 300061, China
-
Received:2022-05-10Revised:2022-10-25Online:2023-02-28Published:2023-02-28
不同边界层参数化方案对台风“烟花”北上阶段暴雨模拟的影响试验
邢蕊1,2(), 杨健博1,3(), 田梦1,3, 邱晓滨1,3, 庄庭4, 朱晓晶2
- 1.天津市海洋气象重点实验室,天津 300074
2.天津市滨海新区气象局,天津 300457
3.天津市气象科学研究所,天津 300074
4.天津市气象探测中心,天津 300061
-
通讯作者:杨健博(1989—),男,博士,高级工程师,主要从事大气边界层数值模拟及相关研究。E-mail: iamyjb.happy@163.com。
-
作者简介:邢蕊(1985—),女,博士,高级工程师,主要从事台风和灾害性天气高分辨率数值模拟的研究。E-mail:nuistxr@163.com。 -
基金资助:天津市海洋气象重点实验室开放基金项目(2022TKLOM05);天津市自然科学基金项目(20JCYBJC00780);环渤海区域科技协同创新基金项目(QYXM202112);天津市气象局科研项目(202114zdxm01);天津市气象局科研项目(202115dgxm04);天津市气象局科研项目(202226dgxm05)
CLC Number:
Cite this article
XING Rui, YANG Jianbo, TIAN Meng, QIU Xiaobin, ZHUANG Ting, ZHU Xiaojing. Effect of different boundary layer parameterization schemes on simulation of the heavy rainfall during Typhoon In-Fa(2106) moving northward period[J]. Journal of Arid Meteorology, 2023, 41(1): 91-102.
邢蕊, 杨健博, 田梦, 邱晓滨, 庄庭, 朱晓晶. 不同边界层参数化方案对台风“烟花”北上阶段暴雨模拟的影响试验[J]. 干旱气象, 2023, 41(1): 91-102.
share this article
Add to citation manager EndNote|Ris|BibTeX
URL: http://www.ghqx.org.cn/EN/10.11755/j.issn.1006-7639(2023)-01-0091
Tab.1 Designs for numerical experiments
| 试验名称 | 边界层参数化方案 | 地面层参数化方案 |
|---|---|---|
| ACM2 | 非局地向上混合与局地向下混合的ACM2方案 | Revised MM5 Monin-Obukhov方案 |
| BouLac | Bougeault 和 Lacarrere (BouLac)湍流动能方案 | Revised MM5 Monin-Obukhov方案 |
| GBM | GBM TKE-type 方案 | Revised MM5 Monin-Obukhov方案 |
| MYJ | Mellor-Yamada-Janjic (Eta)湍流动能方案 | Monin-Obukhov (Janjic Eta)方案 |
| MYNN | MYNN 2.5阶湍流动能方案 | Revised MM5 Monin-Obukhov方案 |
| QNSE | 准正态尺度消除方案QNSE | 准正态尺度消除方案QNSE |
| UW | Bretherton-Park/UW 湍流动能方案 | Revised MM5 Monin-Obukhov方案 |
| YSU | Yonsei University参数化方案 | Revised MM5 Monin-Obukhov方案 |
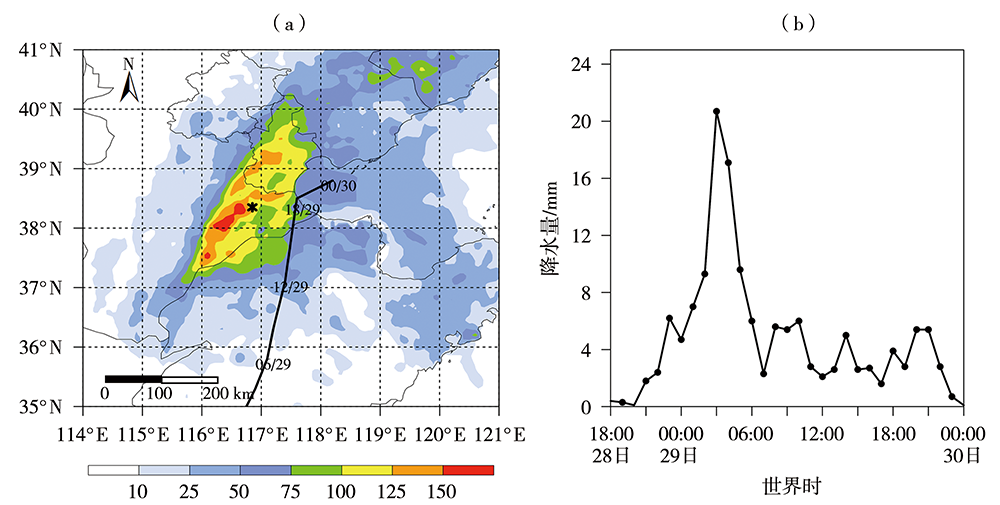
Fig.1 The distribution of observed 24 h accumulated rainfall (the color shaded, Unit: mm) and the typhoon track (the black solid line) during its northward period from 00:00 July 29 to 00:00 July 30, 2021 (a) and hourly rainfall evolution at Cangzhou weather station from 18:00 July 28 to 00:00 July 30, 2021 (b) (The asterisk in fig.1a denotes Cangzhou weather station, and the number 06/29 in fig.1a indicates 06:00 July 29, others are in a similar fashion. the same as below)
Fig.1 The distribution of observed 24 h accumulated rainfall (the color shaded, Unit: mm) and the typhoon track (the black solid line) during its northward period from 00:00 July 29 to 00:00 July 30, 2021 (a) and hourly rainfall evolution at Cangzhou weather station from 18:00 July 28 to 00:00 July 30, 2021 (b) (The asterisk in fig.1a denotes Cangzhou weather station, and the number 06/29 in fig.1a indicates 06:00 July 29, others are in a similar fashion. the same as below)
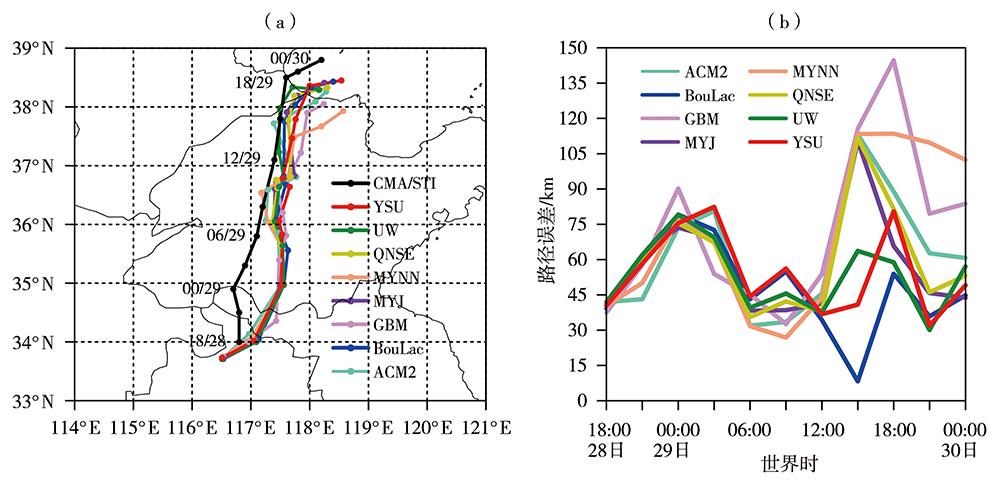
Fig.2 The typhoon tracks observed and simulated by 8 sets of test schemes (a) and track errors (b)from 18:00 July 28 to 00:00 July 30, 2021
Fig.2 The typhoon tracks observed and simulated by 8 sets of test schemes (a) and track errors (b)from 18:00 July 28 to 00:00 July 30, 2021

Fig.3 The 24 h accumulated precipitation observed and simulated by 8 sets of test schemes from 00:00 July 29 to 00:00 July 30, 2021 in the D01 region (Unit: mm) (The number on the upper left brackets denotes the maximum 24 h accumulated precipitation, the black cross denotes the location of maximum rainfall, and the black rectangle (115.5°E—118°E, 37.2°N—40.2°N) denotes the main precipitation area)
Fig.3 The 24 h accumulated precipitation observed and simulated by 8 sets of test schemes from 00:00 July 29 to 00:00 July 30, 2021 in the D01 region (Unit: mm) (The number on the upper left brackets denotes the maximum 24 h accumulated precipitation, the black cross denotes the location of maximum rainfall, and the black rectangle (115.5°E—118°E, 37.2°N—40.2°N) denotes the main precipitation area)
Tab.2 The main rainfall area averaged 24 h accumulated precipitation and maximum rainfall simulated by 8 sets of test schemes and the range between the locations of simulated and observed maximum precipitation
| 试验 | 区域平均24 h 降水量/mm | 最大降水量 /mm | 模拟与实况最大降水量区域间 距离/km |
|---|---|---|---|
| ACM2 | 54.7 | 151.1 | 99.9 |
| BouLac | 51.1 | 131.2 | 56.3 |
| GBM | 46.3 | 121.4 | 56.3 |
| MYJ | 52.0 | 141.2 | 76.7 |
| MYNN | 53.0 | 143.7 | 76.7 |
| QNSE | 54.9 | 143.1 | 159.0 |
| UW | 55.0 | 173.4 | 36.1 |
| YSU | 48.2 | 140.2 | 36.1 |
Tab.3 Equitable threat scores of 24 h accumulated rainfall with different levels simulated by 8 sets of test schemes
| 降水量级 | 试验 | |||||||
|---|---|---|---|---|---|---|---|---|
| ACM2 | BouLac | GBM | MYJ | MYNN | QNSE | UW | YSU | |
| 大于等于10.0 mm | 0.590 3 | 0.650 2* | 0.616 6 | 0.557 3 | 0.544 4 | 0.616 6 | 0.574 3 | 0.382 0 |
| 大于等于25.0 mm | 0.634 2* | 0.559 4 | 0.409 2 | 0.616 0 | 0.592 4 | 0.592 4 | 0.587 7 | 0.545 9 |
| 大于等于50.0 mm | 0.564 6* | 0.488 7 | 0.253 9 | 0.447 4 | 0.463 6 | 0.430 3 | 0.481 2 | 0.499 1 |
| 大于等于100.0 mm | 0.136 6* | 0.059 9 | -0.009 2 | 0.051 9 | -0.012 9 | 0.023 8 | -0.010 2 | 0.047 6 |
Tab.4 Bias scores of 24 h accumulated rainfall with different levels simulated by 8 sets of test schemes
| 降水量级 | 试验 | |||||||
|---|---|---|---|---|---|---|---|---|
| ACM2 | BouLac | GBM | MYJ | MYNN | QNSE | UW | YSU | |
| 大于等于10.0 mm | 0.937 2 | 0.941 7 | 0.955 2 | 0.950 7 | 0.923 8 | 0.955 2 | 0.932 7 | 0.843 0 |
| 大于等于25.0 mm | 1.018 0 | 1.053 9 | 1.185 6 | 1.059 9 | 1.059 9 | 1.059 9 | 1.018 0 | 1.006 0 |
| 大于等于50.0 mm | 0.992 4 | 1.083 3 | 0.947 0 | 1.000 0 | 1.030 3 | 1.030 3 | 1.015 2 | 1.000 0 |
| 大于等于100.0 mm | 0.696 4 | 0.410 7 | 0.125 0 | 0.517 9 | 0.392 9 | 0.660 7 | 0.625 0 | 0.321 4 |
Tab.5 Rankings of typhoon track and equitable threat score of 24 h accumulated precipitation with different levels simulated by 8 sets of test schemes
| 台风路径排名 | 不同降水量级ETS评分排名 | ||||
|---|---|---|---|---|---|
| 大于等于10.0 mm | 大于等于25.0 mm | 大于等于50.0 mm | 大于等于100.0 mm | ||
| 1 | BouLac | BouLac | ACM2 | ACM2 | ACM2 |
| 2 | UW | GBM | MYJ | YSU | BouLac |
| 3 | YSU | QNSE | MYNN | BouLac | MYJ |
| 4 | MYJ | ACM2 | QNSE | UW | YSU |
| 5 | QNSE | UW | UW | MYNN | QNSE |
| 6 | ACM2 | MYJ | BouLac | MYJ | GBM |
| 7 | MYNN | MYNN | YSU | QNSE | UW |
| 8 | GBM | YSU | GBM | GBM | MYNN |
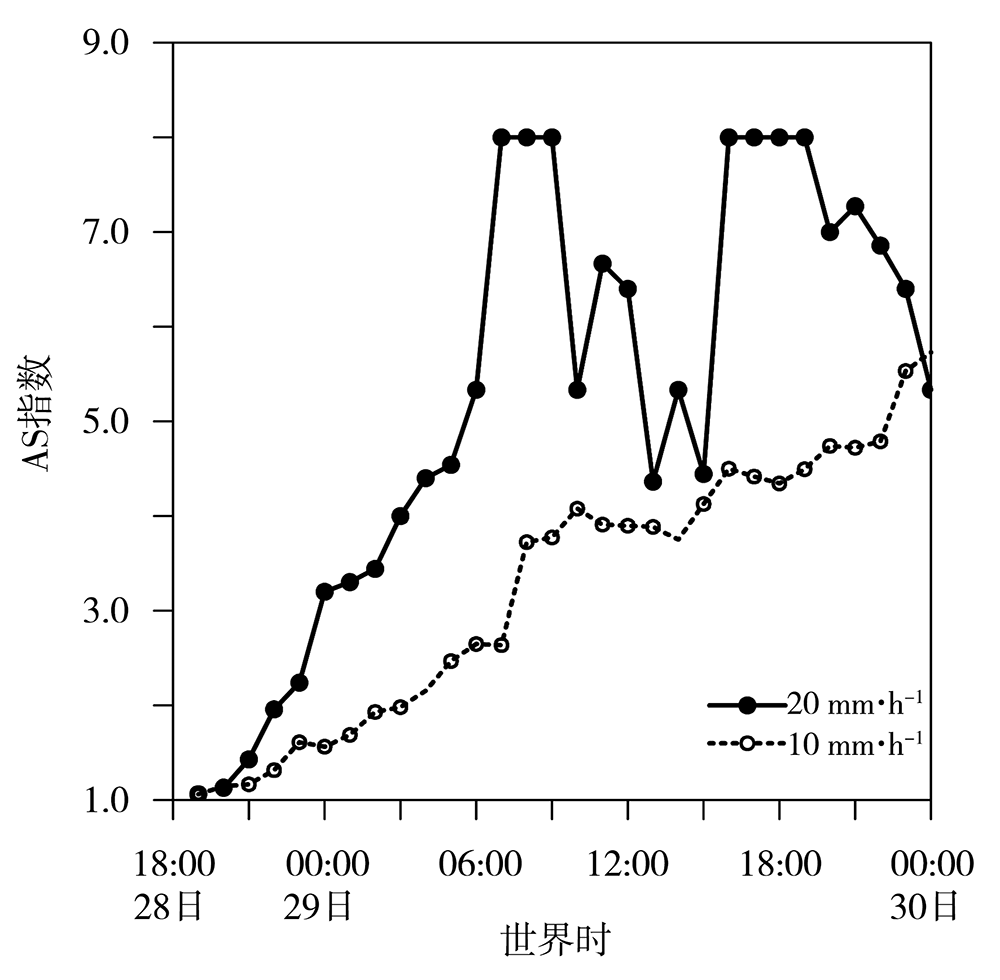
Fig.4 The variation of AS index for 10.0 and 20.0 mm·h-1 rainfall intensity simulated by 8 sets of test schemes from 18:00 July 28 to 00:00 July 30, 2021
Fig.4 The variation of AS index for 10.0 and 20.0 mm·h-1 rainfall intensity simulated by 8 sets of test schemes from 18:00 July 28 to 00:00 July 30, 2021
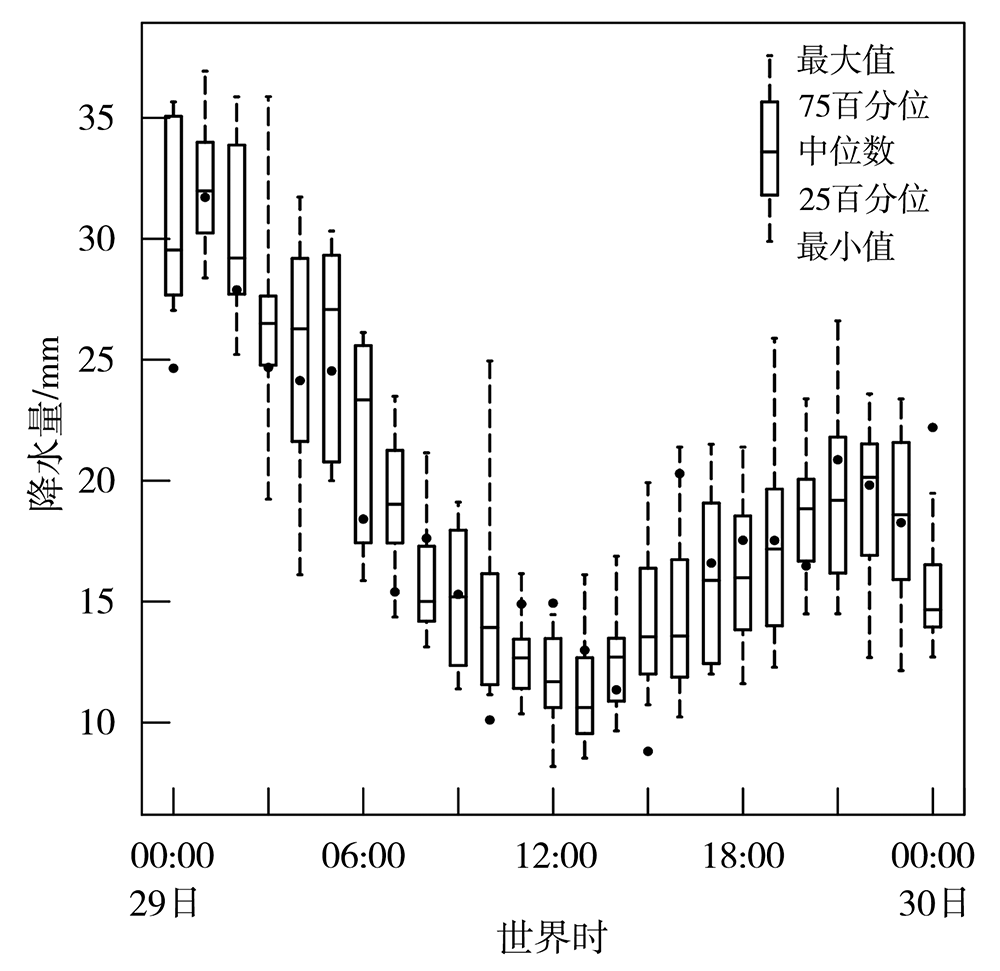
Fig.5 The box plots for hourly maximum precipitation varying with time simulated by 8 sets of test schemes from 00:00 July 29 to 00:00 July 30, 2021 (The black dots denote the hourly maximum precipitation from CMPAS data)
Fig.5 The box plots for hourly maximum precipitation varying with time simulated by 8 sets of test schemes from 00:00 July 29 to 00:00 July 30, 2021 (The black dots denote the hourly maximum precipitation from CMPAS data)
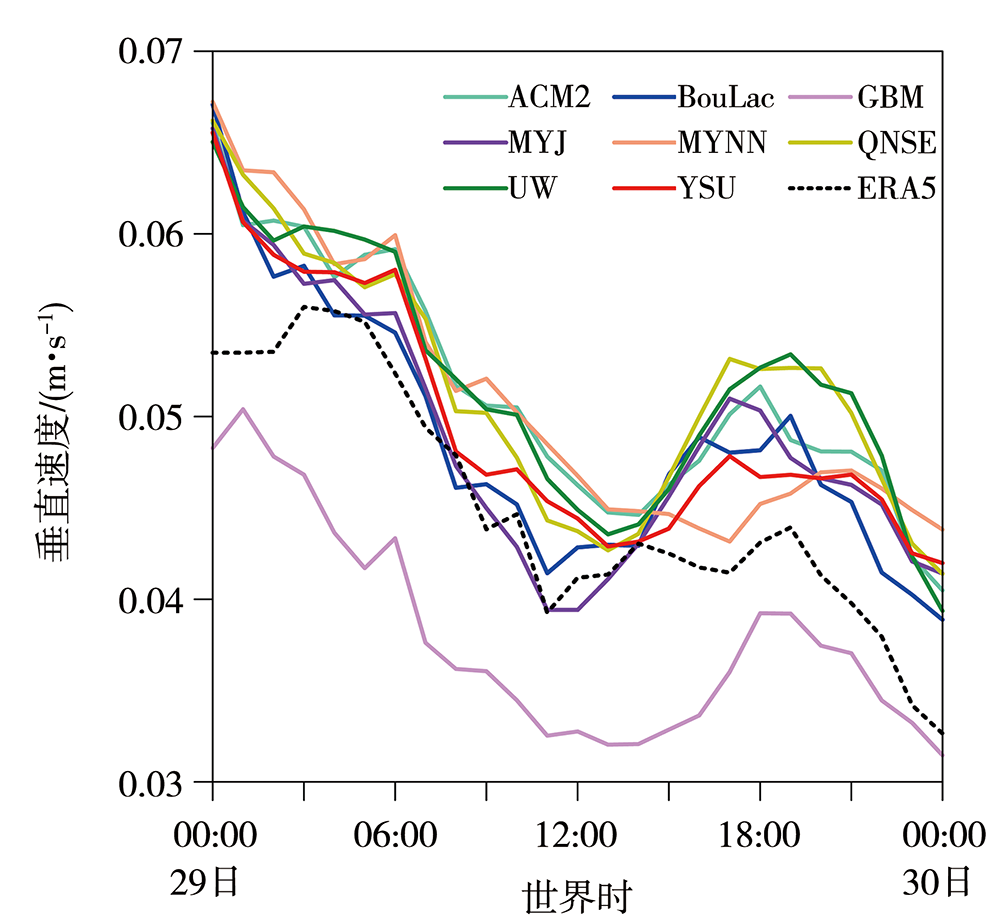
Fig.6 Time series of area mean 700 hPa positive vertical velocity from simulated data of 8 sets of test schemes and ERA5 data from 00:00 July 29 to 00:00 July 30, 2021 (The region selected to calculate the mean value is the 400 km radius north of the latitude of typhoon center in real data and simulation results)
Fig.6 Time series of area mean 700 hPa positive vertical velocity from simulated data of 8 sets of test schemes and ERA5 data from 00:00 July 29 to 00:00 July 30, 2021 (The region selected to calculate the mean value is the 400 km radius north of the latitude of typhoon center in real data and simulation results)
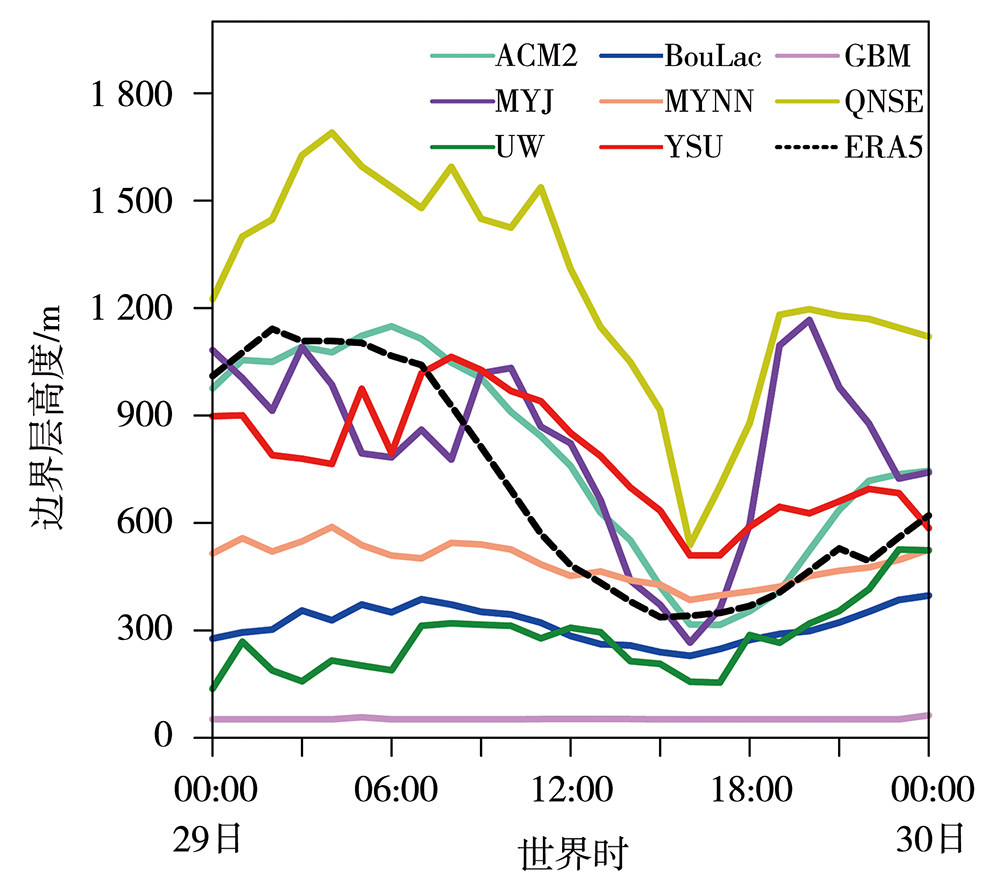
Fig.7 The time series of mean planetary boundary layer height from ERA5 data and simulated data of 8 sets of test schemes averaged on the region of 117.0°E-117.4°E, 38.0°N-38.4°N from 00:00 July 29 to 00:00 July 30, 2021
Fig.7 The time series of mean planetary boundary layer height from ERA5 data and simulated data of 8 sets of test schemes averaged on the region of 117.0°E-117.4°E, 38.0°N-38.4°N from 00:00 July 29 to 00:00 July 30, 2021
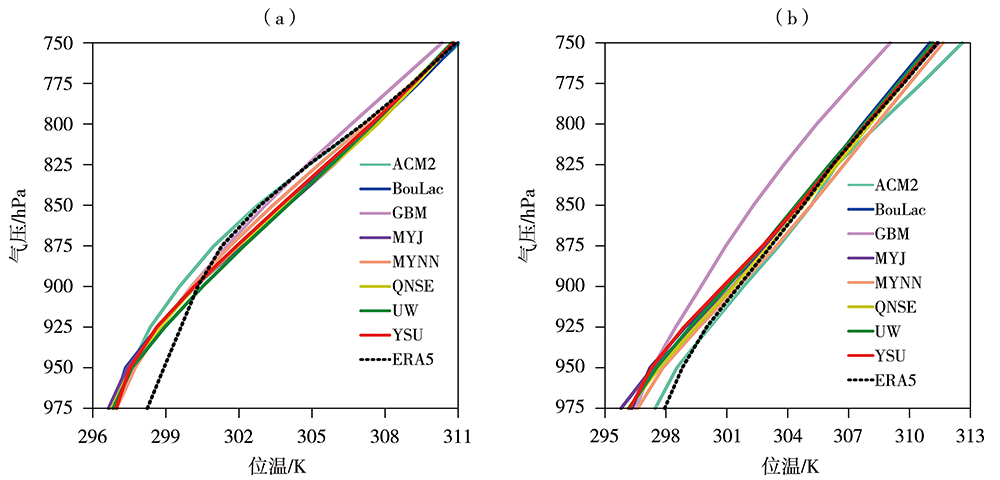
Fig.8 The profiles of potential temperature averaged on the region of 117.0°E-117.4°E, 38.0°N-38.4°N from ERA5 data and simulated data of 8 sets of test schemes at 06:00 (a) and 18:00 (b) July 29, 2021
Fig.8 The profiles of potential temperature averaged on the region of 117.0°E-117.4°E, 38.0°N-38.4°N from ERA5 data and simulated data of 8 sets of test schemes at 06:00 (a) and 18:00 (b) July 29, 2021
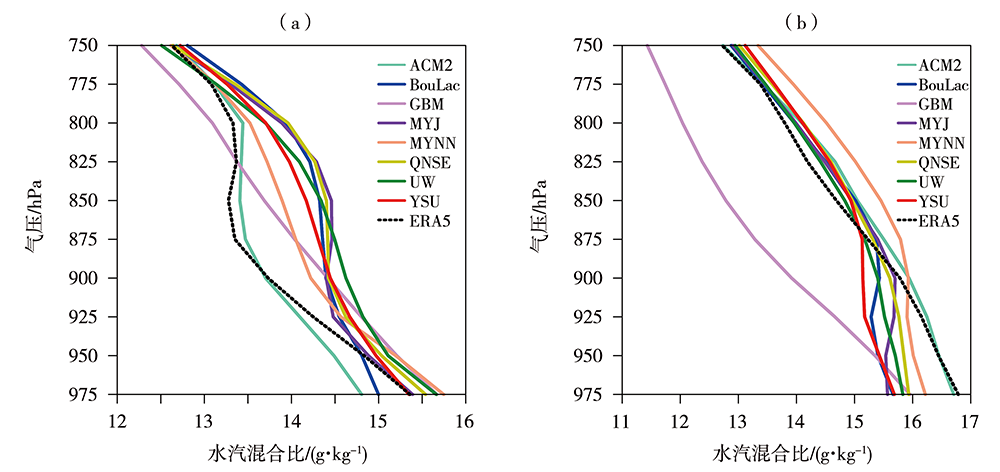
Fig.9 The profiles of water vapor mixing ratio averaged on the region of 117.0°E-117.4°E, 38.0°N-38.4°N from ERA5 data and simulated data of 8 sets of test schemes at 06:00 (a) and 18:00 (b) July 29, 2021
Fig.9 The profiles of water vapor mixing ratio averaged on the region of 117.0°E-117.4°E, 38.0°N-38.4°N from ERA5 data and simulated data of 8 sets of test schemes at 06:00 (a) and 18:00 (b) July 29, 2021
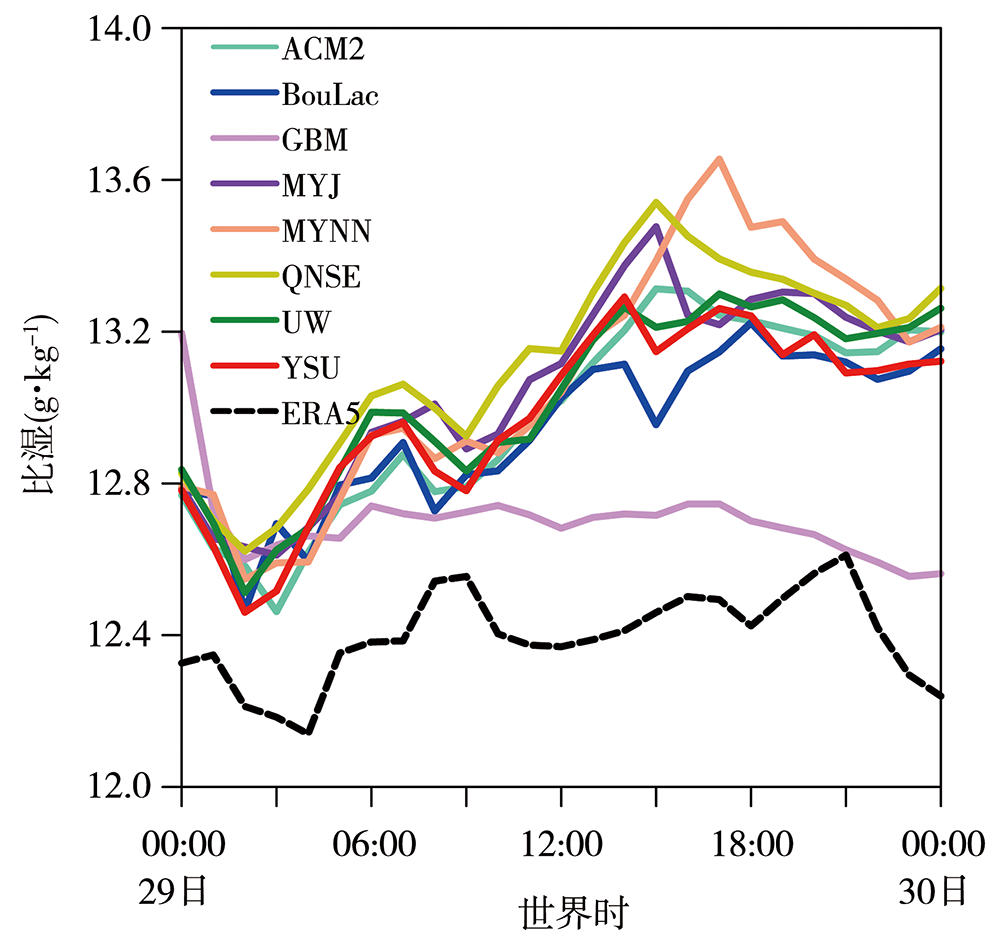
Fig.10 Time series of area averaged 850 hPa specific humidity from the simulated data of 8 sets of test schemes and ERA5 data (The selected average region is the same as in fig.6)
Fig.10 Time series of area averaged 850 hPa specific humidity from the simulated data of 8 sets of test schemes and ERA5 data (The selected average region is the same as in fig.6)
| [1] | 陈联寿, 罗哲贤, 李英, 2004. 登陆热带气旋研究的进展[J]. 气象学报, 62(5): 541-549. |
| [2] | 陈联寿, 许映龙, 2017. 中国台风特大暴雨综述[J]. 气象与环境科学, 40(1): 3-10. |
| [3] | 蔡芗宁, 寿绍文, 钟青, 2006. 边界层参数化方案对暴雨数值模拟的影响[J]. 南京气象学院学报, 29(3): 364-370. |
| [4] | 蔡义勇, 党皓飞, 林青, 等, 2019. 福建台风极端强降水的时空分布及环流特征[J]. 海峡科学, 10: 14-21. |
| [5] | 崔驰潇, 包云轩, 袁成松, 等, 2018. 不同边界层参数化方案对江苏地区一次平流雾过程的模拟影响[J]. 大气科学, 42(6): 1 344-1 362. |
| [6] | 邓国, 周玉淑, 李建通, 2005. 台风数值模拟中边界层方案的敏感性试验I: 对台风结构的影响[J]. 大气科学, 29(3): 417-428. |
| [7] | 代昕鹭, 陈葆德, 张旭, 等, 2017. WARMS2.0中边界层参数化方案对一次台风外围降水模拟预报的影响[J]. 成都信息工程大学学报, 32(5): 513-523. |
| [8] | 丁成慧, 李江南, 赵杨洁, 等, 2018. 边界层参数化方案对南海秋季台风“莎莉嘉”(2016)模拟的影响[J]. 热带气象学报, 34(5): 657-673. |
| [9] | 李英, 陈联寿, 2005. 湿地边界层通量影响热带气旋登陆维持和降水的数值试验[J]. 气象学报, 63(5): 683-693. |
| [10] | 温晓培, 隆霄, 张述文, 等, 2016. 边界层参数化方案对台风SANBA初生阶段影响的数值模拟研究[J]. 热带气象学报, 32(3): 346-357. |
| [11] |
王晨稀, 2013. 边界层参数化影响“梅花”台风的敏感性试验[J]. 地球科学进展, 28(2): 197-208.
DOI |
| [12] | 王雨星, 钟中, 孙源, 等, 2017. 两种边界层参数化方案模拟热带气旋Megi(2010)路径差异的机理分析[J]. 地球物理学报, 60(7): 2 545-2 555. |
| [13] | 王叶红, 赵玉春, 2020. 边界层参数化方案对“莫兰蒂”台风(1614)登陆阶段影响的数值模拟研究[J]. 大气科学, 44(5): 935-959. |
| [14] | 吴志鹏, 李跃清, 李晓岚, 等, 2021. WRF模式边界层参数化方案对川渝盆地西南涡降水模拟的影响[J]. 大气科学, 45(1): 58-72. |
| [15] | 夏丽花, 苏志重, 刘爱鸣, 等, 2014. 台湾地形对1011号台风“凡亚比”影响的数值试验[J]. 暴雨灾害, 33(2): 149-155. |
| [16] | 徐亚钦, 翟国庆, 李国平, 等, 2017. WRF模式对高影响浙江型台风微物理和边界层参数化方案的优化试验[J]. 热带气象学报, 33(2): 201-211. |
| [17] | 许鲁君, 刘辉志, 徐祥德, 等, 2018. WRF模式对青藏高原那曲地区大气边界层模拟适用性研究[J]. 气象学报, 76(6): 955-967. |
| [18] | 赵鸣, 2008. 边界层和陆面过程对中国暴雨影响研究的进展[J]. 暴雨灾害, 27(2): 186-190. |
| [19] | 周昊, 朱伟军, 彭世球, 2013. 不同微物理方案和边界层方案对超强台风“鲇鱼”路径和强度模拟的影响分析[J]. 热带气象学报, 28(5): 803-812. |
| [20] | 周彦均, 高志球, 濮梅娟, 等, 2019. 不同的边界层参数化方案对江淮一次暴雨过程数值试验研究[J]. 大气科学学报, 42(4): 591-601. |
| [21] |
BOUGEAULT P, LACARRERE P, 1989. Parameterization of orography-induced turbulence in a mesobeta-scale model[J]. Monthly Weather Review, 117(8): 1 872-1 890.
DOI URL |
| [22] |
BRETHERTON C S, PARK S, 2009. A new moist turbulence parameterization in the community atmosphere model[J]. Journal of Climate, 22(12): 3 422-3 448.
DOI URL |
| [23] |
GRENIER H, BRETHERTON C S, 2001. A moist PBL parameterization for large-scale models and its application to subtropical cloud-topped marine boundary layers[J]. Monthly Weather Review, 129(3): 357-377.
DOI URL |
| [24] |
HONG S Y, NOH Y, DUDHIA J, 2006. A new vertical diffusion package with an explicit treatment of entrainment processes[J]. Monthly Weather Review, 134(9): 2 318-2 341.
DOI URL |
| [25] |
HU X M, NIELSEN-GAMMON J W, ZHANG F Q, 2010. Evaluation of three planetary boundary layer schemes in the WRF model[J]. Journal of Applied Meteorology and Climatology, 49(9): 1 831-1 844.
DOI URL |
| [26] |
MELLOR G L, YAMADA T, 1982. Development of a turbulence closure model for geophysical fluid problems[J]. Reviews of Geophysics, 20(4): 851-875.
DOI URL |
| [27] | NAKANISHI M, NIINO H, 2009. Development of an improved turbulence closure model for the atmospheric boundary layer[J]. Journal of the Meteorological Society of Japan, 87(5): 895-912. |
| [28] |
PLEIM J E, 2007. A combined local and nonlocal closure model for the atmospheric boundary layer. Part I: Model description and testing[J]. Journal of Applied Meteorology and Climatology, 46(9): 1 383-1 395.
DOI URL |
| [29] |
SCHUMACHER R S, DAVIS C A, 2010. Ensemble-based forecast uncertainty analysis of diverse heavy rainfall events[J]. Weather and Forecasting, 25(4): 1 103-1 122.
DOI URL |
| [30] |
SUKORIANSKY S, GALPERIN B, PEROV V, 2005. Application of a new spectral theory of stably stratified turbulence to the atmospheric boundary layer over sea ice[J]. Boundary-Layer Meteorology, 117(2): 231-257.
DOI URL |
| [1] | ZHANG Junxia, HUANG Wubin, YANG Xiumei, LIU Weicheng, ZHOU Zihan, SHA Honge. Analysis on precipitation extremity of a torrential rain event in semi-arid region of eastern Gansu [J]. Journal of Arid Meteorology, 2022, 40(6): 922-932. |
| [2] | SHA Honge, FU Zhao, LIU Weicheng, XU Lili, LIU Na, LIU Xinyu, MA Yihao. Mechanism of trigger and maintenance during an extremely torrential rain in semi-arid region of eastern Northwest China [J]. Journal of Arid Meteorology, 2022, 40(6): 933-944. |
| [3] | DONG Junling, LIU Chao, SU Aifang. Impact of Urbanization on a Torrential Rain Process in Zhengzhou Region [J]. Journal of Arid Meteorology, 2019, 37(6): 922-932. |
| [4] | WANG Jun. Analysis of Extremity and Mesoscale Characteristic on Two Torrential Rain Processes in North He’nan Province [J]. Journal of Arid Meteorology, 2019, 37(3): 419-. |
| [5] | CAI Ronghui, CHEN Jingjing, WEN Ping, HE Weiwei, CHEN Hongzhuan, LI Wei. Water Vapour Characteristics During a Flood-causing Torrential Rainfall Process in Hunan Province in 2017 [J]. Journal of Arid Meteorology, 2019, 37(2): 288-300. |
| [6] | WANG Simin, ZHAO Guixiang, ZHAO Yu, SHEN Liwen. Multi-scale System Interaction Research of a Torrential Rainfall Process in Shanxi in July 2016 [J]. Journal of Arid Meteorology, 2017, 35(5): 857-867. |
| [7] | GAN Lu, GUO Wenli, DENG Changju. Comparative Analysis of Two Torrential Rain Processes in Beijing [J]. Journal of Arid Meteorology, 2017, 35(2): 239-249. |
| [8] | YANG Lei1,JIANG Dakai1,WANG Ying1,CAI Kuizhi1,SUN Li2,YANG Xue1,CAO Shiteng1. Analysis on Multi-scale Characteristics of a Torrential Rainstorm in Liaoning Province on 16 August 2013 [J]. Journal of Arid Meteorology, 2017, 35(2): 267-274. |
| [9] | FANG Biao. Analysis of Radial Velocity Features of Doppler Radar on a Torrential Rainstorm in Eastern Fanjing Mountain in Late Spring of 2015 [J]. Journal of Arid Meteorology, 2016, 34(6): 1064-1070. |
| [10] | YANG Qun, CHEN Guanqing, FANG Biao, AN Xiang, CHEN Fangyuan, MAO Haixiang. Analysis of Radar Echo Features of a Local Torrential Rain in Fanjing Mountain [J]. Journal of Arid Meteorology, 2016, 34(5): 820-827. |
| [11] | MA Yan, DONG Haiying, CHEN Shang. Forecast Performance Test for Different Wet Processes in WRF on a Torrential Rain Around Qingdao [J]. Journal of Arid Meteorology, 2016, 34(3): 494-502. |
| [12] | DONG Chunqing, MIAO Aimei, GUO Yuanyuan, ZHANG Lei. Numerical Simulation of Effects of Terrain on Yuanqu “0729” Severe Torrential Rain Event [J]. Journal of Arid Meteorology, 2015, 33(3): 452-457. |
| [13] | WANG Fuxia,ZHANG Nan,ZHAO Yuguang,DUAN Hao,LI Zongtao. Contrast Analysis of Two Torrential Rainfall Processes in Mid -summer of Hebei Province [J]. Journal of Arid Meteorology, 2015, 33(1): 110-118. |
| [14] | ZHU Yiqing,HU Shunqi,ZHANG Pinzhu,ZHUANG Zhong,CAO Zhangchi. Mesoscale Characteristics of a Torrential Rain in Southern Shandong Province and Its Cause Analysis [J]. Journal of Arid Meteorology, 2015, 33(1): 119-127. |
| [15] | SUN Yun,LIU Wei,LI Guocui,MA Guidong,FENG Yang. Case Study of a Torrential Rain in Midsummer of 2011 in Shijiazhuang [J]. Journal of Arid Meteorology, 2015, 33(1): 156-161. |
| Viewed | ||||||
|
Full text |
|
|||||
|
Abstract |
|
|||||