Journal of Arid Meteorology ›› 2026, Vol. 44 ›› Issue (2): 241-253.DOI: 10.11755/j.issn.1006-7639-2026-02-0241
• Articles • Previous Articles Next Articles
Analysis of the three-dimension structure and triggering mechanism of a severe downslope windstorm case in north edge of Tianshan canyon
TANG Hao1,2( ), ZHOU Yaman1, AN Dawei1, WANG Minzhong3
- 1
Xinjiang Meteorological Observatory Urumqi 830002, China
2Dabancheng National Special Test Field for Comprehensive Meteorological Observation Urumqi 830002, China
3Institute of Desert Meteorology ,China Meteorological Administration Urumqi 830002, China
-
Received:2025-08-04Revised:2025-12-08Online:2026-05-20Published:2026-05-18
天山峡谷北缘一次极端下坡风暴三维结构及触发机理分析
- 1
新疆维吾尔自治区气象台 乌鲁木齐 830002
2达坂城国家综合气象观测专项试验外场基地 乌鲁木齐 830002
3中国气象局乌鲁木齐沙漠气象研究所 乌鲁木齐 830002
-
作者简介:汤浩(1972—),男,甘肃张掖人,正高级工程师,主要从事灾害性天气机理及客观预报技术研究。E-mail: tanghao72@163.com。 -
基金资助:国家自然科学基金项目(42165002);中央引导地方科技发展资金项目(ZYYD2025ZY21)
CLC Number:
Cite this article
TANG Hao, ZHOU Yaman, AN Dawei, WANG Minzhong. Analysis of the three-dimension structure and triggering mechanism of a severe downslope windstorm case in north edge of Tianshan canyon[J]. Journal of Arid Meteorology, 2026, 44(2): 241-253.
汤浩, 周雅蔓, 安大维, 王敏仲. 天山峡谷北缘一次极端下坡风暴三维结构及触发机理分析[J]. 干旱气象, 2026, 44(2): 241-253.
share this article
Add to citation manager EndNote|Ris|BibTeX
URL: http://www.ghqx.org.cn/EN/10.11755/j.issn.1006-7639-2026-02-0241
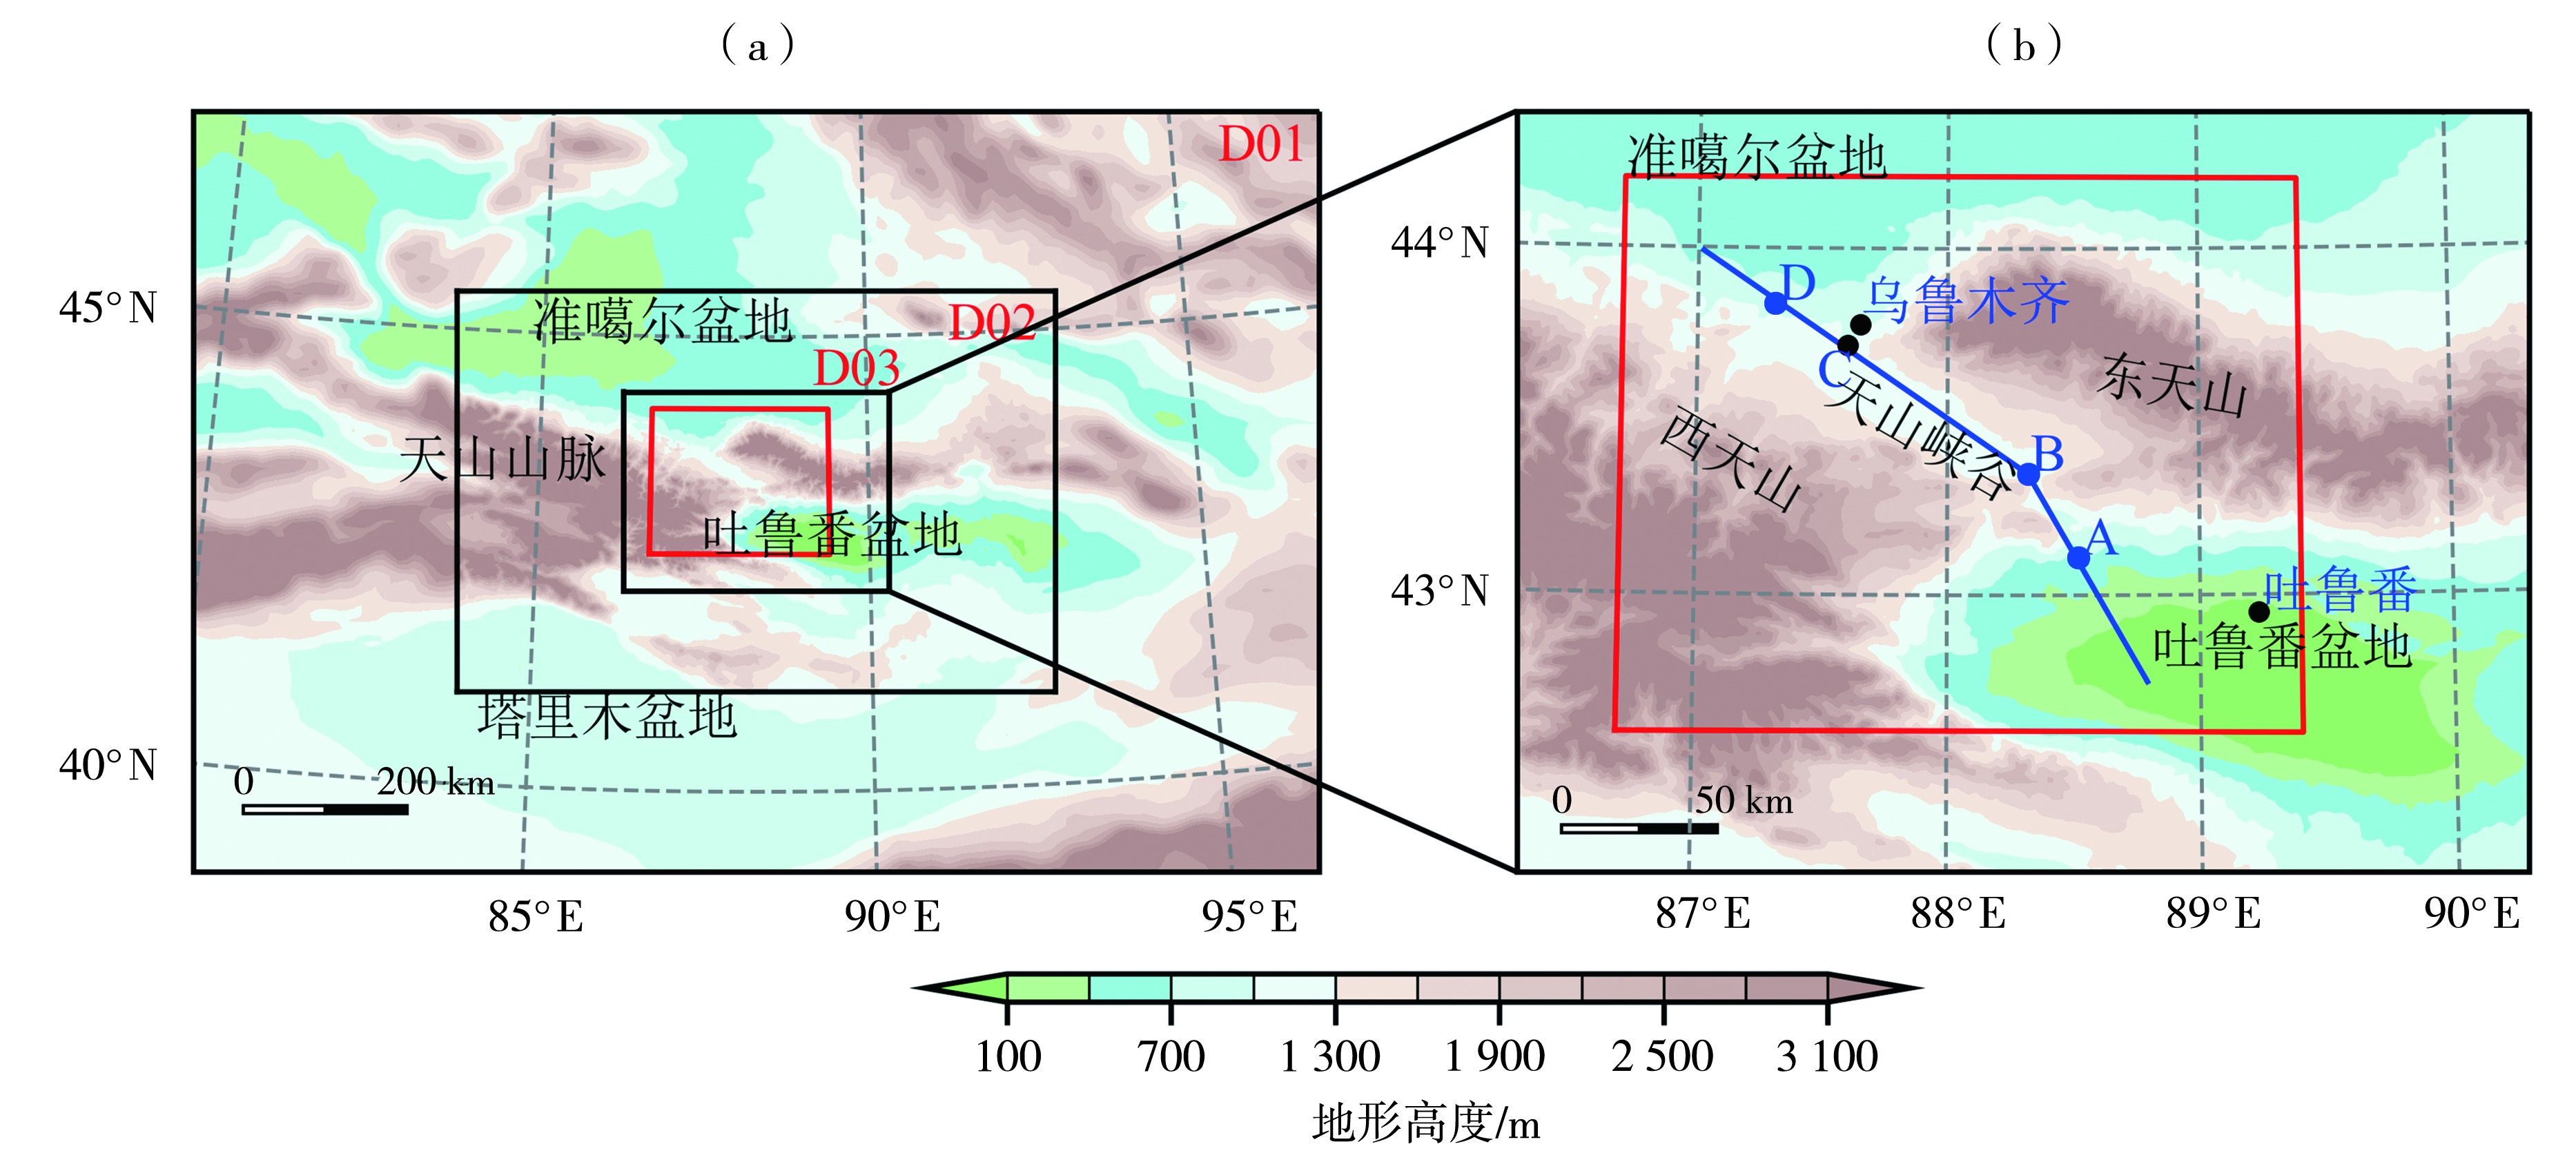
Fig.1 Topography (the color shaded) and triply nested model domains (a) and meteorological stations (black dots) and subregions within the D03 domain (b) (The red rectangle indicates the study area, the same as below; points A, B, and D denote reference locations along the airflow path, point C represents the Hongyanchi Station, the same as below; and the blue line indicates the cross-sectional location of the airflow over the mountain)
Fig.1 Topography (the color shaded) and triply nested model domains (a) and meteorological stations (black dots) and subregions within the D03 domain (b) (The red rectangle indicates the study area, the same as below; points A, B, and D denote reference locations along the airflow path, point C represents the Hongyanchi Station, the same as below; and the blue line indicates the cross-sectional location of the airflow over the mountain)
Tab.1 Parameterized scheme setting of WRF model
| 物理参数化方案 | 设置 |
|---|---|
| 微物理(mp_phyisics) | WSM3(Hong et al., |
| 积云(cu_physics) | Kain-Fritsch(D02、D03关闭)(Kain, |
| 长波辐射(ra_lw_physics) | RRTM(Mlawer et al., |
| 短波辐射(ra_sw_physics) | Dudhia(Dudhia, |
| 陆面(sf_surface_physics) | Noah land Surface Model(Noilhan and Planton, |
| 近地层(sf_sfclay_physics) | MM5 Similarity(Skamarock et al., |
| 边界层(PBL) | Shin和Hong(开启湍流动能输出)(Shin and Hong, |
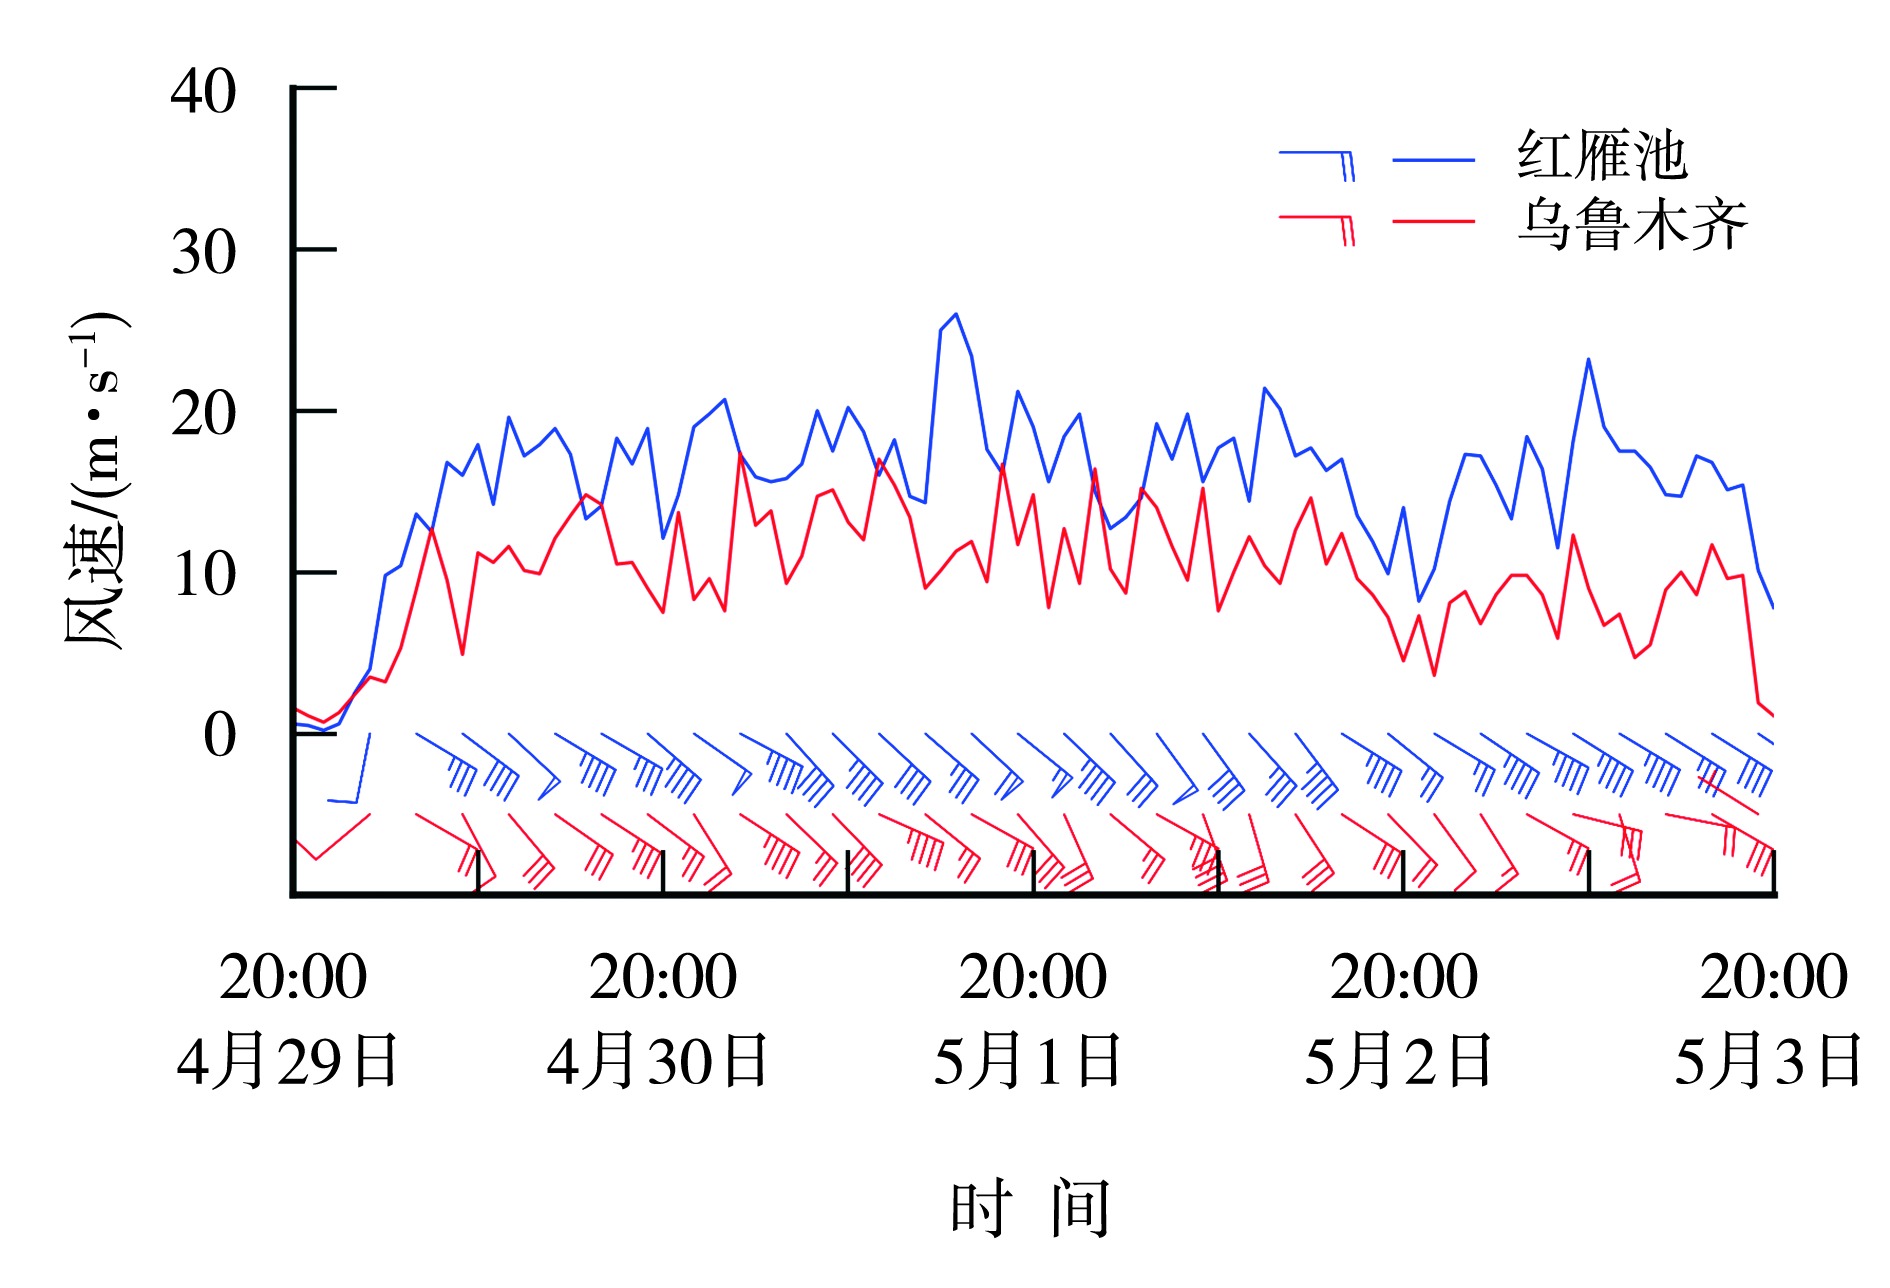
Fig.2 Observed hourly wind speed and direction at representative stations during the extreme gale event in Urumqi from 29 April to 3 May 2022
Fig.2 Observed hourly wind speed and direction at representative stations during the extreme gale event in Urumqi from 29 April to 3 May 2022

Fig.3 The geopotential height (the contour lines, Unit: dagpm) and wind field (arrow vectors, Unit: m·s-1) at 500 hPa (a, c, e) and sea level pressure field (the contour lines, Unit: hPa) and 850 hPa wind field (arrow vectors, Unit: m·s-1) (b, d, f) at 08:00 on April 29 (a, b), 14:00 on May 1 (c, d), 20:00 on May 3 (e, f) 2022 (The letter G and D represent the high-pressure and low-pressure center, respectively)
Fig.3 The geopotential height (the contour lines, Unit: dagpm) and wind field (arrow vectors, Unit: m·s-1) at 500 hPa (a, c, e) and sea level pressure field (the contour lines, Unit: hPa) and 850 hPa wind field (arrow vectors, Unit: m·s-1) (b, d, f) at 08:00 on April 29 (a, b), 14:00 on May 1 (c, d), 20:00 on May 3 (e, f) 2022 (The letter G and D represent the high-pressure and low-pressure center, respectively)
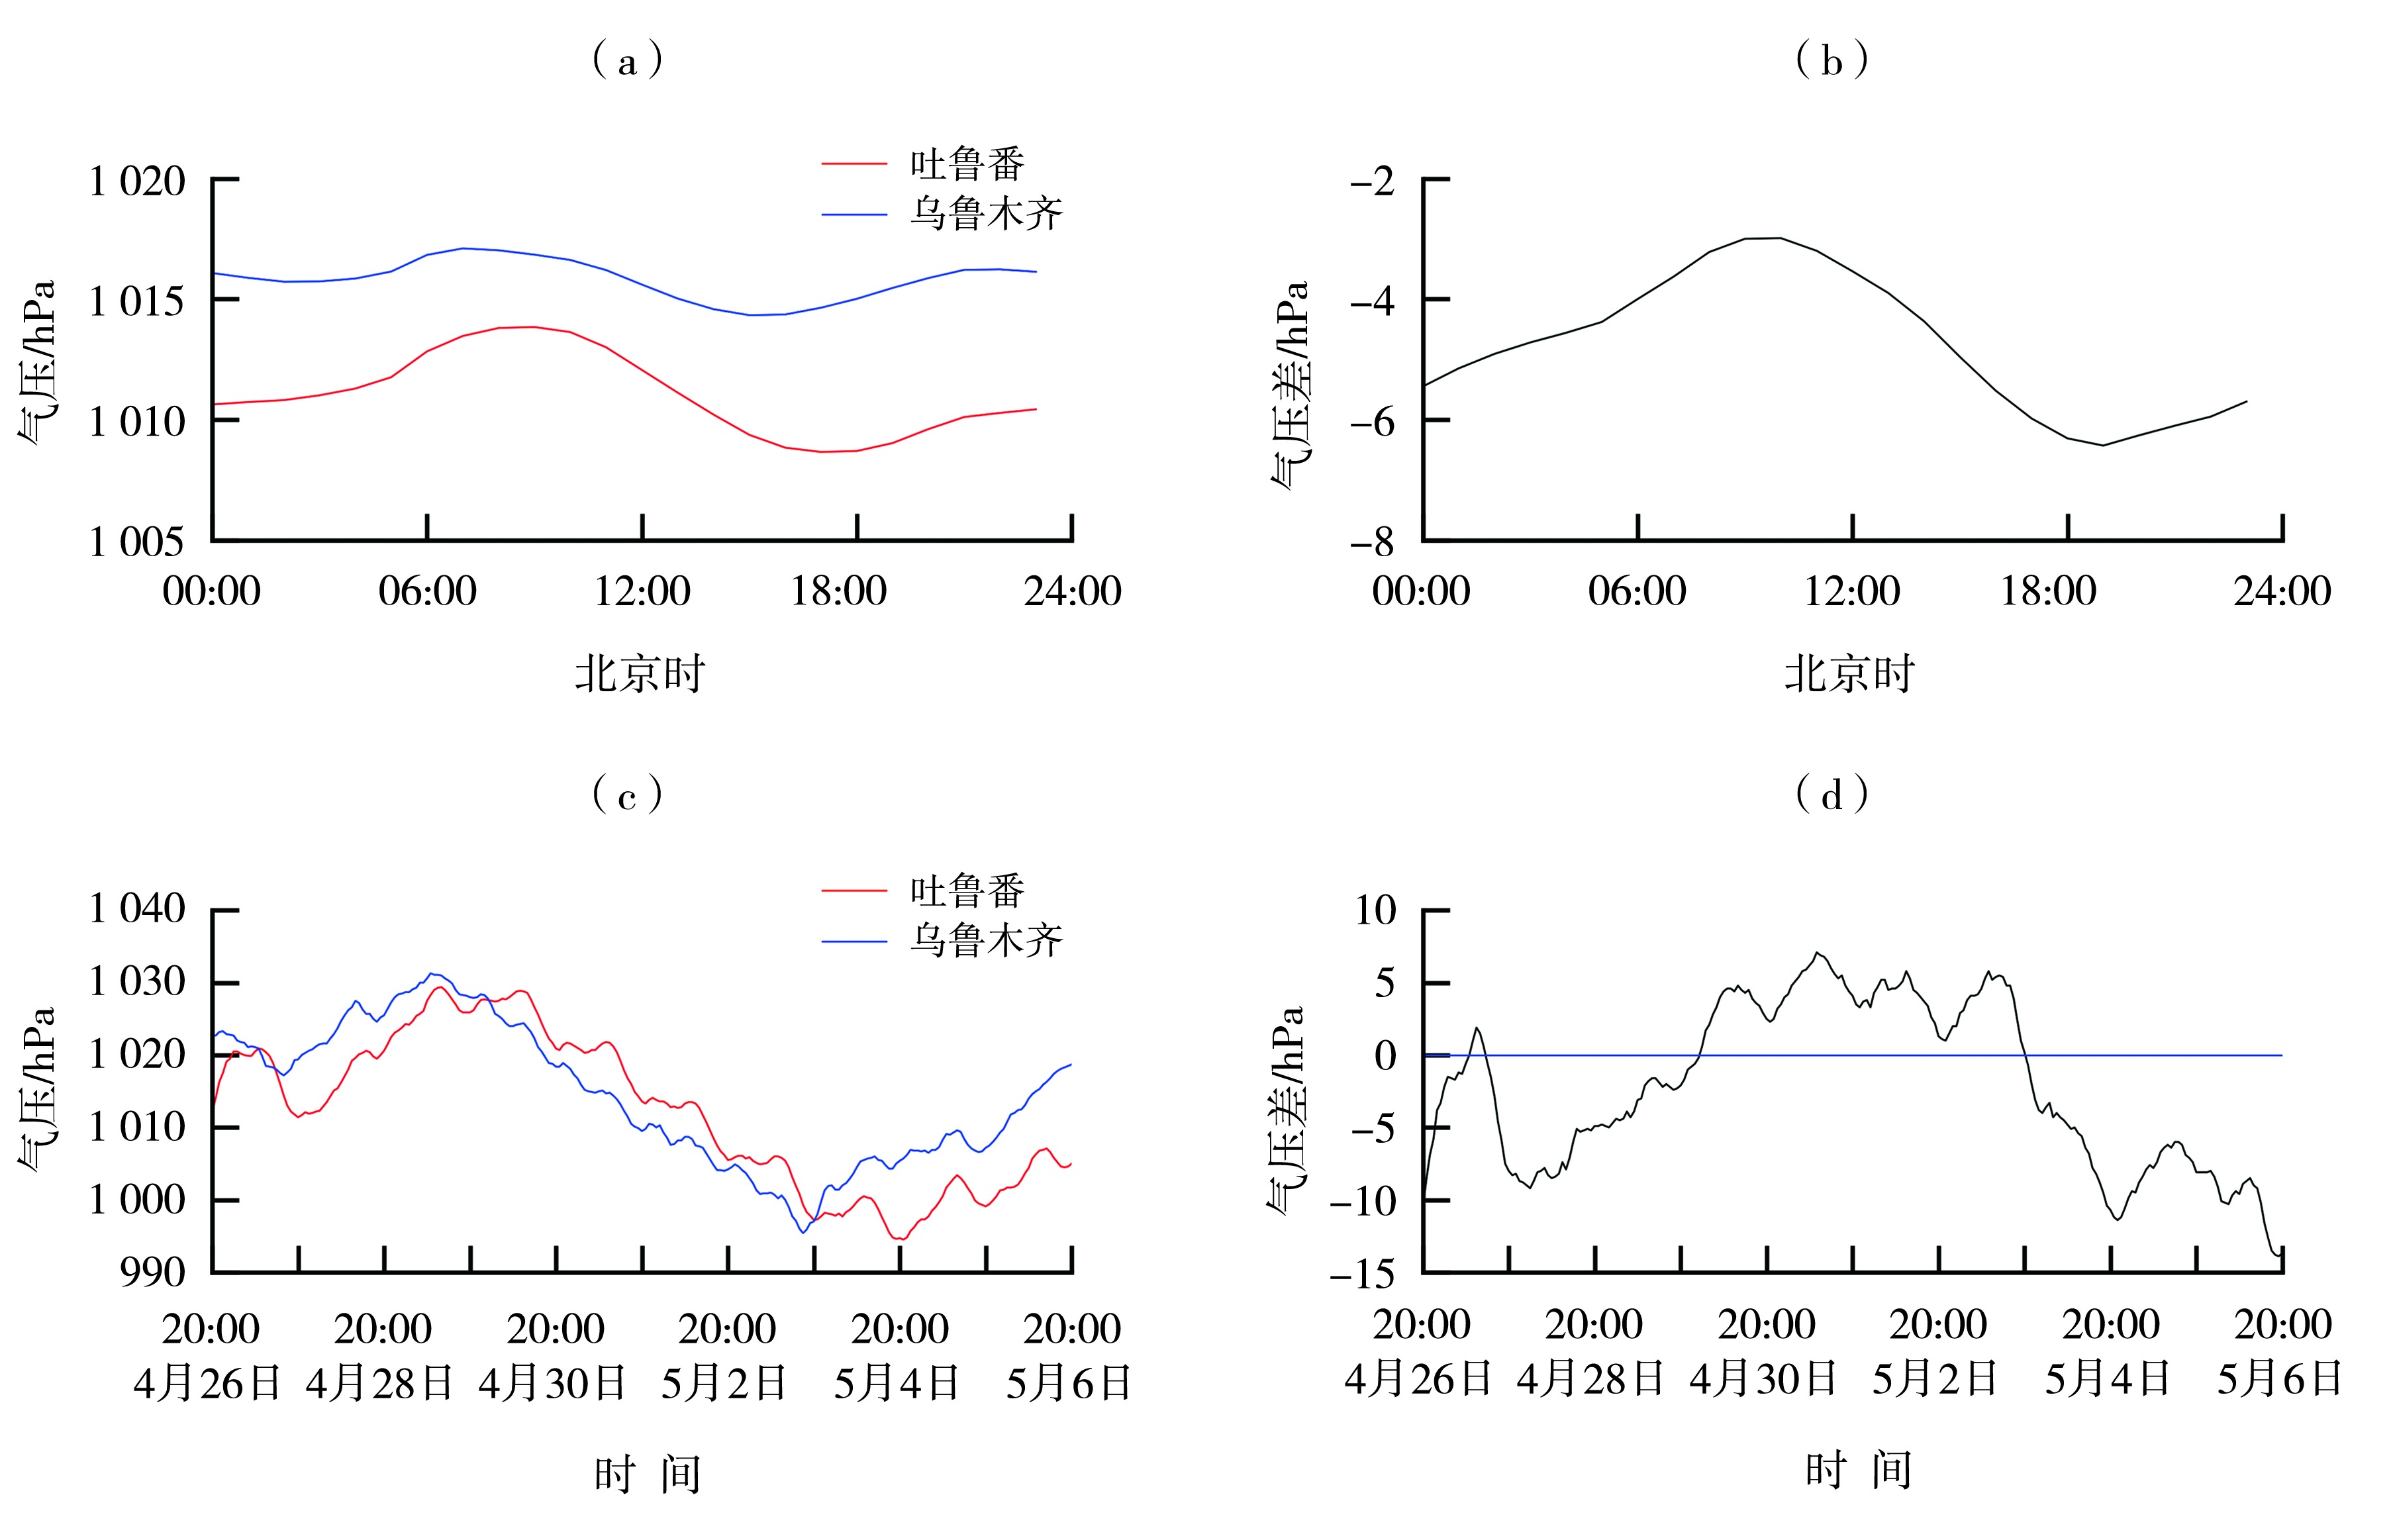
Fig.4 The daily variation of mean sea level pressure (a, c) in Urumqi and Turpan and its pressure difference (Turpan minus Urumqi, the same as below; b, d) during April-May of 1991-2020 (a, b) and from 26 April to 6 May 2022 (c, d)
Fig.4 The daily variation of mean sea level pressure (a, c) in Urumqi and Turpan and its pressure difference (Turpan minus Urumqi, the same as below; b, d) during April-May of 1991-2020 (a, b) and from 26 April to 6 May 2022 (c, d)
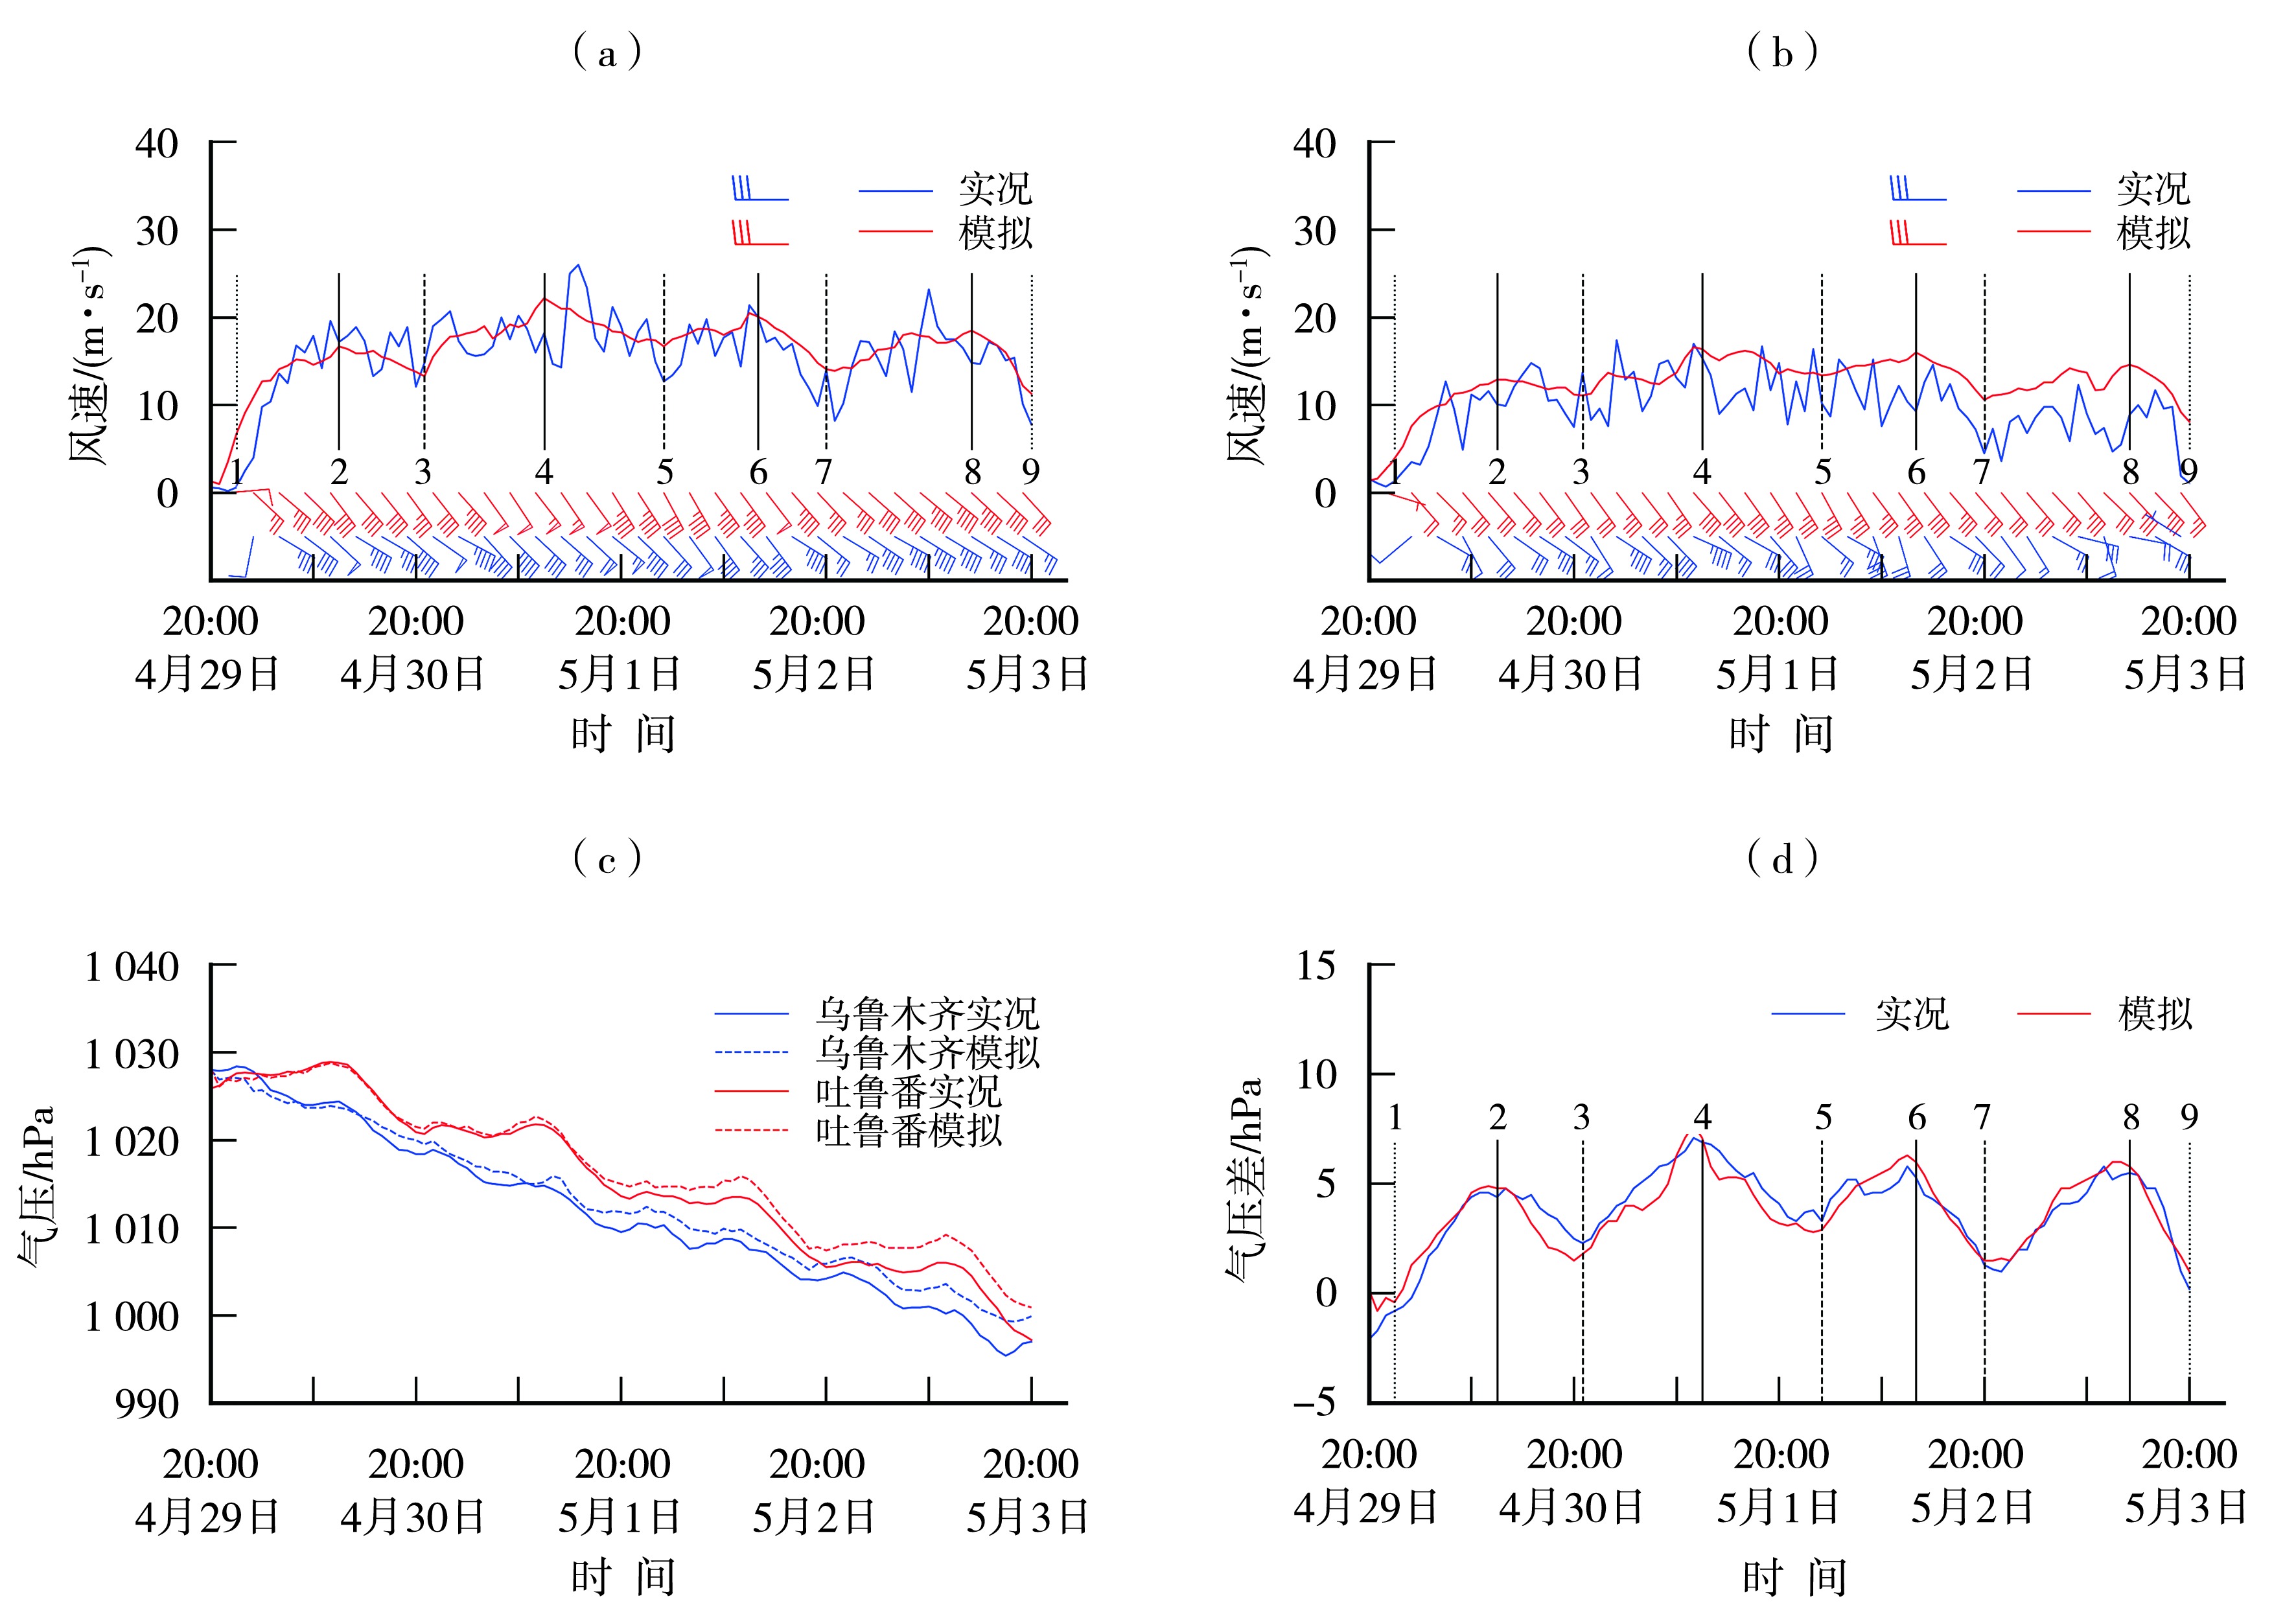
Fig.5 Observed and simulated wind speed (solid lines) and wind direction (arrow vectors) at Hongyanchi (a) and Urumqi (b), and sea level pressure in Urumqi and Turpan (c) and pressure difference (d) from 29 April to 3 May 2022 (Vertical lines 2, 4, 6, and 8 denote the peak times of simulated wind speed at Hongyanchi; lines 3, 5, and 7 denote the trough times; lines 1 and 9 denote the onset and termination times of the gale event)
Fig.5 Observed and simulated wind speed (solid lines) and wind direction (arrow vectors) at Hongyanchi (a) and Urumqi (b), and sea level pressure in Urumqi and Turpan (c) and pressure difference (d) from 29 April to 3 May 2022 (Vertical lines 2, 4, 6, and 8 denote the peak times of simulated wind speed at Hongyanchi; lines 3, 5, and 7 denote the trough times; lines 1 and 9 denote the onset and termination times of the gale event)

Fig.6 Wind speed (the color shaded) and wind direction (arrow vectors) at 3 000 m (a, b, c, d), 2 000 m (e, f, g, h), 1 500 m (i, j, k, l), and 10 m above ground (m, n, o, p) at 22:00 on 29 April (a, e, i, m), 21:00 on 30 April (b, f, j, n), 11:00 on 1 May (c, g, k, o), and 20:00 on 3 May (d, h, l, p) 2022 (Unit: m·s-1) (The gray shading indicates terrain, the same as below)
Fig.6 Wind speed (the color shaded) and wind direction (arrow vectors) at 3 000 m (a, b, c, d), 2 000 m (e, f, g, h), 1 500 m (i, j, k, l), and 10 m above ground (m, n, o, p) at 22:00 on 29 April (a, e, i, m), 21:00 on 30 April (b, f, j, n), 11:00 on 1 May (c, g, k, o), and 20:00 on 3 May (d, h, l, p) 2022 (Unit: m·s-1) (The gray shading indicates terrain, the same as below)
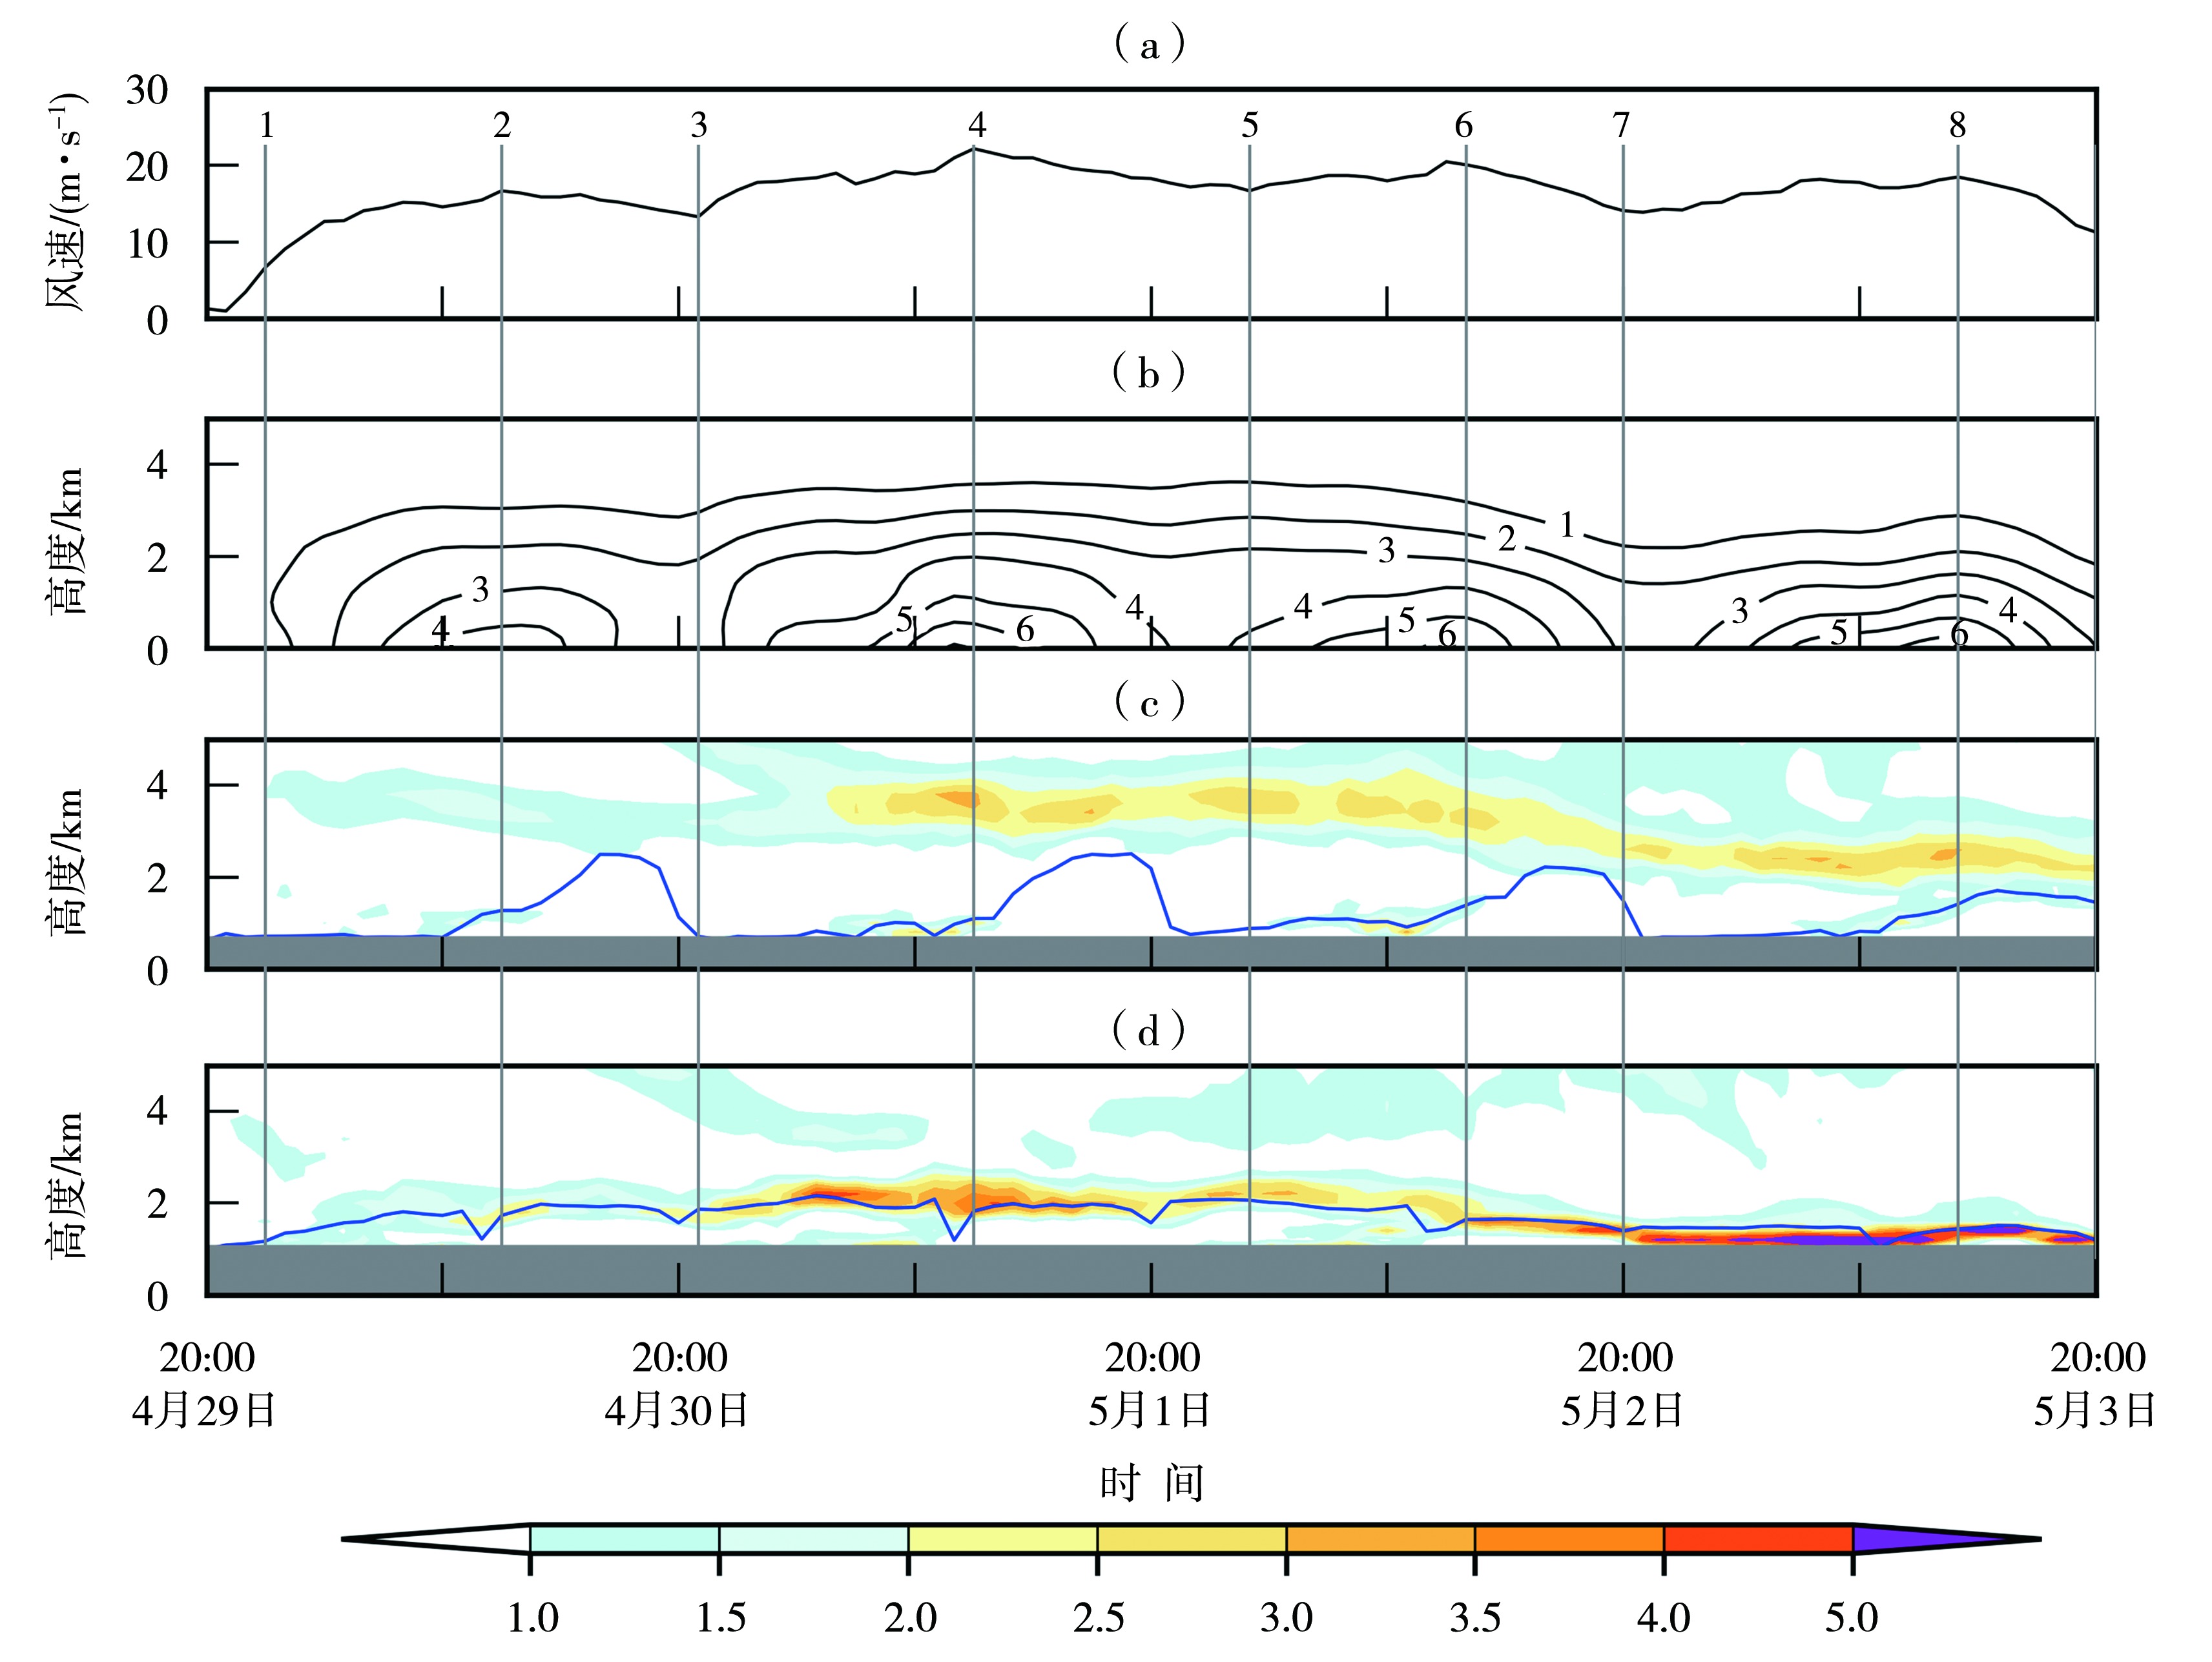
Fig.7 Hourly variation of simulated wind speed at Hongyanchi Station (a), and time-height cross sections of the pressure difference between Turpan and Urumqi (b, Unit: hPa), squared buoyancy frequency on the windward (c) and leeward (d) slopes (the color shaded, Unit: 10-4 s-2) from 29 April to 3 May 2022 (The blue line denotes the boundary layer height, Unit: km)
Fig.7 Hourly variation of simulated wind speed at Hongyanchi Station (a), and time-height cross sections of the pressure difference between Turpan and Urumqi (b, Unit: hPa), squared buoyancy frequency on the windward (c) and leeward (d) slopes (the color shaded, Unit: 10-4 s-2) from 29 April to 3 May 2022 (The blue line denotes the boundary layer height, Unit: km)
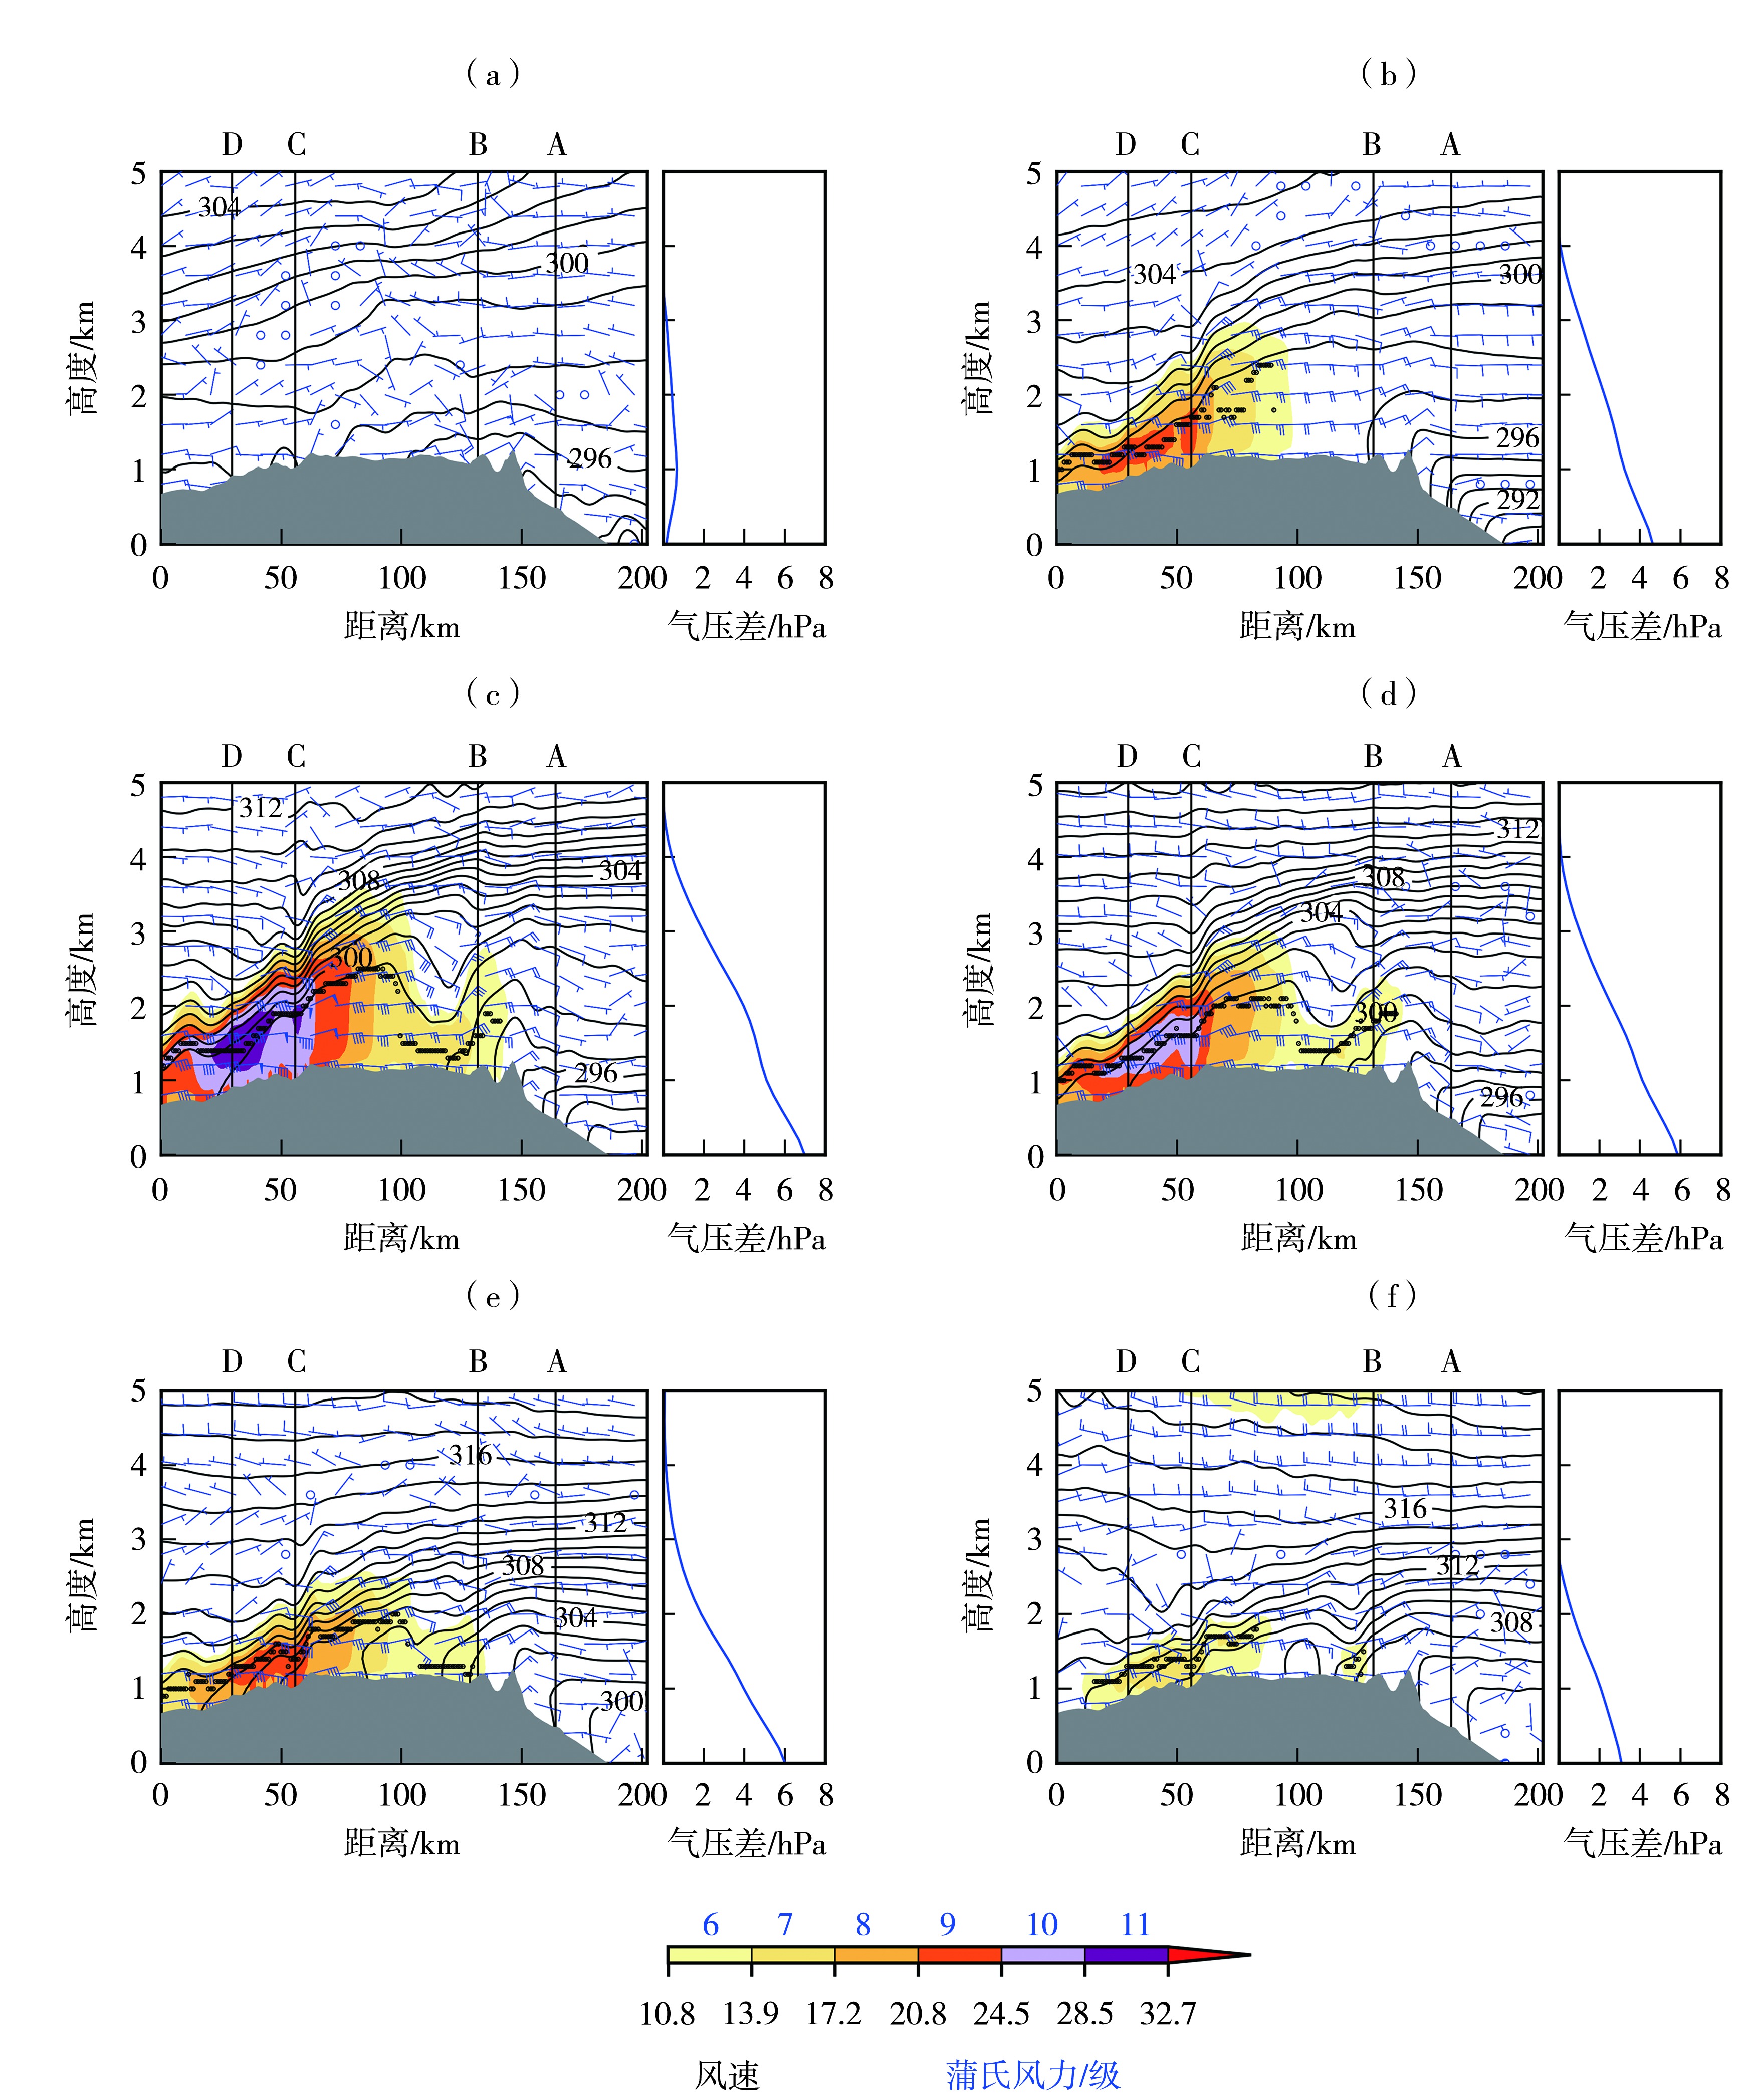
Fig.8 The variations of horizontal wind speed (the color shaded, Unit: m·s-1), potential temperature (contour lines, Unit: K), and the combined horizontal wind speed and vertical motion (arrow vectors, Unit: m·s-1) with height along the airflow passing through the Tianshan canyon together with the pressure difference profile between Turpan and Urumqi at 22:00 on 29 April (a), 11:00 on 30 April (b), 11:00 on 1 May (c), 11:00 on 2 May (d), 13:00 on 3 May (e), and 20:00 on 3 May (f) 2022 (Black dots indicate the height of the maximum wind speed layer exceeding 12 m·s-1 from the surface to 5 km, the same as below)
Fig.8 The variations of horizontal wind speed (the color shaded, Unit: m·s-1), potential temperature (contour lines, Unit: K), and the combined horizontal wind speed and vertical motion (arrow vectors, Unit: m·s-1) with height along the airflow passing through the Tianshan canyon together with the pressure difference profile between Turpan and Urumqi at 22:00 on 29 April (a), 11:00 on 30 April (b), 11:00 on 1 May (c), 11:00 on 2 May (d), 13:00 on 3 May (e), and 20:00 on 3 May (f) 2022 (Black dots indicate the height of the maximum wind speed layer exceeding 12 m·s-1 from the surface to 5 km, the same as below)
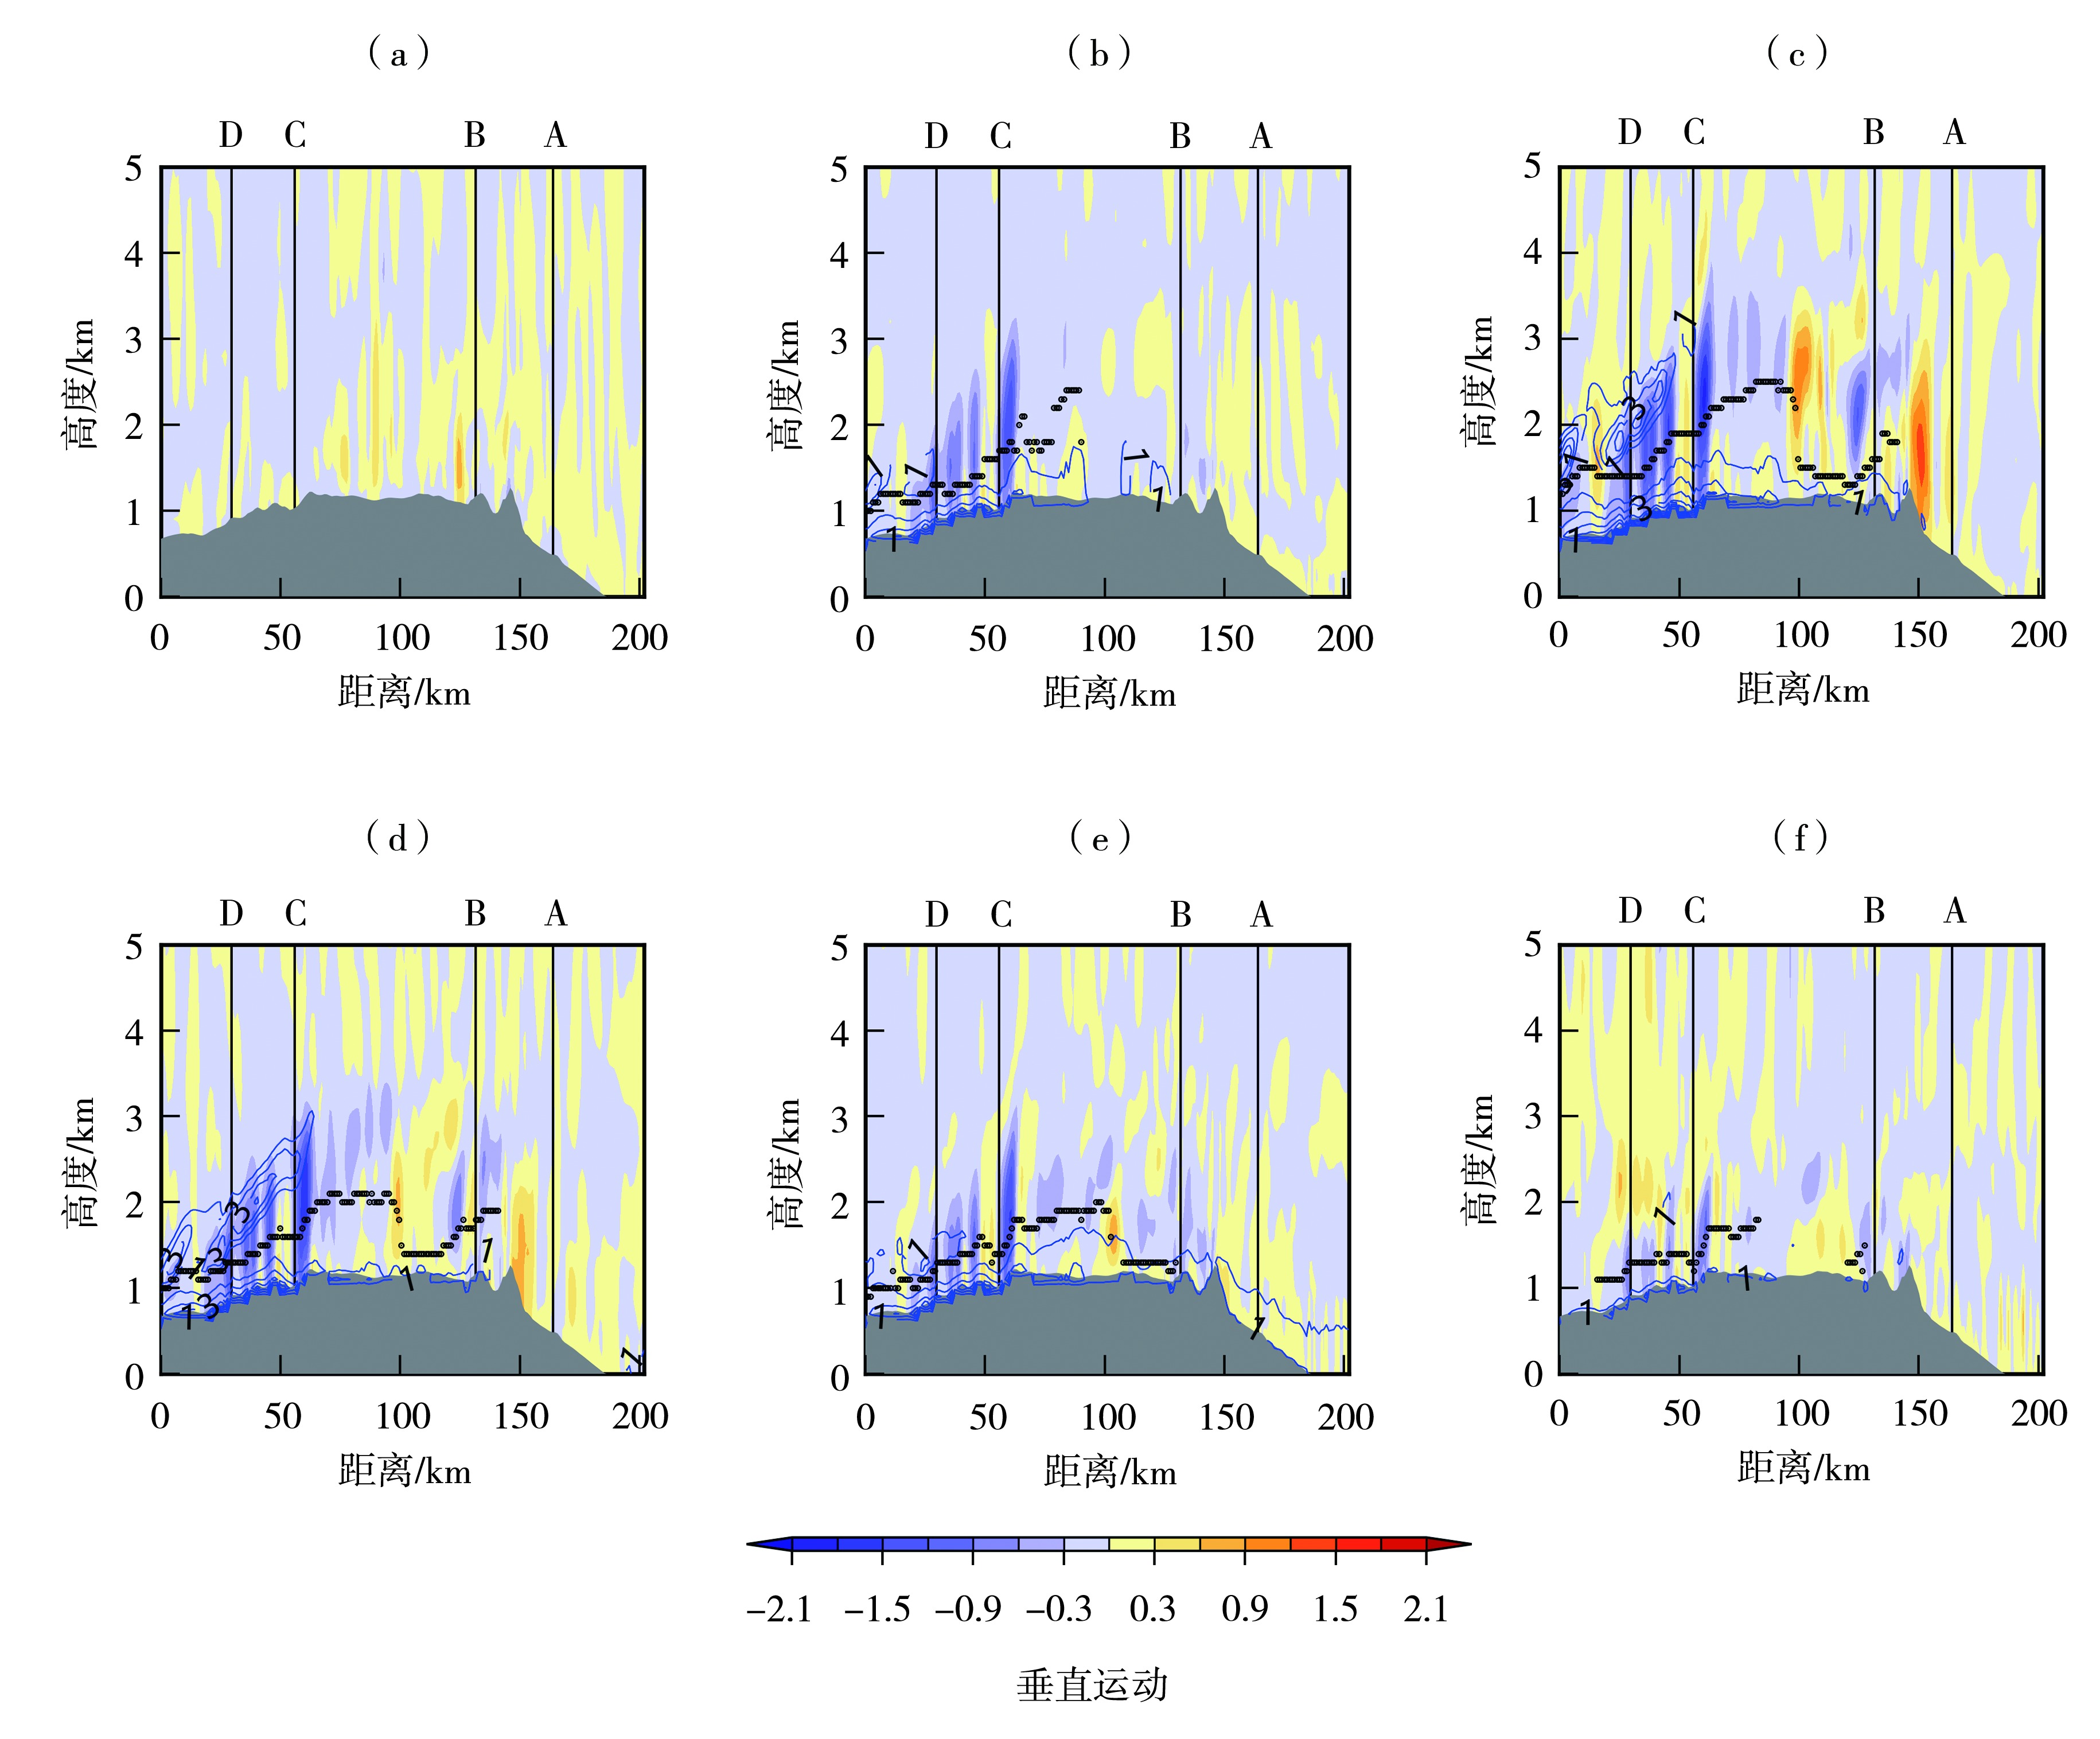
Fig.9 The variations of TKE (the contour lines, Unit: m2·s2) and vertical motion (the color shaded, Unit: m·s-1) with height along the airflow passing through the Tianshan canyon at 22:00 on 29 April (a), 11:00 on 30 April (b), 11:00 on 1 May (c), 11:00 on 2 May (d), 13:00 on 3 May (e), and 20:00 on 3 May (f) 2022
Fig.9 The variations of TKE (the contour lines, Unit: m2·s2) and vertical motion (the color shaded, Unit: m·s-1) with height along the airflow passing through the Tianshan canyon at 22:00 on 29 April (a), 11:00 on 30 April (b), 11:00 on 1 May (c), 11:00 on 2 May (d), 13:00 on 3 May (e), and 20:00 on 3 May (f) 2022
| [1] | 黄海波, 陈阳权, 王清平, 2014. 乌鲁木齐机场东南大风数值预报及地形敏感性试验[J]. 气象科技, 42(6):1064-1 068. |
| [2] |
靳双龙, 刘晓琳, 王勃, 等, 2024. 地面气压在纵向峡谷区大风预报中的应用探讨[J]. 干旱气象, 42(5):804-812.
DOI |
| [3] | 李国平, 许一洲, 张晓玉, 等, 2025. 四川盆地一次暴雨过程的重力波与西南涡关系研究[J]. 高原山地气象研究, 45(1):9-19. |
| [4] | 李艺苑, 王东海, 王斌, 2009. 中小尺度过山气流的动力问题研究[J]. 自然科学进展, 19(3):310-324. |
| [5] | 卢冰, 史永强, 王光辉, 等, 2014. 新疆克拉玛依强下坡风暴的机理研究[J]. 气象学报, 72(6):1218-1 230. |
| [6] | 孟齐辉, 吕斌, 刁平, 1996. 乌鲁木齐地区东南大风与气压场演变的关系[J]. 新疆气象, 19(1):5-9. |
| [7] |
肉孜·阿基, 李如琦, 阿不力米提江·阿布力克木, 等 2015. 乌鲁木齐一次强东南大风天气成因分析[J]. 干旱气象, 33(3):474-480.
DOI |
| [8] | 桑建国, 1989. 下坡运动的分析解[J]. 气象学报, 47(2):191-198. |
| [9] | 汤浩, 陆汉城, 储长江, 等, 2020. 天山峡谷穿谷急流触发强下坡风暴的中尺度特征分析[J]. 气象, 46(11):1450-1 460. |
| [10] | 王蓉, 吴稀稀, 岳平, 等, 2023. 青藏高原东北边坡复杂地形重力波的数值模拟[J]. 大气科学学报, 46(5):738-752. |
| [11] | 肖庆农, 伍荣生, 1995. 地形对于气流运动影响的数值研究[J]. 气象学报, 53(1):38-49. |
| [12] | 新疆维吾尔自治区气象局, 2023. 2022年新疆十大天气气候事件[EB/OL]. (2023-01-18)[2025-08-04]. http://xj.cma.gov.cn/xwzx/qxyw/202301/t20230118_5268969.html. |
| [13] | 杨大升, 刘余滨, 刘式适, 1980. 动力气象学[M]. 北京: 气象出版社. |
| [14] |
杨洪儒, 王楠, 2014. 地窝堡机场东南大风特征及其大气结构[J]. 干旱气象, 32(3):393-398.
DOI |
| [15] | 叶笃正, 1956. 小地形对气流的影响[J]. 气象学报, 27(3):243-262. |
| [16] |
殷青青, 任璐, 田文寿, 等, 2022. 华北地区一次对流激发重力波的卫星观测和数值模拟研究[J]. 干旱气象, 40(3):444-456.
DOI |
| [17] |
于晓晶, 张丽霞, 于志翔, 等, 2025. 2025年1月美国洛杉矶破纪录山火事件的干旱气象条件归因[J]. 干旱气象, 43(5):667-677.
DOI |
| [18] | 张家宝, 苏起元, 孙沈清, 等, 1986. 新疆短期天气预报指导手册[M]. 乌鲁木齐: 新疆人民出版社:330-336. |
| [19] |
赵斯楠, 赵海燕, 代潭龙, 等, 2025. 高温和干旱对美国加利福尼亚州山火的影响[J]. 干旱气象, 43(5):689-700.
DOI |
| [20] |
BRINKMANN W A R, 1974. Strong downslope winds at boulder, Colorado[J]. Monthly Weather Review, 102(8): 592-602.
DOI URL |
| [21] |
CLARK T L, PELTIER W R, 1984. Critical level reflection and the resonant growth of nonlinear mountain waves[J]. Journal of the Atmospheric Sciences, 41(21): 3 122-3 134.
DOI URL |
| [22] | DUDHIA J, 1993. A nonhydrostatic version of the Penn state-NCAR mesoscale model: Validation tests and simulation of an Atlantic cyclone and cold front[J]. Monthly Weather Review, 121(5): 1 493-1 513. |
| [23] | DURRAN D R, 1986. Another look at downslope windstorms. Part I: The development of analogs to supercritical flow in an infinitely deep, continuously stratified fluid[J]. Journal of the Atmospheric Sciences, 43(21): 2 527-2 543. |
| [24] |
HONG S Y, DUDHIA J, CHEN S H, 2004. A revised approach to ice microphysical processes for the bulk parameterization of clouds and precipitation[J]. Monthly Weather Review, 132(1): 103-120.
DOI URL |
| [25] |
KAIN J S, 2004. The Kain-Fritsch convective parameterization: An update[J]. Journal of Applied Meteorology, 43(1): 170-181.
DOI URL |
| [26] |
KLEMP J B, LILLY D K, 1978. Numerical simulation of hydrostatic mountain waves[J]. Journal of the Atmospheric Sciences, 35(1): 78-107.
DOI URL |
| [27] |
LILLY D K, 1978. A severe downslope windstorm and aircraft turbulence event induced by a mountain wave[J]. Journal of the Atmospheric Sciences, 35(1): 59-77.
DOI URL |
| [28] | MLAWER E J, TAUBMAN S J, BROWN P D, et al, 1997. Radiative transfer for inhomogeneous atmospheres: RRTM, a validated correlated-k model for the longwave[J]. Journal of Geophysical Research: Atmospheres, 102(D14): 16 663-16 682. |
| [29] |
NOILHAN J, PLANTON S, 1989. A simple parameterization of land surface processes for meteorological models[J]. Monthly Weather Review, 117(3): 536-549.
DOI URL |
| [30] | OKAMOTO K, SATO K, AKIYOSHI H, 2011. A study on the formation and trend of the Brewer-Dobson circulation[J]. Journal of Geophysical Research, 116(D10): D10117. DOI:10.1029/2010jd014953. |
| [31] | SHESTAKOVA A A, TOROPOV P A, MATVEEVA T A, 2020. Climatology of extreme downslope windstorms in the Russian Arctic[J]. Weather and Climate Extremes, 28: 100256. DOI:10.1016/j.wace.2020.100256. |
| [32] |
SHIN H H, HONG S Y, 2015. Representation of the subgrid-scale turbulent transport in convective boundary layers at gray-zone resolutions[J]. Monthly Weather Review, 143(1): 250-271.
DOI URL |
| [33] | SKAMAROCK W C, KLEMP J B, DUDHIA J, et al, 2005. A description of the advanced research WRF version 2[M]. Boulder, Colorado: NCAR. |
| [34] | SMITH C M, SKYLLINGSTAD E D, 2011. Effects of inversion height and surface heat flux on downslope windstorms[J]. Monthly Weather Review, 139(12): 3 750-3 764. |
| [35] | VOSPER S B, 2004. Inversion effects on mountain lee waves[J]. Quarterly Journal of the Royal Meteorological Society, 130(600): 1 723-1 748. |
| [36] | ZHANG G X, ZHANG D L, SUN S F, 2018. On the orographically generated low-level easterly jet and severe downslope storms of March 2006 over the Tacheng Basin of northwest China[J]. Monthly Weather Review, 146(6): 1 667-1 683. |
| Viewed | ||||||
|
Full text |
|
|||||
|
Abstract |
|
|||||