Journal of Arid Meteorology ›› 2023, Vol. 41 ›› Issue (4): 607-619.DOI: 10.11755/j.issn.1006-7639(2023)-04-0607
• Articles • Previous Articles Next Articles
Pollution characteristics of two strong dust processes in northern China in March 2021
TU Aiqin1,2( ), WANG Zhenzhu3(), ZHU Genghua4, WANG Zhifei5, ZHANG Hai6, ZHANG Shuai6, LIU Dong3, WENG Ningquan3
- 1. Meteorological Engineering Technology Center of Shandong Province, Jinan 250031, China
2. Key Laboratory for Meteorological Disaster Prevention and Reduction of Shandong Province, Jinan 250031,;China
3. Anhui Institute of Optics and Fine Mechanics, Hefei Institutes of; Physical Science, Key Laboratory of Atmospheric Optics, Chinese Academy of Sciences, Hefei 230031, China
4. Meteorological Technology Equipment Center of Hebei Province, Shijiazhuang 050022, China
5. Jinan Environmental Monitoring Center of Shandong Province, Jinan 250101, China
6. Hefei Zhongke Guangbo Quantum Technology Co., Ltd, Hefei 230011, China
-
Received:2022-07-29Revised:2022-09-15Online:2023-08-31Published:2023-08-29
2021年3月中国北方两次强沙尘天气污染特征
涂爱琴1,2(), 王珍珠3(), 朱庚华4, 王治非5, 张海6, 张帅6, 刘东3, 翁宁泉3
- 1.山东省气象工程技术中心,山东 济南 250031
2.山东省气象防灾减灾重点实验室,山东 济南 250031
3.中国科学院合肥物质科学研究院安徽光学精密机械研究所,中国科学院大气光学重点实验室,安徽 合肥 230031
4.河北省气象技术装备中心,河北 石家庄 050022
5.山东省济南生态环境监测中心,山东 济南 250101
6.合肥中科光博量子科技有限公司,安徽 合肥 230011
-
通讯作者:王珍珠(1981—),男,研究员,主要从事激光雷达研制和激光大气探测方面的研究。E-mail:zzwang@aiofm.ac.cn。 -
作者简介:涂爱琴(1983—),女,高级工程师,主要从事大气参数测量与分析方面的研究。E-mail:tuaiqin@mail.ustc.edu.cn。 -
基金资助:国家自然科学基金项目(41975038);安徽省自然科学基金项目(2008085J33);安徽省重点研发计划项目(2022h11020008);中科院青促会项目(Y2021113)
CLC Number:
Cite this article
TU Aiqin, WANG Zhenzhu, ZHU Genghua, WANG Zhifei, ZHANG Hai, ZHANG Shuai, LIU Dong, WENG Ningquan. Pollution characteristics of two strong dust processes in northern China in March 2021[J]. Journal of Arid Meteorology, 2023, 41(4): 607-619.
涂爱琴, 王珍珠, 朱庚华, 王治非, 张海, 张帅, 刘东, 翁宁泉. 2021年3月中国北方两次强沙尘天气污染特征[J]. 干旱气象, 2023, 41(4): 607-619.
share this article
Add to citation manager EndNote|Ris|BibTeX
URL: http://www.ghqx.org.cn/EN/10.11755/j.issn.1006-7639(2023)-04-0607
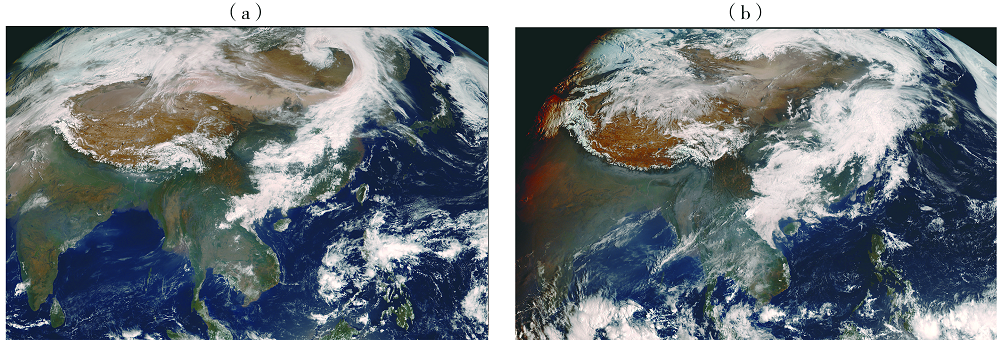
Fig.1 Synthetic true color map captured by FY-4A satellite at 11:30 on 15 March 2021 (a) and 09:45 on 27 March 2021 (b)
Fig.1 Synthetic true color map captured by FY-4A satellite at 11:30 on 15 March 2021 (a) and 09:45 on 27 March 2021 (b)

Fig.2 The 36 h backward trajectories of air mass starting from Shijiazhuang (a, b) and Jinan (c, d) at the initial stage of the dust processes on 15 March (a, c) and 27 March (b, d),2021
Fig.2 The 36 h backward trajectories of air mass starting from Shijiazhuang (a, b) and Jinan (c, d) at the initial stage of the dust processes on 15 March (a, c) and 27 March (b, d),2021

Fig.3 Hourly variation of particulate mass concentration and precipitation in Shijiazhuang (a, b) and Jinan (c, d) during the strong dust processes on 15 March (a, c) and 27 March (b, d),2021
Fig.3 Hourly variation of particulate mass concentration and precipitation in Shijiazhuang (a, b) and Jinan (c, d) during the strong dust processes on 15 March (a, c) and 27 March (b, d),2021
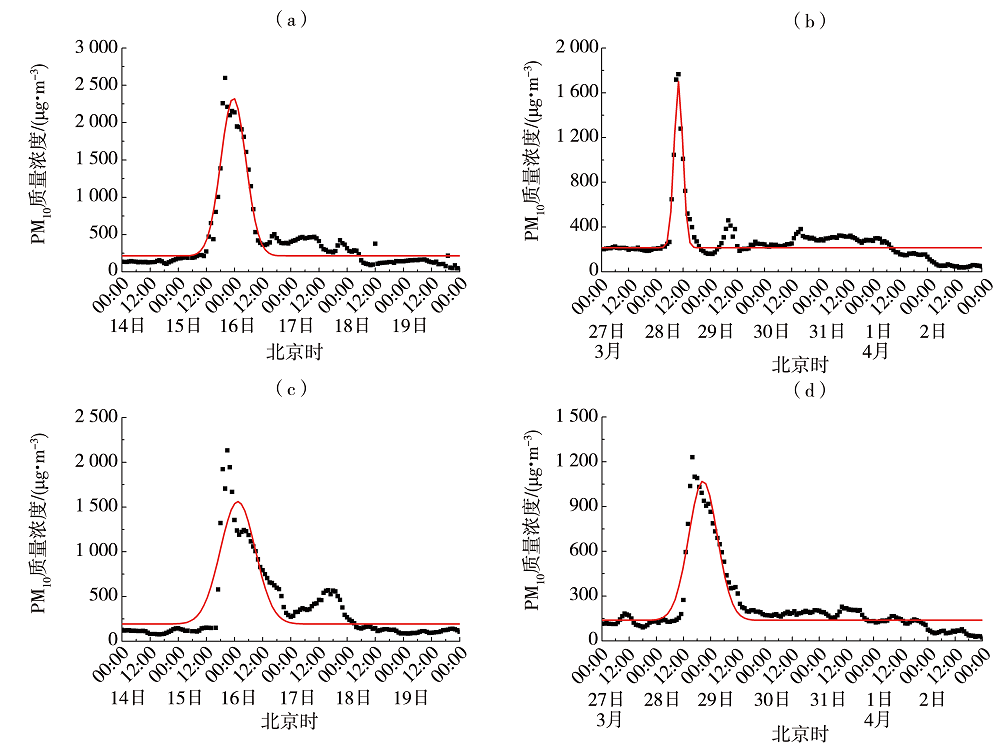
Fig.4 Fitting curves of PM10 hourly mass concentration in Shijiazhuang (a, b) and Jinan (c, d) during the strong dust processes on 15 March (a, c) and 27 March (b, d),2021
Fig.4 Fitting curves of PM10 hourly mass concentration in Shijiazhuang (a, b) and Jinan (c, d) during the strong dust processes on 15 March (a, c) and 27 March (b, d),2021
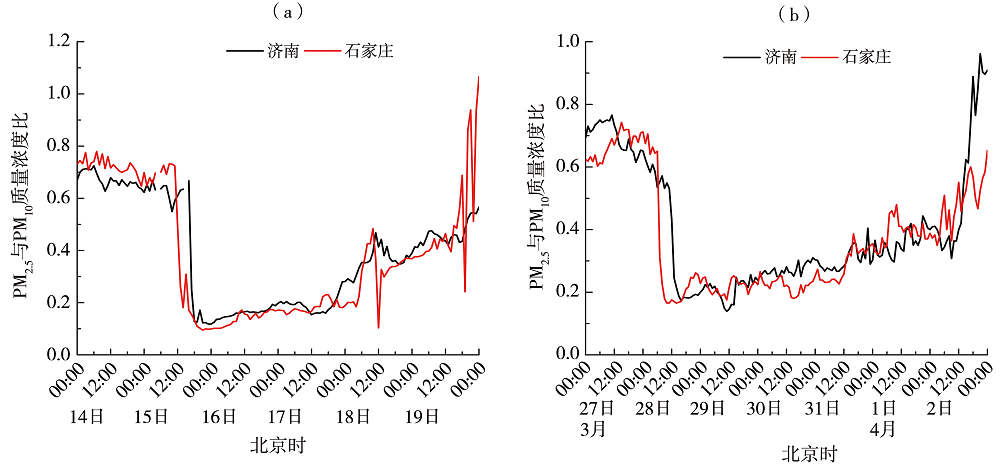
Fig.5 Hourly variation of mass concentration ratio of PM2.5 to PM10 during the strong dust processes on 15 March (a) and 27 March (b),2021
Fig.5 Hourly variation of mass concentration ratio of PM2.5 to PM10 during the strong dust processes on 15 March (a) and 27 March (b),2021
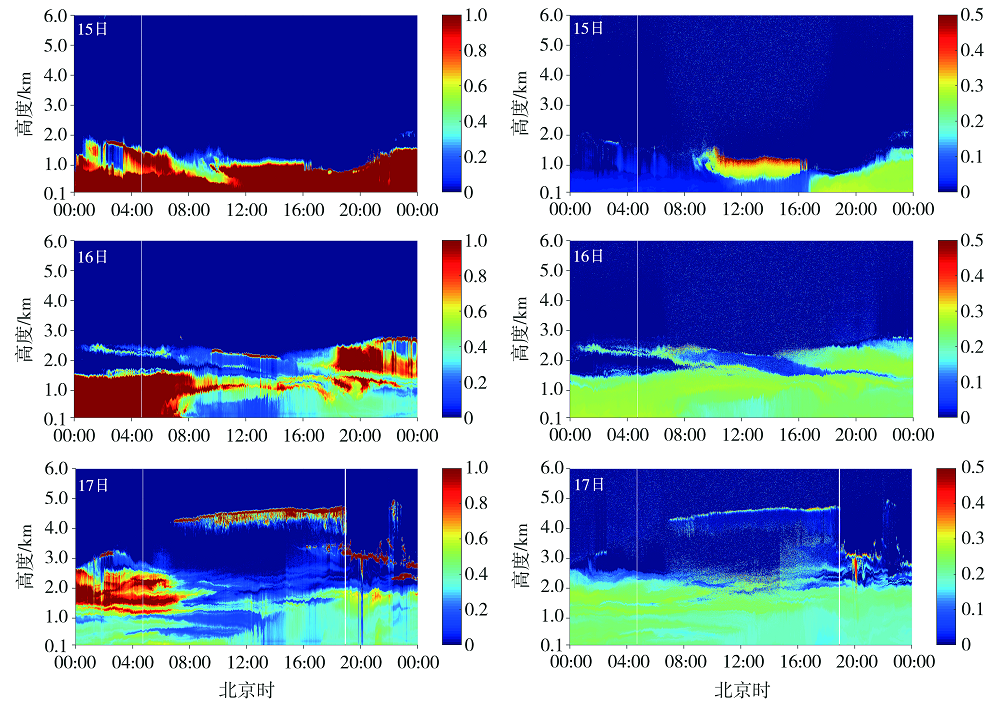
Fig.6 The time-height evolution of extinction coefficient (the left) and depolarization ratio (the right) of Shijiazhuang lidar from 15 to 17 March 2021 (The data missed at the white line. The same as below )
Fig.6 The time-height evolution of extinction coefficient (the left) and depolarization ratio (the right) of Shijiazhuang lidar from 15 to 17 March 2021 (The data missed at the white line. The same as below )

Fig.7 The time-height evolution of extinction coefficient (the left) and depolarization ratio (the right) of Jinan lidar from 15 to 17 March 2021
Fig.7 The time-height evolution of extinction coefficient (the left) and depolarization ratio (the right) of Jinan lidar from 15 to 17 March 2021

Fig.8 The time-height evolution of extinction coefficient (the left) and depolarization ratio (the right) of Shijiazhuang lidar from 28 March to 30 March 2021
Fig.8 The time-height evolution of extinction coefficient (the left) and depolarization ratio (the right) of Shijiazhuang lidar from 28 March to 30 March 2021
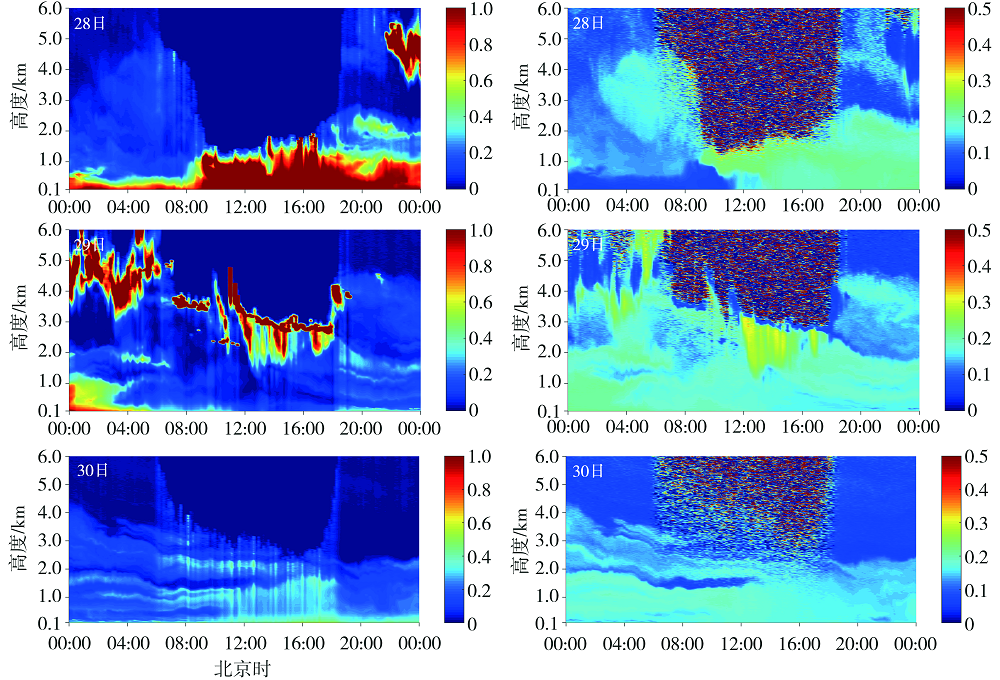
Fig.9 The time-height evolution of extinction coefficient (the left) and depolarization ratio (the right) of Jinan lidar from 28 to 30 March 2021
Fig.9 The time-height evolution of extinction coefficient (the left) and depolarization ratio (the right) of Jinan lidar from 28 to 30 March 2021
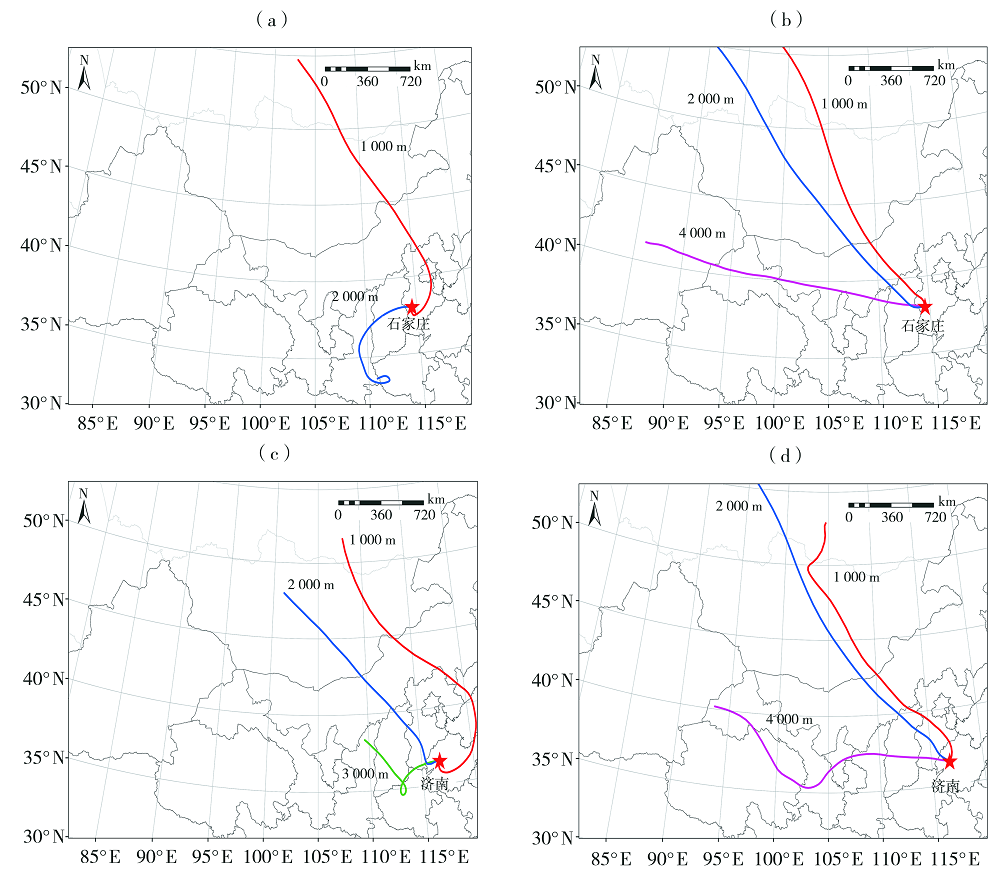
Fig.10 The 48 h backward trajectories of air mass starting from Shijiazhuang (a, b) and Jinan (c, d) at 00:00 on 17 (a, c) and 00:00 on 29 (b, d) March 2021
Fig.10 The 48 h backward trajectories of air mass starting from Shijiazhuang (a, b) and Jinan (c, d) at 00:00 on 17 (a, c) and 00:00 on 29 (b, d) March 2021
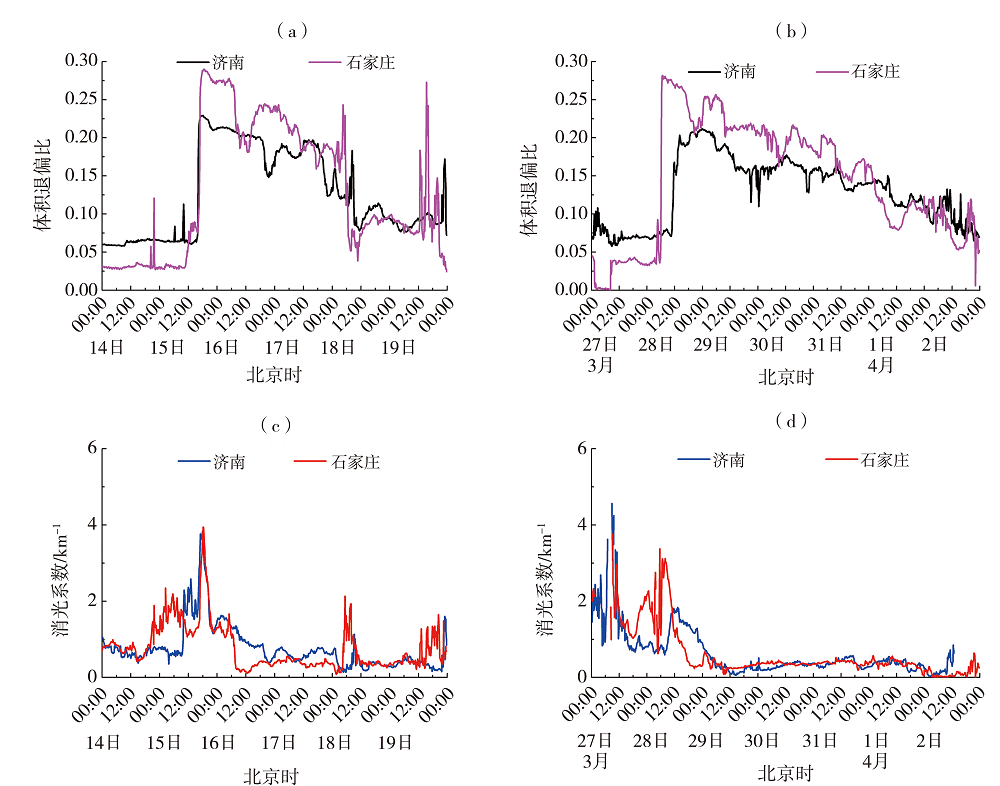
Fig.11 The temporal variation of depolarization ratio (a, b) and extinction coefficient (c, d) at 195 m height over Jinan and Shijiazhuang during the strong dust processes from 14 to 19 March (a, c) and from 27 March to 2 April (b, d),2021
Fig.11 The temporal variation of depolarization ratio (a, b) and extinction coefficient (c, d) at 195 m height over Jinan and Shijiazhuang during the strong dust processes from 14 to 19 March (a, c) and from 27 March to 2 April (b, d),2021
Tab.1 Determination of starting and ending time of dust affecting Shijiazhuang and Jinan
| 城市 | “3·15”过程 | “3·27”过程 | |||||||||
|---|---|---|---|---|---|---|---|---|---|---|---|
| 开始前6 h PM10平均质量浓度/(µg·m-3) | 开始时PM10质量浓度/(µg·m-3) | 开始 时间 | 结束时PM10质量浓度/(µg·m-3) | 结束 时间 | 开始前6 h PM10平均质量浓度/(µg·m-3) | 开始时PM10质量浓度/(µg·m-3) | 开始 时间 | 结束时PM10质量浓度/(µg·m-3) | 结束 时间 | ||
| 石家庄 | 222 | 471 | 15日 13:00 | 236 | 18日 05:00 | 231 | 648 | 28日 07:00 | 230 | 28日 19:00 | |
| 济南 | 149 | 578 | 15日 17:00 | 158 | 18日 04:00 | 169 | 594 | 28日 13:00 | 178 | 29日 23:00 | |
Tab.2 Determination of starting and ending time of dust affecting Shijiazhuang and Jinan based on the improved method
| 城市 | “3·15”过程 | “3·27”过程 | |||||||||||
|---|---|---|---|---|---|---|---|---|---|---|---|---|---|
| 开始 | 结束 | 开始 | 结束 | ||||||||||
| 浓度 比 | 时间 | PM10质量浓度/ (µg·m-3) | 浓度 比 | 时间 | 浓度 比 | 时间 | PM10质量浓度/ (µg·m-3) | 浓度比 | 时间 | ||||
| 石家庄 | 0.26 | 15日13:00 | 108 | 0.43 | 18日08:00 | 0.31 | 28日07:00 | 244 | 0.45 | 4月1日07:00 | |||
| 济南 | 0.25 | 15日17:00 | 139 | 0.47 | 18日11:00 | 0.25 | 28日13:00 | 131 | 0.40 | 3月31日22:00 | |||

Fig.12 Variation of mass concentration of PM2.5 (a) and PM10 (b) as well as their ratio (c), and depolarization ratio (d) at different stages of two strong dust processes in Shijiazhuang and Jinan
Fig.12 Variation of mass concentration of PM2.5 (a) and PM10 (b) as well as their ratio (c), and depolarization ratio (d) at different stages of two strong dust processes in Shijiazhuang and Jinan
| [1] | 包新荣, 王莉娜, 杨燕萍, 等, 2021. 基于激光雷达对兰州市强沙尘过程的分析研究[J]. 干旱区资源与环境, 35(1): 92-99. |
| [2] | 段伯隆, 刘新伟, 郭润霞, 等, 2021. “3·15”北方强沙尘暴天气成因分析[J]. 干旱气象, 39(4): 541-553. |
| [3] | 邓文舫, 2022. 基于高斯-多项式拟合的FBG解调[J]. 电子技术与软件工程, 24: 131-136. |
| [4] | 高泽田, 胡秀清, 张小曳, 等, 2022. 基于FY-4卫星遥感数据分析2021年3次沙尘暴特征[J]. 气象科技, 50(4): 536-544. |
| [5] | 关良, 张涛, 李鑫, 2021. 2021年3月大气环流和天气分析[J]. 气象, 47(6): 767-772. |
| [6] | 国家气象中心, 中国气象局预报与网络司, 2017. 沙尘天气等级: GB/T 20480—2017[S]. 北京: 中国标准出版社. |
| [7] | 韩满都拉, 2021. 超强沙尘暴袭击我国北方[J]. 生态经济, 37(5): 9-12. |
| [8] |
胡元洁, 蒋楠, 2020. 沙尘天气对西安市环境空气质量的影响[J]. 中国沙漠, 40(6): 53-60.
DOI |
| [9] | 李鹏, 肖致美, 唐邈, 等, 2020. 天津典型沙尘天气过程颗粒物污染特征[J]. 生态与农村环境学报, 36(12): 1 562-1 539. |
| [10] | 刘文彬, 刘涛, 黄祖照, 等, 2013. 利用偏振-米散射激光雷达研究广州一次浮尘天气过程[J]. 中国环境科学, 33(10): 1 751-1 757. |
| [11] |
柳本立, 彭婉月, 刘树林, 等, 2022. 2021年3月中旬东亚中部沙尘天气地面起尘量及源区贡献率估算[J]. 中国沙漠, 42(1): 79-86.
DOI |
| [12] |
史忠林, 张信宝, 张润川, 2022. 2021年“3·15”沙尘暴沙尘来源核素示踪研究[J]. 中国沙漠, 42(2): 1-5.
DOI |
| [13] | 王宁, 陈健, 张缘园, 等, 2022. 2021年中国北方首次沙尘天气的多源遥感分析[J]. 中国环境科学, 42(5): 2 002-2 014. |
| [14] | 王莹, 2022. 高斯极大似然估计的新冠疫情周期性预测分析[J]. 现代计算机, 28(23): 49-54. |
| [15] | 王英俭, 胡顺星, 周军, 等, 2014. 激光雷达大气参数测量——中国东部重要大气参数高分辨率垂直分布探查[M]. 北京: 科学出版社: 6-7. |
| [16] |
吴焕波, 陈强, 新波, 等, 2018. 一次强沙尘天气过程及其对PM10时空分布的影响[J]. 干旱气象, 36(1): 117-123.
DOI |
| [17] | 杨昊, 谢晨波, 方志远, 等, 2021. 星-地激光雷达联合观测合肥地区的气溶胶垂直分布[J]. 中国激光, 48(1): 166-177. |
| [18] |
杨晓军, 张强, 叶培龙, 等, 2021. 中国北方2021年3月中旬持续性沙尘天气的特征及其成因[J]. 中国沙漠, 41(3): 245-255.
DOI |
| [19] | 张文娟, 李敏, 吕波, 等, 2019. 济南地区一次沙尘过程的激光雷达观测分析[J]. 中国环境监测, 35(5): 165-176. |
| [20] | 张哲, 乔利平, 周敏, 等, 2021. 输送、滞留叠加海上回流的长时间沙尘天气影响判断及贡献分析[J]. 环境科学, 42(2): 584-594. |
| [21] | 中华人民共和国生态环境部, 2017. 关于印发《受沙尘天气过程影响城市空气质量评价补充规定》的通知[EB/OL]. [2022-07-29]. https://www.mee.gov.cn/gkml/hbb/bgt/201701/t20170106_394054.htm. |
| [22] |
FILONCHYK M, 2022. Characteristics of the severe March 2021 Gobi Desert dust storm and its impact on air pollution in China[J]. Chemosphere, 287(P3), 132219. DOI: 10.1016/J.CHEMOSPHERE.2021.132219.
DOI URL |
| [23] | KAWAI K, KAI K, JIN Y, et al, 2018. Lidar network observation of dust layer development over the Gobi Desert in association with a cold frontal system on 22-23 May 2013[J]. Journal of the Meteorological Society of Japan, 96(3): 255-268. |
| [24] | KE G, YAO W R, CHE H Z, et al, 2022. Record-breaking dust loading during two mega dust storm events over northern China in March 2021: aerosol optical and radiative properties and meteorological drivers[J]. Atmospheric Chemistry and Physics, 22: 7 905-7 932 |
| [25] |
LIU D, WANG Z E, LIU Z, et al, 2008. A height resolved global view of dust aerosols from the first year CALIPSO lidar measurements[J]. Journal of Geophysical Research: Atmospheres, 113(D16), D16214. DOI: 10.1029/2007JD009776
DOI URL |
| [26] | MAMOURI R E, ANSMANN A, 2014. Fine and coarse dust separation with polarization lidar[J]. Atmospheric Measurement Techniques, 7: 5 173-5 221 |
| [27] | ROLPH G, STEIN A, STUNDER B, 2017. Real-time Environmental Applications and Display system: READY[J]. Environmental Modelling & Software, 95: 210-228. |
| [28] |
STEIN A F, DRAXLER R R, ROLPH G D, et al, 2015. NOAA’s HYSPLIT atmospheric transport and dispersion modeling system[J]. Bulletin of the American Meteorological Society, 96: 2 059-2 077
DOI URL |
| [29] |
SUGIMOTO N, SHIMIZU A, NISHIZAWA T, et al, 2020. Long-range-transported mineral dust from Africa and middle east to east Asia observed with the Asian dust and aerosol lidar observation network (AD-Net)[C]// The 29th International Laser Radar Conference (ILRC 29). DOI: 10.1051/J.EPJCONF/202023705009.
DOI |
| [30] |
TIAN X M, LIU D, FU S L, et al, 2019. Characterization of spring air pollution of Beijing in 2019 using active and passive remote sensing instruments[J]. The International Archives of the Photogrammetry, Remote Sensing and Spatial Information Sciences, XLII-3/W9: 153-158. DOI: 10.5194/isprs-archives-XLII-3-W9-153-2019.
DOI URL |
| [31] |
XIE C B, NISHIZAWA T, SUGIMOTO N, et al, 2008. Characteristics of aerosol optical properties in pollution and Asian dust episodes over Beijing, China[J]. Applied Optics, 47: 4 945-4 951.
DOI URL |
| [32] |
YANG S, PREILER J, WIEGNER M, et al, 2020. Monitoring dust events using doppler lidar and ceilometer in Iceland[J]. Atmosphere, 11(12), 1294. DOI: 10.3390/ATMOS 11121294.
DOI |
| [1] | LIANG Guohao, MAO Rui, SHAO Yaping, LI Xiaolan, GONG Daoyi. Research progress of convective turbulent dust emission [J]. Journal of Arid Meteorology, 2023, 41(4): 531-539. |
| [2] | LIAO Jiayan, ZHOU Tian, HAN Biseng, HUANG Zhongwei, BI Jianrong. Aerosol types discrimination in semi-arid region of Northwest China using ground-based lidar data [J]. Journal of Arid Meteorology, 2023, 41(4): 570-578. |
| [3] | XU Luyang, ZHAI liang, WANG Yuanyuan, LEI Lei, YU Bo, HAO Cui, QIN Qingchang. Application evaluation of multi-source remote sensing data in spring dust weather monitoring in Beijing [J]. Journal of Arid Meteorology, 2023, 41(2): 318-327. |
| [4] | DUAN Bolong, LIU Xinwei, GUO Runxia, SONG Qiang, DI Xiaohong, DUAN Mingkeng. Cause Analysis on Severe Dust Storm in Northern China on 15 March 2021 [J]. Journal of Arid Meteorology, 2021, 39(4): 541-553. |
| [5] | . Aircraft Measurements of Distribution of Aerosol over Golmud in Qinghai Province [J]. Journal of Arid Meteorology, 2021, 39(4): 603-609. |
| [6] | ZHANG Kaijun, FU Longyan, LI Lanqian, SHAO Aimei. Comparison of Two Lidarbased Alerting Algorithms for Low-level Wind Shear [J]. Journal of Arid Meteorology, 2021, 39(4): 652-661. |
| [7] | REN Yong, CHEN Sai, YU Anan, FAN Mengqi. Reliability Analysis of Wind Field and Boundary Layer Height in Xiamen Retrieved by Coherent Doppler Wind Lidar [J]. Journal of Arid Meteorology, 2021, 39(3): 514-523. |
| [8] |
CAO Xiaoyun, XIAO Jianshe, QIAO Bin, CHEN Guoqian, QUAN Chen, ZHU Cunxiong, SHI Feifei, .
Temporal and Spatial Variation Characteristics of DustIntensity in Qaidam Basin from 1961 to 2019#br#
#br#
[J]. Journal of Arid Meteorology, 2021, 39(1): 46-53.
|
| [9] | . Characteristics of Atmospheric-boundary-layer Height and Its Relationship with Sand-dust Weather in Jiuquan of Gansu Province [J]. Journal of Arid Meteorology, 2020, 38(6): 979-986. |
| [10] | QI Donglin1,2, ZHAO Quanning1, ZHAO Huifang1, HAN Tingfang3, SU Wenjiang1. Temporal and Spatial Variation Characteristics and Regional Differences of Dust Fall in Qinghai from 2004 to 2017 [J]. Journal of Arid Meteorology, 2018, 36(6): 927-. |
| [11] | GOU Yuqing, XU Dongbei. Comprehensive Analysis of a Severe Pollution Process in Chengdu in Late December 2017 [J]. Journal of Arid Meteorology, 2018, 36(6): 1012-. |
| [12] | WANG Weijia, GUO Xueliang, LI Hongyu, DONG Xiaobo. Aerosols Characteristics Beneath the Clouds Based on Airborne Observation in Early Summer over Sichuan Basin [J]. Journal of Arid Meteorology, 2018, 36(2): 167-175. |
| [13] | JIANG Xuegong, LI Xiazi, WANG Dejun. Characteristics of Tropopause Evolution and Dust Vertical Transportation During a Mongolia Cyclone Dust Storm Process [J]. Journal of Arid Meteorology, 2018, 36(1): 1-10. |
| [14] | BAI Bing, ZHANG Qiang,CHEN Xuhui,HAN Haitao . Moving Paths and Spatial Characteristics of Three Typical Dust Processes in East Asia [J]. Journal of Arid Meteorology, 2018, 36(1): 11-16. |
| [15] | ZHOU Chenglong, YANG Xinghua, YANG Fan, HUO Wen,ZHONG Xinjie, PAN Honglin, HE Qing. Analysis of Calculated Dust Emission Threshold Wind Speed Based on the Field Experiments [J]. Journal of Arid Meteorology, 2018, 36(1): 90-96. |
| Viewed | ||||||
|
Full text |
|
|||||
|
Abstract |
|
|||||