Journal of Arid Meteorology ›› 2021, Vol. 39 ›› Issue (06): 1031-1038.DOI: 10.11755/j.issn.1006-7639(2021)-06-1031
• Technology and Applications • Previous Articles Next Articles
Application of different comfort indexes in maximum electric power load forecasting
HE Liwei1( ), REN Yongjian1(), XIA Qing2
- 1. Hubei Meteorological Service Center, Wuhan 430074, China
2. Hubei Public Meteorological Service Centre, Wuhan 430074, China
-
Received:2020-10-23Revised:2020-12-15Online:2021-12-30Published:2021-12-31 -
Contact:REN Yongjian
不同舒适度指数在最大电力负荷预测中的应用
- 1.湖北省气象服务中心,湖北 武汉 430074
2.湖北省公众气象服务中心,湖北 武汉 430074
-
通讯作者:任永建 -
作者简介:贺莉微(1988— ),女,工程师,主要从事应用气象研究. E-mail: 616664366@qq.com。 -
基金资助:湖北省气象局科技基金重点项目(2019Z08);中国气象局气候变化专项共同资助(CCFS202033)
CLC Number:
Cite this article
HE Liwei, REN Yongjian, XIA Qing. Application of different comfort indexes in maximum electric power load forecasting[J]. Journal of Arid Meteorology, 2021, 39(06): 1031-1038.
贺莉微, 任永建, 夏青. 不同舒适度指数在最大电力负荷预测中的应用[J]. 干旱气象, 2021, 39(06): 1031-1038.
share this article
Add to citation manager EndNote|Ris|BibTeX
URL: http://www.ghqx.org.cn/EN/10.11755/j.issn.1006-7639(2021)-06-1031
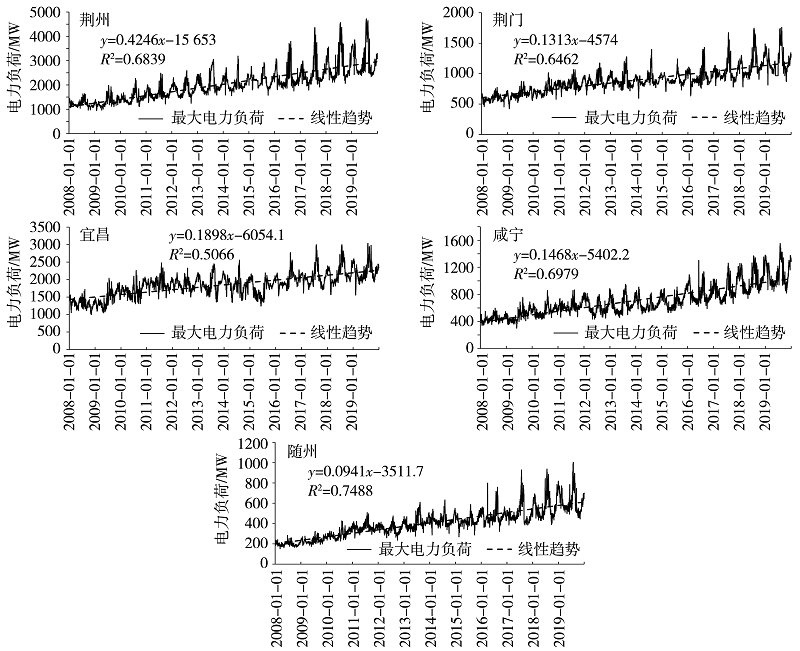
Fig.1 Daily maximum power load and its linear trend in Jingzhou, Jingmen, Yichang, Xianning and Suizhou of Hubei Province from 2008 to 2019
Fig.1 Daily maximum power load and its linear trend in Jingzhou, Jingmen, Yichang, Xianning and Suizhou of Hubei Province from 2008 to 2019
Tab.1 Correlation coefficients between temperature and Lpm in summer and winter in different areas of Hubei Province from 2008 to 2019
| 地区 | 季节 | 平均气温 | 最高气温 | 最低气温 |
|---|---|---|---|---|
| 荆州 | 夏季 | 0.81*** | 0.76*** | 0.77*** |
| 冬季 | -0.61*** | -0.57*** | -0.49*** | |
| 荆门 | 夏季 | 0.75*** | 0.72*** | 0.71*** |
| 冬季 | -0.32*** | -0.33*** | -0.29*** | |
| 宜昌 | 夏季 | 0.64*** | 0.61*** | 0.60*** |
| 冬季 | -0.15** | -0.14** | -0.13** | |
| 咸宁 | 夏季 | 0.69*** | 0.66*** | 0.62*** |
| 冬季 | -0.48*** | -0.49*** | -0.33*** | |
| 随州 | 夏季 | 0.75*** | 0.69*** | 0.62*** |
| 冬季 | -0.49*** | -0.49*** | -0.30*** |
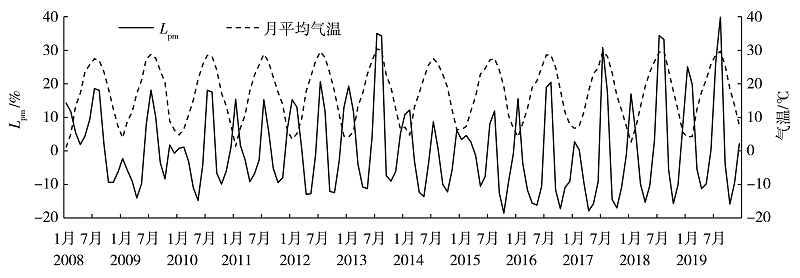
Fig.2 Monthly variation of Lpm and average temperature in Jingzhou of Hubei Province from 2008 to 2019
Fig.2 Monthly variation of Lpm and average temperature in Jingzhou of Hubei Province from 2008 to 2019
Tab.2 Correlation coefficients between Lpm and four comfort indexes in summer and winter in different areas of Hubei Province from 2008 to 2019
| 地区 | 季节 | I | ET | Te | MSLI |
|---|---|---|---|---|---|
| 荆州 | 夏季 | 0.80*** | 0.72*** | 0.61*** | 0.74*** |
| 冬季 | -0.60*** | -0.42*** | -0.29*** | -0.60*** | |
| 荆门 | 夏季 | 0.73*** | 0.65*** | 0.51*** | 0.68*** |
| 冬季 | -0.29*** | -0.16* | -0.12 | -0.29*** | |
| 宜昌 | 夏季 | 0.63*** | 0.55*** | 0.57*** | 0.61*** |
| 冬季 | -0.14* | -0.07 | 0.04* | -0.14* | |
| 咸宁 | 夏季 | 0.66*** | 0.66*** | 0.58*** | 0.64*** |
| 冬季 | -0.48*** | -0.37*** | -0.18*** | -0.48*** | |
| 随州 | 夏季 | 0.72*** | 0.68*** | 0.60*** | 0.68*** |
| 冬季 | -0.48*** | -0.30*** | -0.27*** | -0.49*** |

Fig.3 The monthly variation of correlation coefficients between Lpm and four comfort indexes in summer and winter in different areas of Hubei Province from 2008 to 2019
Fig.3 The monthly variation of correlation coefficients between Lpm and four comfort indexes in summer and winter in different areas of Hubei Province from 2008 to 2019
Tab.3 The absolute relative error (ARE) of forecast values of daily maximum power load in different areas of Hubei from June to August 2019
| 地区 | 舒适度 指数 | ARE<3%的占比 | ARE<5%的占比 | 最大ARE | ARE的平均值 | |||||||
|---|---|---|---|---|---|---|---|---|---|---|---|---|
| 多元 回归 | BP神经 网络 | 多元 回归 | BP神经 网络 | 多元 回归 | BP神经 网络 | 多元 回归 | BP神经 网络 | |||||
| 荆州 | I | 38.0 | 32.6 | 55.4 | 58.7 | 26.9 | 24.7 | 5.8 | 5.6 | |||
| ET | 38.0 | 35.9 | 54.3 | 58.7 | 26.9 | 20.6 | 5.8 | 5.4 | ||||
| Te | 38.0 | 44.6 | 60.9 | 62.0 | 27.4 | 27.1 | 5.5 | 5.3 | ||||
| MSLI | 38.0 | 39.1 | 54.3 | 64.1 | 27.5 | 27.5 | 5.8 | 5.4 | ||||
| 荆门 | I | 35.9 | 40.2 | 53.3 | 60.9 | 25.5 | 26.0 | 5.0 | 4.5 | |||
| ET | 37.0 | 52.2 | 53.3 | 76.1 | 25.5 | 26.7 | 5.0 | 3.8 | ||||
| Te | 37.0 | 38.0 | 56.5 | 58.7 | 25.9 | 26.1 | 4.8 | 4.9 | ||||
| MSLI | 34.8 | 47.8 | 53.3 | 73.9 | 25.4 | 26.5 | 5.0 | 4.0 | ||||
| 宜昌 | I | 57.6 | 57.6 | 79.3 | 80.4 | 16.1 | 13.8 | 3.2 | 3.2 | |||
| ET | 55.4 | 54.3 | 79.3 | 81.5 | 16.3 | 16.5 | 3.2 | 3.3 | ||||
| Te | 54.3 | 56.5 | 79.3 | 79.3 | 15.7 | 15.0 | 3.2 | 3.1 | ||||
| MSLI | 56.5 | 56.5 | 79.3 | 79.3 | 16.0 | 15.6 | 3.2 | 3.1 | ||||
| 咸宁 | I | 43.5 | 39.1 | 70.7 | 65.2 | 17.6 | 17.2 | 4.1 | 4.1 | |||
| ET | 42.4 | 43.5 | 70.7 | 66.3 | 17.8 | 15.8 | 4.1 | 3.9 | ||||
| Te | 42.4 | 31.5 | 69.6 | 60.9 | 16.9 | 15.7 | 4.1 | 4.6 | ||||
| MSLI | 42.4 | 41.3 | 69.6 | 68.5 | 17.2 | 17.6 | 4.1 | 4.1 | ||||
| 随州 | I | 28.3 | 32.6 | 45.7 | 51.1 | 18.7 | 19.1 | 6.4 | 5.9 | |||
| ET | 28.3 | 33.7 | 44.6 | 52.2 | 19.0 | 19.9 | 6.4 | 5.9 | ||||
| Te | 23.9 | 28.3 | 47.8 | 50.0 | 17.9 | 17.5 | 6.4 | 6.0 | ||||
| MSLI | 27.2 | 29.3 | 46.7 | 50.0 | 18.9 | 19.0 | 6.4 | 5.8 | ||||
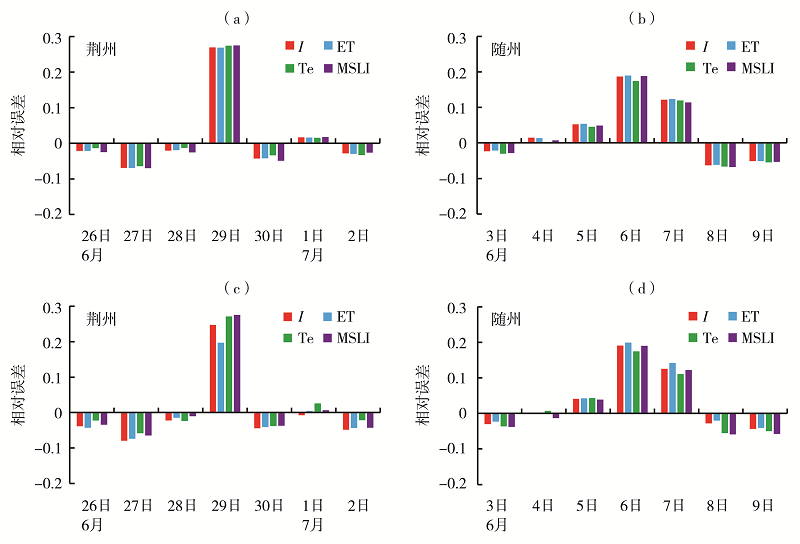
Fig.4 The daily variation of relative error of daily maximum power load forecast values based on multiple regression (a, b) and BP neural networks (c, d) in Jingzhou from 26 June to 2 July (a, c) and Suizhou from 3 to 9 June (b, d) 2019
Fig.4 The daily variation of relative error of daily maximum power load forecast values based on multiple regression (a, b) and BP neural networks (c, d) in Jingzhou from 26 June to 2 July (a, c) and Suizhou from 3 to 9 June (b, d) 2019
| [1] | 胡江林, 陈正洪, 洪斌, 等. 华中电网日负荷与气象因子的关系[J]. 气象, 2002, 28(3):14-19. |
| [2] | 陈正洪, 洪斌. 华中电网四省日用电量与气温关系的评估[J]. 地理学报, 2000, 55(增刊1):34-38. |
| [3] | 卢珊, 高红燕, 李建科, 等. 西安市居民用电量对气象因子的响应及预测[J]. 干旱气象, 2017, 35(5):886-892. |
| [4] | 张彦恒, 杨琳晗, 武辉芹, 等. 冀北电网电力负荷特征与气温的关系[J]. 干旱气象, 2016, 34(5):881-885. |
| [5] | 叶殿秀, 张培群, 赵珊珊, 等. 北京夏季日最大电力负荷预报模型建立方法探讨[J]. 气候与环境研究, 2013, 18(6):804-810. |
| [6] | 熊明明, 李明财, 任雨, 等. 天津电力负荷特性及其与气象因子的关系[J]. 气象科技, 2013, 41(3):577-582. |
| [7] | 张自银, 马京津, 雷杨娜. 北京市夏季电力负荷逐日变率与气象因子关系[J]. 应用气象学报, 2011, 22(6):760-765. |
| [8] | 尹炤寅, 范进进, 陈幼姣, 等. 体感温度对夏季气象负荷率变化的影响研究——以湖北省黄石市为例[J]. 气象, 2017, 43(5):620-627. |
| [9] | 高亚静, 孙永健, 杨文海, 等. 基于新型人体舒适度的气象敏感负荷短期预测研究[J]. 中国电机工程学报, 2017, 37(7):1946-1954. |
| [10] | 中华人民共和国国家质量监督检验检疫总局, 中国国家标准化管理委员会. 人居环境气候舒适度评价: GB/T 27963—2011[S]. 北京: 中国标准出版社, 2012. |
| [11] | 中国气象局. 用电需求气象条件等级: QX/T 97—2008[S]. 北京: 中国标准出版社, 2008. |
| [12] | 中国气象局. 城市总体规划气候可行性论证技术规范: QX/T 242—2014[S]. 北京: 中国标准出版社, 2014. |
| [13] | 徐大海, 朱蒋. 人对温度湿度风速的感觉与着衣指数的分析研究[J]. 应用气象学报, 2000, 11(4):430-439. |
| [14] | 任永建, 熊守权, 洪国平, 等. 气象因子对夏季最大电力负荷的敏感性分析[J]. 气象, 2020, 46(8):1144-1153. |
| [15] | 武辉芹, 张金满, 曲晓黎. 河北省南部电网夏季电力负荷特征及与气象因子的关系[J]. 气象科技, 2013, 41(5):945-948. |
| [16] | 石玉恒, 赵娜, 王凌, 等. 北京地区日最大电力负荷预测模型初探[J]. 中国电力, 2019, 52(8):157-163. |
| [17] | 尤焕苓, 丁德平, 王春华, 等. 应用回归分析和BP神经网络方法模拟北京地区电力负荷[J]. 气象科技, 2008, 36(6):801-805. |
| [18] | 师彪, 李郁侠, 于新花, 等. 基于改进粒子群-径向基神经网络模型的短期电力负荷预测[J]. 电网技术, 2012, 33(17):180-184. |
| [19] | 李笋, 王超, 张桂林, 等. 基于支持向量回归的短期负荷预测[J]. 山东大学学报, 2017, 47(6):52-56. |
| [20] | 贺芳芳, 史军. 上海地区夏季气温变化对用电负荷的影响[J]. 长江流域资源与环境, 2011, 20(12):1462-1467. |
| [21] |
GOTMAN N, SHUMILOVA G, STARCEVA T. Electric load forecasting using an artificial neural networks[J]. IEEE Trans Power Systems, 2014, 6(2):442-449.
DOI URL |
| [22] | 隋惠惠. 基于BP神经网络的短期电力负荷预测的研究[D]. 哈尔滨: 哈尔滨工业大学, 2015. |
| [1] | MIN Jingjing,WANG Hua,DONG Yan. Forecast of Natural Gas Consumption in Heating Season Based on EMD and BP Neural Network Methods in Beijing [J]. Journal of Arid Meteorology, 2021, 39(5): 864-870. |
| [2] | ZHANG Yachun, MA Yaoming, MA Weiqiang, WANG Binbin, WANG Yuyang, . Evapotranspiration Variation and Its Correlation with Meteorological Factors on Different Underlying Surfaces of the Tibetan Plateau [J]. Journal of Arid Meteorology, 2021, 39(3): 366-373. |
| [3] | YANG Yang, YANG Qidong, WANG Zhilan, GAO Lu. A Study of Spatial and Temporal Distribution of Land Atmosphere Coupling Strength in China [J]. Journal of Arid Meteorology, 2021, 39(3): 374-385. |
| [4] |
LI Dan, YANG Liping, JIA Chengzhen.
Characteristics of Ground Surface Dead Fuel Moisture Content for Different Stand Types in Great Xing’an Mountains and Relevant Affecting Factors#br#
#br#
#br#
#br#
[J]. Journal of Arid Meteorology, 2021, 39(1): 144-150.
|
| [5] | GONG Jing, ZHU Shizhen, ZHANG Pengliang, WANG Qihua, WANG Lixia, GUO Sangang, ZHANG Boyue. Correlation between cloud characteristic parameters and precipitation in the eastern region of Qinghai [J]. Journal of Arid Meteorology, 2021, 39(06): 948-956. |
| [6] | HUANG Ying, YANG Jianling, SUN Yinchuan, WANG Fan, WANG Suyan, WANG Dai. Influence of external forcing factors on first frost date and its predition in Ningxia [J]. Journal of Arid Meteorology, 2021, 39(06): 957-965. |
| [7] | DU Jianhua, ZHENG Honghui, MO Yunyin, YANG Qingwen, . Risk Prediction Method of Road Flooding and Blocking Events in Hainan Province [J]. Journal of Arid Meteorology, 2020, 38(6): 1031-1036. |
| [8] | DU Jianhua, ZHENG Honghui, ZHAO Lei, CHEN Ming. Analysis on Meteorological Disaster Risk of Highway Around Hainan Island Caused by Heavy Rainfall [J]. Journal of Arid Meteorology, 2020, 38(4): 683-688. |
| [9] | XIN Zhihong, GUO Jianping, TAN Kaiyan, LIU Kaiwen, YANG Rongguang, ZHANG Lihua, SUN Yi. Relationship Between Amino Acid Quality of Winter Wheat and Meteorological Ecological Factors [J]. Journal of Arid Meteorology, 2020, 38(1): 148-156. |
| [10] | YANG Shuai, HOU Qiqi, GENG Xueying, GAO Yujun, LIU Xuan, ZHOU Peng. Changes of Maximum Frozen Soil Depth and Its Relationships with Temperature in Hebei Province During 1974-2016 [J]. Journal of Arid Meteorology, 2020, 38(03): 380-387. |
| [11] | YAN Kailin, YU Miao, GUO Li, LIAO Hong. Relationships Between Precipitation Anomaly in Meiyu Period in the Yangtze-Huaihe Region and Surface Sensible Heat Flux over East Asia [J]. Journal of Arid Meteorology, 2019, 37(5): 771-780. |
| [12] | YANG Xiaojun, ZHANG Nan, CHEN Hong, CONG Jing, XU Wei. Study on Forecast Method of Sea Wind in Bohai SeaBased on Artificial Neural Network Algorithm [J]. Journal of Arid Meteorology, 2019, 37(1): 146-152. |
| [13] | MA Qianrong1, YOU Qinglong1,2, CAI Miao3, ZHOU Yuquan3, LIU Juju1. The Cloud Variation over China in Recent 15 Years Based on CERES Satellite Data [J]. Journal of Arid Meteorology, 2018, 36(6): 911-. |
| [14] | DU Liangliang, ZHOU Xueying, ZHAO Youpu, WANG Shigong. Variation Characteristics of Extreme Precipitation Indexes and Their Relationships with Precipitation and Temperaturein Handan of Hebei Province from 1974 to 2015 [J]. Journal of Arid Meteorology, 2017, 35(6): 968-974. |
| [15] | DAI Lindong. A Case Analysis on Inverse Phenomenon of “Evaporation Paradox” [J]. Journal of Arid Meteorology, 2017, 35(6): 998-1003. |
| Viewed | ||||||
|
Full text |
|
|||||
|
Abstract |
|
|||||