Journal of Arid Meteorology ›› 2022, Vol. 40 ›› Issue (3): 415-423.DOI: 10.11755/j.issn.1006-7639(2022)-03-0415
• Articles • Previous Articles Next Articles
Projection of extreme temperature in Fujian based on CMIP6 output
CEHN Xiaochen1( ), TANG Zhenfei1(), CHEN Xikuan2, ZHENG Chaoyu1, LI Xinxin1, YANG Ting3
- 1. Fujian Provincial Climate Center, Fuzhou 350008,China
2. Ji’an Meteorological Bureau of Jiangxi Province, Ji’an 343006,Jiangxi,China
3. Fujian Provincial Meteorological Service Center, Fuzhou 350008,China
-
Received:2021-08-26Revised:2021-12-27Online:2022-06-30Published:2022-06-28 -
Contact:TANG Zhenfei
基于CMIP6的福建省极端气温预估
陈笑晨1(), 唐振飞1(), 陈锡宽2, 郑潮宇1, 李欣欣1, 杨婷3
- 1.福建省气候中心,福建 福州 350008
2.江西省吉安市气象局,江西 吉安 343006
3.福建省气象服务中心,福建 福州 350008
-
通讯作者:唐振飞 -
作者简介:陈笑晨(1989—),男,硕士,工程师,主要从事气候预测和气候变化研究.E-mail: 930571818@qq.com。 -
基金资助:福建省气象局开放式基金项目“SSPs情景下福建省未来极端事件的模拟与预估”(2021KX01);福建省气象局开放式气象科学研究基金项目(2020K01)
CLC Number:
Cite this article
CEHN Xiaochen, TANG Zhenfei, CHEN Xikuan, ZHENG Chaoyu, LI Xinxin, YANG Ting. Projection of extreme temperature in Fujian based on CMIP6 output[J]. Journal of Arid Meteorology, 2022, 40(3): 415-423.
陈笑晨, 唐振飞, 陈锡宽, 郑潮宇, 李欣欣, 杨婷. 基于CMIP6的福建省极端气温预估[J]. 干旱气象, 2022, 40(3): 415-423.
share this article
Add to citation manager EndNote|Ris|BibTeX
URL: http://www.ghqx.org.cn/EN/10.11755/j.issn.1006-7639(2022)-03-0415
Tab.1 Basic information of six CMIP6 global climate models
| 序号 | 模式 | 研究机构 | 空间分辨率 |
|---|---|---|---|
| 1 | BCC-CSM2-MR | 中国气象局国家气候中心 (BCC) | 1.125°×1.125° |
| 2 | EC-Earth3-Veg | 欧盟地球系统模式联盟 | 0.7°×0.7° |
| 3 | GFDL-ESM4 | 美国大气与海洋管理局地球物理流体动力实验室 (GFDL) | 1.0°×1.25° |
| 4 | IPSL-CM6A-LR | 法国皮埃尔-西蒙拉普斯研究所 (IPSL) | 1.26°×2.5° |
| 5 | MRI-ESM2-0 | 日本气象研究所(MRI) | 1.125°×1.125° |
| 6 | NorESM2-MM | 挪威气候中心 (NCC) | 0.94°×1.25° |
Tab.1 The definition of extreme temperature indices
| 名称 | 缩写 | 定义 | 单位 |
|---|---|---|---|
| 极端最高气温 | TXx | 每年日最高气温的最大值 | ℃ |
| 极端最低气温 | TNn | 每年日最低气温的最小值 | ℃ |
| 夏季日数 | Su | 每年日最高气温大于25 ℃的全部日数 | d |
| 暖昼日数 | TX90p | 每年日最高气温大于90百分位阈值的日数 | d |
Tab.1 The definition of extreme temperature indices
| 名称 | 缩写 | 定义 | 单位 |
|---|---|---|---|
| 极端最高气温 | TXx | 每年日最高气温的最大值 | ℃ |
| 极端最低气温 | TNn | 每年日最低气温的最小值 | ℃ |
| 夏季日数 | Su | 每年日最高气温大于25 ℃的全部日数 | d |
| 暖昼日数 | TX90p | 每年日最高气温大于90百分位阈值的日数 | d |
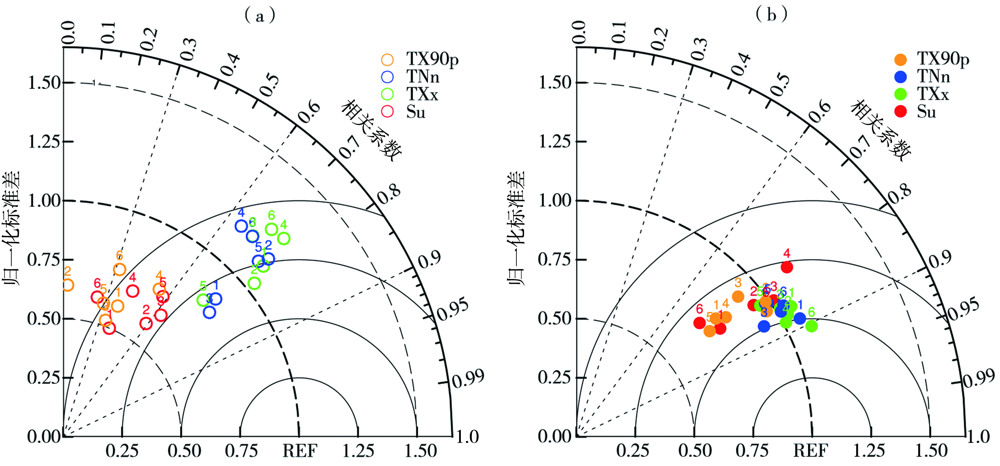
Fig.1 Taylor diagrams of simulated fields of four extreme temperature indices relative to observation fieldsin Fujian Province during historical reference period (a) before bias correction by QM method,(b) after bias correction by QM method(numbers 1 to 6 correspond to the model serial number in Table 1)
Fig.1 Taylor diagrams of simulated fields of four extreme temperature indices relative to observation fieldsin Fujian Province during historical reference period (a) before bias correction by QM method,(b) after bias correction by QM method(numbers 1 to 6 correspond to the model serial number in Table 1)

Fig.2 The spatial distribution of TXx (a) and TNn (b) (Unit:℃),Su (c) and TX90p (d) (Unit:d)simulations corrected by QM method during historical reference period
Fig.2 The spatial distribution of TXx (a) and TNn (b) (Unit:℃),Su (c) and TX90p (d) (Unit:d)simulations corrected by QM method during historical reference period
Tab.3 The change of extreme temperature indices during different period in the 21st century relative to historical reference period in Fujian Province under SSP2-4.5 and SSP5-8.5 scenarios
| 情景 | 时期 | TXx/ºC | TNn/ºC | Su/d | TX90p/d |
|---|---|---|---|---|---|
| 21世纪近期 | 1.11 | 1.00 | 15.94 | 8.04 | |
| SSP2-4.5 | 21世纪中期 | 2.12 | 1.88 | 31.82 | 19.89 |
| 21世纪末期 | 2.76 | 2.38 | 38.57 | 27.34 | |
| 21世纪近期 | 1.20 | 1.22 | 18.89 | 9.55 | |
| SSP5-8.5 | 21世纪中期 | 2.93 | 2.78 | 41.18 | 28.60 |
| 21世纪末期 | 4.86 | 4.55 | 66.12 | 47.98 |

Fig.3 Spatial distribution of change values of TXx and TNn (Unit:℃),Su and TX90p (Unit:d) in near-term (the top),mid-term (the middle) and late-term (the bottom)of the 21st century relative to historical reference period in Fujian Province under SSP2-4.5 scenario (The dark dots passed the 0.05 significance test. the same as below )
Fig.3 Spatial distribution of change values of TXx and TNn (Unit:℃),Su and TX90p (Unit:d) in near-term (the top),mid-term (the middle) and late-term (the bottom)of the 21st century relative to historical reference period in Fujian Province under SSP2-4.5 scenario (The dark dots passed the 0.05 significance test. the same as below )

Fig.4 Spatial distribution of change values of TXx and TNn (Unit:℃),Su and TX90p (Unit:d) in near-term (the top),mid-term (the middle) and late-term (the bottom)of the 21st century relative to historical reference period in Fujian Province under SSP5-8.5 scenario
Fig.4 Spatial distribution of change values of TXx and TNn (Unit:℃),Su and TX90p (Unit:d) in near-term (the top),mid-term (the middle) and late-term (the bottom)of the 21st century relative to historical reference period in Fujian Province under SSP5-8.5 scenario

Fig.5 The change of TXx of 20-year,50-year and 100-year return periods during different period in the 21st century relative to historical reference period in Fujian Province under SSP2-4.5 (a) and SSP5-8.5 (b) scenarios
Fig.5 The change of TXx of 20-year,50-year and 100-year return periods during different period in the 21st century relative to historical reference period in Fujian Province under SSP2-4.5 (a) and SSP5-8.5 (b) scenarios

Fig.6 The return period of TXx under 20-year return period in historical reference period in different periods in the 21st century under SSP2-4.5 and SSP5-8.5 scenarios
Fig.6 The return period of TXx under 20-year return period in historical reference period in different periods in the 21st century under SSP2-4.5 and SSP5-8.5 scenarios
| [1] | IPCC. Climate Change 2013: The Physical Science Basis. Working Group I Contribution on the Fifth Assessment Report of the Intergovernmental on Climate Change[M]. Cambridge: Cambridge University Press, 2013. |
| [2] | 秦大河, THOMAS S. IPCC第五次评估报告第一工作组报告的亮点结论[J]. 气候变化研究进展, 2014, 10(1): 1-6. |
| [3] |
EASTERLING D R, EVANS J L, GROISMAN P Y, et al. Observed variability and trends in extreme climate events: a brief review[J]. Bulletin of the American Meteorological Society, 2000, 81(3): 417-425.
DOI URL |
| [4] | 蒋帅, 江志红, 李伟, 等. CMIP5模式对中国极端气温及其变化趋势的模拟评估[J]. 气候变化研究进展, 2017, 13(1): 11-24. |
| [5] | 黄安宁, 张耀存. 海温季节和年际变化对东亚区域气候变率模拟的影响[J]. 南京大学学报(自然科学版), 2004, 40(3): 319-329. |
| [6] | 任国玉, 封国林, 严中伟. 中国极端气候变化观测研究回顾与展望[J]. 气候与环境研究, 2010, 15(4): 337-353. |
| [7] | 冯晓莉, 多杰卓么, 李万志, 等. 1961—2018年青海高原极端气温指数时空变化特征[J]. 干旱气象, 2021, 39(1): 28-37. |
| [8] | 武丽梅, 陈璐, 王凯,等. 中国大陆1983—2012年年极端气温时空变化特征[J]. 干旱气象, 2016, 34(6):945-951. |
| [9] | 江晓菲, 李伟, 游庆龙. 中国未来极端气温变化的概率预估及其不确定性[J]. 气候变化研究进展, 2018, 14(3): 228-236. |
| [10] | 唐宝琪, 延军平, 曹永旺. 福建省极端温度事件对气候变暖的响应[J]. 中国农业大学学报, 2016, 21(9): 123-132. |
| [11] | 黄鹤楼, 丁烨毅, 涂小萍, 等. 城市化对宁波地区极端气温及人体舒适度的影响[J]. 干旱气象, 2020, 38(3): 396-403. |
| [12] |
CHEN H P, SUN J Q, LIN W Q, et al. Comparison of CMIP6 and CMIP5 models in simulating climate extremes[J]. Science Bulletin, 2020, 65(17): 1415-1418.
DOI URL |
| [13] |
MOSS R H, EDMONDS J A, HIBBARD K A, et al. The next generation of scenarios for climate change research and assessment[J]. Nature, 2010, 463(7282): 747-756.
DOI URL |
| [14] | 冯蜀青, 王海娥, 柳艳香, 等. 西北地区未来10 a气候变化趋势模拟预测研究[J]. 干旱气象, 2019, 37(4): 557-564. |
| [15] | 伍清. 基于CMIP5资料的西南地区2020—2050年气温多模式集合预估[J]. 干旱气象, 2018, 36(6):971-978. |
| [16] | 周天军, 邹立维, 陈晓龙. 第六次国际耦合模式比较计划(CMIP6)评述[J]. 气候变化研究进展, 2019, 15(5): 445-456. |
| [17] |
EYRING V, BONY S, MEEHL G A, et al. Overview of the Coupled Model Intercomparison Project Phase 6(CMIP6) experimental design and organization[J]. Geoscientific Model Development, 2016, 9: 1937-1958.
DOI URL |
| [18] | 周天军, 陈梓明, 邹立维, 等. 中国地球气候系统模式的发展及其模拟和预估[J]. 气象学报, 2020, 78(3): 332-350. |
| [19] | 张丽霞, 陈晓龙, 辛晓歌. CMIP6情景模式比较计划(Scenario MIP)概况与评述[J]. 气候变化研究进展, 2019, 15(5): 519-525. |
| [20] | 赵宗慈, 罗勇, 黄建斌. 从检验 CMIP5气候模式看CMIP6地球系统模式的发展[J]. 气候变化研究进展, 2018, 14(6): 643-648. |
| [21] |
XIN X G, WU T W, ZHANG J, et al. Comparison of CMIP6 and CMIP5 simulations of precipitation in China and the East Asian summer monsoon[J]. International Journal of Climatology, 2020, 40: 6423-6440.
DOI URL |
| [22] |
FU Y H, LIN Z D, WANG T. Simulated relationship between wintertime ENSO and East Asian summer rainfall: From CMIP3 to CMIP6[J]. Advances in Atmospheric Sciences, 2021, 38(2): 221-236.
DOI URL |
| [23] |
ZHU H H, JIANG Z H, LI J, et al. Does CMIP6 inspire more confidence in simulating climate extremes over China?[J]. Advances in Atmospheric Sciences, 2020, 37(10):1119-1132.
DOI URL |
| [24] |
JIANG D B, HU D, TIAN Z P, et al. Differences between CMIP6 and CMIP5 models in simulating climate over China and the East Asian monsoon[J]. Advances in Atmospheric Sciences, 2020, 37(10): 1102-1118.
DOI URL |
| [25] | 向竣文, 张利平, 邓瑶, 等. 基于CMIP6的中国主要地区极端气温/降水模拟能力评估及未来情景预估[J]. 武汉大学学报(工学版), 2021, 54(1): 46-57. |
| [26] | 陈丽娟, 王壬, 陈友飞. 1960—2014年福建省极端气候事件时空特征及变化趋势[J]. 中国水土保持科学, 2016, 14(6): 107-113. |
| [27] | 严平勇. 近40年来福建省极端气温时空变化特征[J]. 广东农业科学, 2009(8): 358-360. |
| [28] | 高晓丹, 陈彦, 李汉菁. 近58 a福州市极端气温变化趋势及重现期特征分析[J]. 农业灾害研究, 2021, 11(3): 41-42. |
| [29] | 吴佳, 高学杰. 一套格点化的中国区域日观测资料及与其他资料的对比[J]. 地球物理学报, 2013, 56(4): 1102-1111. |
| [30] |
ZHU H H, JIANG Z H, LI L. Projection of climate extremes in China, an incremental exercise from CMIP5 to CMIP6[J]. Science Bulletin, 2021, 66: 2528-2537.
DOI URL |
| [31] | HAN J, MIAO C, DUAN Q, et al. Variations in start date, end date, frequency and intensity of yearly temperature extremes across China during the period 1961-2017[J]. Environmental Research Letters, 2020, 15, 045007. |
| [32] |
MISHRA V, BHATIA U, TIWARI A D. Bias-corrected climate projections for South Asia from coupled model intercomparison project-6[J]. Scientific Data, 2020, 7(1),338.DOI: 10.1038/s41597-020-00681-1.
DOI URL |
| [33] |
JIANG D, TIAN Z, LANG X. Reliability of climate models for China through the IPCC Third to Fifth Assessment Reports[J]. International Journal of Climatology, 2016, 36(3): 1114-1133.
DOI URL |
| [34] |
ALEXANDER L V, ZHANG X, PETERSON T C, et al. Global observed changes in daily climate extremes of temperature and precipitation[J]. Journal of Geophysical Research:Atmospheres, 2006, 111, D05109. DOI: 10.1029/2015JD006290,2006.
DOI |
| [35] |
YIN H, SUN Y. Detection of anthropogenic influence on fixed threshold indices of extreme temperature[J]. Journal of Climate, 2018, 31: 6341-6352.
DOI URL |
| [36] | 童尧, 高学杰, 韩振宇, 等. 基于RegCM4的中国区域日尺度降水模拟误差订正[J]. 大气科学, 2017, 41(6): 1156-1166. |
| [37] |
TAYLOR K E. Summarizing multiple aspects of model performance in a single diagram[J]. Journal of Geophysical Research-Atmospheres, 2001, 106: 7183-7192.
DOI URL |
| [38] | 张昕怡, 方国华, 闻昕, 等. 中国格点化日降水极值统计模型及阈值的选取[J]. 气候变化研究进展, 2017, 13(4): 346-355. |
| [39] | 丁裕国, 李佳耘, 江志红, 等. 极值统计理论的进展及其在气候变化研究中的应用[J]. 气候变化研究进展, 2011, 7(4): 248-252. |
| [40] | HOSKING J R M. L-moments analysis and estimation of distributions using linear combinations of order statistics[J]. Journal of the Royal Statistical Society, 1990, 52(2): 105-122. |
| [41] | ZHOU T J, YU R C. Twentieth-century surface air temperature over China and the global simulated by coupled climate models[J]. Journal of Climate, 2006, 19(22): 5843-5858. |
| [42] | IPCC. Climate Change 2021:The Physical Science Basis.Contribution of Working Group I to the Sixth Assessment Report of the Intergovernmental Panel on Climate Change [M]. Cambridge:Cambridge University Press. In Press. |
| [43] |
SANTER B D, TAYLOR K E, GLECKLER P J, et al. Incorporating model quality information in climate change detection and attribution studies[J]. Proceedings of the National Academy of Sciences, 2009, 106(35): 14778-14783.
DOI URL |
| [44] |
KNUTTI R. The end of model democracy[J]. Climatic Change, 2010, 102(3/4): 395-404.
DOI URL |
| [1] | CAO Xiaoyun, ZHOU Bingrong, ZHOU Huakun, QIAO Bin, YAN Yuqian, ZHAO Tong, CHEN Qi, ZHAO Huifang, YU Hongyan. Research progress on the impact of climate change on vegetation ecosystem in the Tibetan Plateau [J]. Journal of Arid Meteorology, 2022, 40(6): 1068-1080. |
| [2] | FAN Jinjin, QIN Pengcheng, SHI Ruiqin, LI Mengrong, DU Liangmin. Characteristics of compound hot and drought disasters in Hubei under the background of climate change [J]. Journal of Arid Meteorology, 2022, 40(5): 780-790. |
| [3] | WU Bin, QIAN Ye, WANG Ruifang, ZHAO Xin, JIN Lei. Assessment of Largescale Environmental Factors Affecting Typhoon Intensity in Northwest Pacific Simulated by Global Climate Models [J]. Journal of Arid Meteorology, 2021, 39(3): 466-479. |
| [4] | LIU Mingyan, FANG Yihe, SUN Fenghua, ZHAO Chunyu, HOU Yiling, CUI Yan, ZHOU Xiaoyu. Contributions of Climate Changes and Human Activities to Runoff Change in the Taizihe Basin [J]. Journal of Arid Meteorology, 2021, 39(2): 244-251. |
| [5] | FENG Xiaoli, DUO Jiezhuome, LI Wanzhi, SHEN Hongyan, CHEN Jiqing. Spatiotemporal Variations of Extreme Temperature Indices over Qinghai Plateau During 1961-2018 [J]. Journal of Arid Meteorology, 2021, 39(1): 28-37. |
| [6] | ZHAO Lin, WANG Changke, AI Wanxiu. Analysis of Gender Differences in Public Perception and Adaptation to Climate Change in Northern Xinjiang [J]. Journal of Arid Meteorology, 2021, 39(1): 168-174. |
| [7] | HAO Hui, GUO Qingyuan, MA Pengcheng, WANG Lina, LIU Liwei, LIU Weiping, LI Changde. Characteristics of Extreme Low Temperature Events in Southeast of Gansu Province in Recent 50 Years and Their Circulation Background [J]. Journal of Arid Meteorology, 2020, 38(6): 900-908. |
| [8] | LIU Chuwei, LIAN Xinbo, HUANG Jianping. Research Review on the Spatio-temporal Distribution of Ozone Pollution and Its Causes in China [J]. Journal of Arid Meteorology, 2020, 38(03): 355-361. |
| [9] | SUN Yinchuan1,2, WANG Suyan1,2, LI Hao3, ZHENG Guangfen2, WANG Fan2, GUAN Jingde1. Effect Analysis of Climate Change on Summer Tourism Climate Comfortableness in Liupan Mountain Areas of Ningxia [J]. Journal of Arid Meteorology, 2018, 36(6): 1035-. |
| [10] | ZHANG Feimin, WANG Chenghai, XIE Guohui, KONG Weizheng. Projection of Global Wind and Solar Energy over Land Under Different Climate Change Scenarios During 2020-2030 [J]. Journal of Arid Meteorology, 2018, 36(5): 725-732. |
| [11] | DILINUER Tuoliewubieke, LI Dongliang. Characteristics of the Dry/Wet Climate Change in Central Asia in Recent 115 Years [J]. Journal of Arid Meteorology, 2018, 36(2): 185-195. |
| [12] | TENG Shuichang, ZHANG Min, TENG Jie, QIAO Qin. Climatic Change Characteristics in Wushaoling Region of Gansu Province During 1951-2016 [J]. Journal of Arid Meteorology, 2018, 36(1): 75-81. |
| [13] | LI Yanli, LI Yonghua, CHEN Xinjun, YANG Wenbin. Variation Characteristics of Runoff into Danghe Reservoir and Its Response to Climate Change [J]. Journal of Arid Meteorology, 2017, 35(6): 984-990. |
| [14] | . Quantitative Analysis of Climate Factors Influencing on Potential Evapotranspiration Changes over Haihe River Basin [J]. Journal of Arid Meteorology, 2017, 35(3): 367-. |
| [15] | ZHOU Bingrong1,2, ZHU Shengcui3, LI Hongmei4. Temporal and Spatial Characteristics of Vegetation Net Primary Productivity and Its Responses to Climate Change in Three-river Headwaters Region [J]. Journal of Arid Meteorology, 2016, 34(6): 958-965. |
| Viewed | ||||||
|
Full text |
|
|||||
|
Abstract |
|
|||||