干旱气象 ›› 2022, Vol. 40 ›› Issue (6): 1014-1023.DOI: 10.11755/j.issn.1006-7639(2022)-06-1014
台风“摩羯”路径转折预报和诊断分析
于慧珍1,2( ), 马艳1,2(), 韩旭卿3, 时晓曚1,2
- 1.山东省青岛市气象局,山东 青岛 266003
2.山东省气象防灾减灾重点实验室,山东 济南 250031
3.国家气象中心,北京 100081
-
收稿日期:2022-02-13修回日期:2022-09-08出版日期:2022-12-31发布日期:2023-01-10 -
通讯作者:马艳 -
作者简介:于慧珍(1988—),女,工程师,主要从事天气预报和灾害性天气研究. E-mail: yuhuizhen1990@163.com。 -
基金资助:青岛市气象局重点项目(2021qdqxz01);山东省自然科学基金项目(ZR2019PD002);青岛市气象局项目(2019qdqxhz01)
Forecast and diagnosis analysis of the turning of Typhoon Yagi track
YU Huizhen1,2(), MA Yan1,2(), HAN Xuqing3, SHI Xiaomeng1,2
- 1. Qingdao Meteorological Bureau of Shandong Province, Qingdao 266003, Shandong, China
2. Key Laboratory for Meteorological Disaster Prevention and Mitigation of Shandong Province, Jinan 250031, China
3. National Meteorological Center, Beijing 100081, China
-
Received:2022-02-13Revised:2022-09-08Online:2022-12-31Published:2023-01-10 -
Contact:MA Yan
摘要:
台风“摩羯”在2018年8月14日凌晨从安徽北部转向进入山东,业务预报模式对路径转折的预报存在较大偏差。本文利用欧洲中期天气预报中心(European Centre for Medium-Range Weather Forecasts,ECMWF)集合预报和ECMWF第五代大气再分析资料ERA5对“摩羯”路径转折进行预报和诊断分析。结果表明:台风路径转折受到大尺度引导气流和台风本身结构共同影响。ECMWF的大部分集合成员没有预报出台风路径转折,主要是因为预报的西太平洋副热带高压(简称“西太副高”)位置比实况偏西。在模式前期预报中,西太副高偏西的特征比台风实际转折时间早30 h,在业务预报中可以通过西太副高位置的订正对台风路径进行向东订正。在台风路径转折前,整层大气高能区和200 hPa辐散大值区分布与转折趋势一致,对台风路径转折预报具有指示意义。台风路径转折发生在整层大气高能区中心轴线和300 hPa强增温中心轴线方向变化约18 h后。轴线方向的变化对转折时间预报具有指示意义。尺度分析结果显示,上述物理量的风暴尺度分量对台风路径转折具有指示意义。
中图分类号:
引用本文
于慧珍, 马艳, 韩旭卿, 时晓曚. 台风“摩羯”路径转折预报和诊断分析[J]. 干旱气象, 2022, 40(6): 1014-1023.
YU Huizhen, MA Yan, HAN Xuqing, SHI Xiaomeng. Forecast and diagnosis analysis of the turning of Typhoon Yagi track[J]. Journal of Arid Meteorology, 2022, 40(6): 1014-1023.
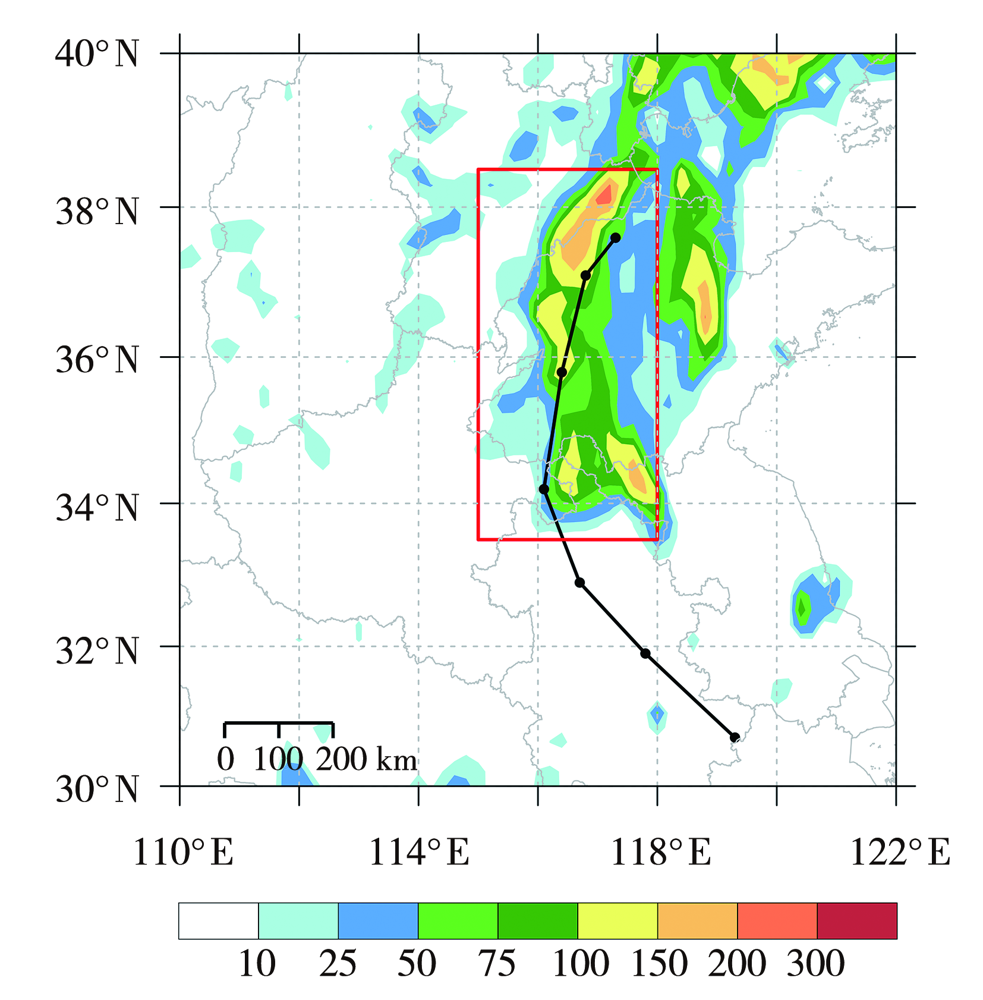
图1 2018年8月13日08:00至14日20:00逐6 h台风路径(黑色点线)及8月13日20:00至14日20:00 24 h累计降水量(彩色填色区,单位:mm) (红色方框为敏感性分析中计算平均海平面气压和10 m风速的区域。下同)
Fig.1 The typhoon track at 6 h interval (black dots and line) from 08:00 BST 13 to 20:00 BST 14 and 24 h accumulated precipitation (color shaded areas, Unit: mm) from 20:00 BST 13 to 20:00 BST 14 August 2018 (The red box shows the area where the average sea level pressure and 10 m wind speed are calculated in the sensitivity analysis. the same as below)
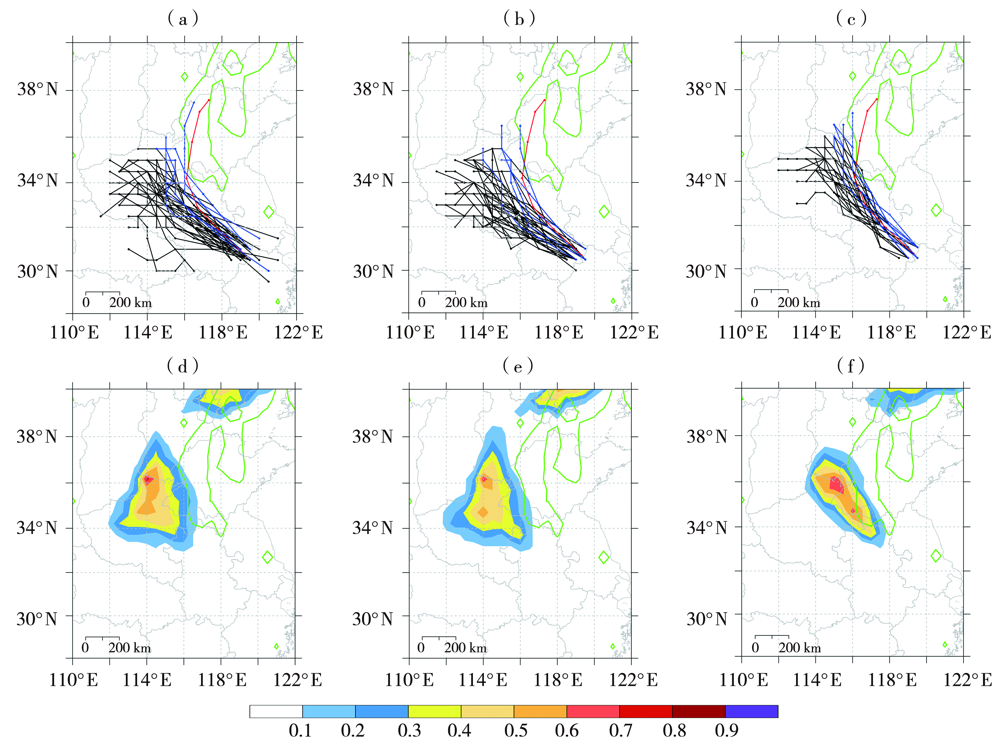
图2 2018年8月13日08:00至14日20:00逐6 h台风路径观测结果(红色点线)及ECMWF集合预报结果(黑色点线为非转折路径,蓝色点线为转折路径)(a、b、c),8月13日20:00至14日20:00 24 h累计降水量大于50 mm的ECMWF集合预报概率(彩色填色区)(d、e、f) (a、d)12日08:00起报,(b、e)12日20:00起报,(c、f)13日08:00起报(绿色等值线表示实况24 h累积降水量等于50 mm)
Fig.2 The observation result (red dots and line) and ECMWF ensemble forecast result (black dots and lines are the non-steering track, and the blue dots and lines are the turn track) of typhoon tracks at 6 h interval from 08:00 BST 13 to 20:00 BST 14 August 2018(a, b, c) and ECMWF ensemble forecast probability (color shaded areas) of the 24 h accumulated precipitation larger than 50 mm (d, e, f) from 20:00 BST 13 to 20:00 BST 14 August 2018(a, d) forecasted initiated from 08:00 BST 12, (b, e) forecasted initiated from 20:00 BST 12,(c, f) forecasted initiated from 08:00 BST 13 (The green contour denotes the observed 24 h accumulated precipitation equal to 50 mm)
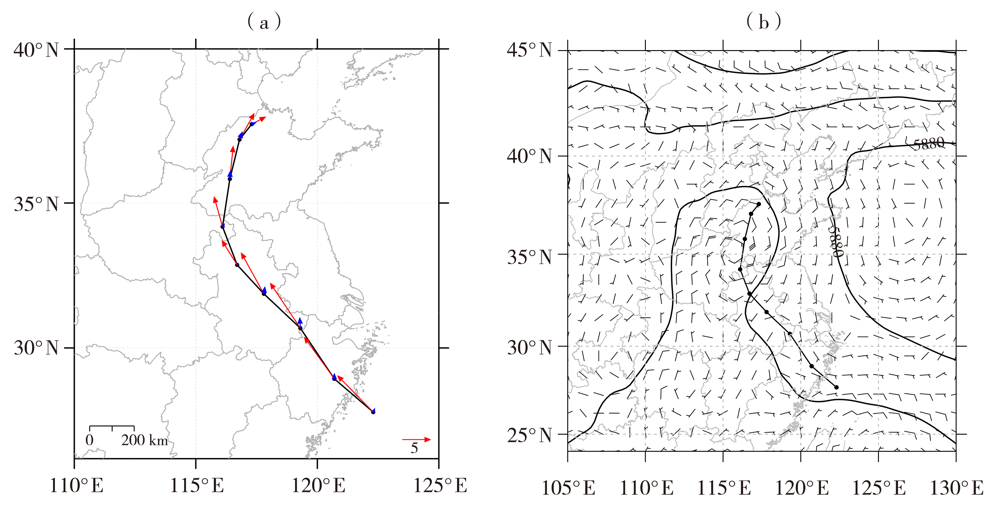
图3 2018年8月12日20:00至14日20:00逐6 h引导气流的大尺度分量(红色箭头,单位:m·s-1)、风暴尺度分量(蓝色箭头,单位:m·s-1)(a),8月14日02:00 850~300 hPa平均大尺度环流(风矢量,单位:m·s-1)、500 hPa位势高度场(黑色等值线,单位:gpm)(b) (黑色点线为2018年8月12日20:00至14日20:00逐6 h台风路径。下同)
Fig.3 The large scale component (red arrows, Unit: m·s-1) and storm scale component (blue arrows, Unit: m·s-1) of the steering flow at 6 h interval from 20:00 BST 12 to 20:00 BST 14 August 2018 (a), the mean large scale flow during 850-300 hPa (wind vectors, Unit: m·s-1) and geopotential height field at 500 hPa (black contours, Unit: gpm) at 02:00 BST 14 August 2018 (b) (The black dots and line denotes typhoon track at 6 h interval from 20:00 BST 12 to 20:00 BST 14 August 2018. the same as below)
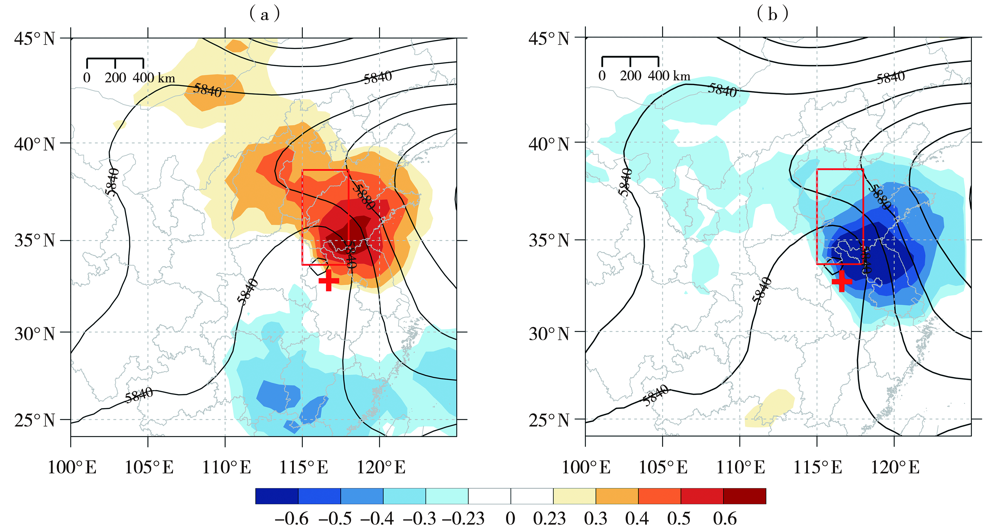
图4 2018年8月12日08:00起报的13日20:00 500 hPa位势高度场的集合平均(黑色等值线,单位:gpm)(a,b)及其分别与相同时刻起报的24 h区域平均的海平面气压(a)、10 m风速(b)的线性相关系数(彩色填色区) (红色十字为13日20:00观测的台风位置)
Fig.4 The ensemble mean of geopotential height at 500 hPa at 20: 00 BST 13 forecasted initiated from 08: 00 BST 12 August 2018 (black contours, Unit: gpm) (a, b) and correlation coefficient (color shaded areas) between it and the 24 h area-averaged sea level pressure (a), wind speed at 10 m (b) forecasted at same initiated time (The red cross denotes the observed typhoon location at 20:00 BST 13 August 2018)
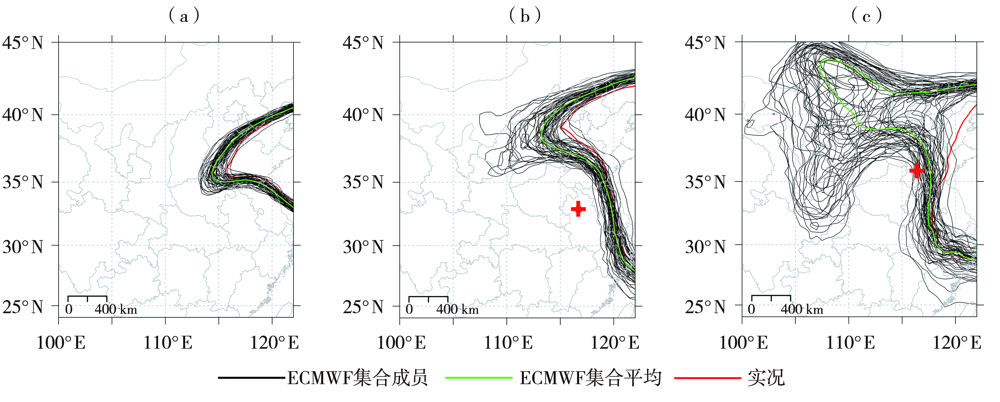
图5 2018年8月12日08:00起报的12日20:00(a),13日20:00(b)和14日08:00(c)5860 gpm位势高度的集合预报结果(黑色等值线为各成员预报结果,绿色等值线为集合平均)及实况(红色等值线) (红色十字代表相应时刻台风的实况位置)
Fig.5 The ECMWF ensemble forecast result (the black isolines for each member forecast result, green isoline for ensemble mean) of geopotential height of 5860 gpm at 20:00 BST 12 (a), 20:00 BST 13 (b) and 08:00 BST 14 (c) forecasted initiated from 08: 00 BST 12 August 2018 and observation (red isoline) (The red cross denotes the observed typhoon location at the corresponding time)

图6 2018年8月13日02:00(a、b、c)和13日08:00(d、e、f)925~200 hPa平均假相当位温θse(a、d)及其大尺度(b、e)和风暴尺度(c、f)分量(单位:K) (绿色线、灰色线分别代表假相当位温高能区中心轴线方向及分布趋势,绿色十字代表相应时刻台风位置)
Fig.6 The mean θse during 925-200 hPa (a, d) and its large scale (b, e) and storm scale (c, f) components at 02:00 BST 13 (a, b, c) and 08:00 BST 13 (d, e, f) August 2018 (Unit: K) (The green line and grey line represent the central axis direction and distribution trend of high energy region of θse respectively, the green cross denotes the typhoon location at the corresponding time)
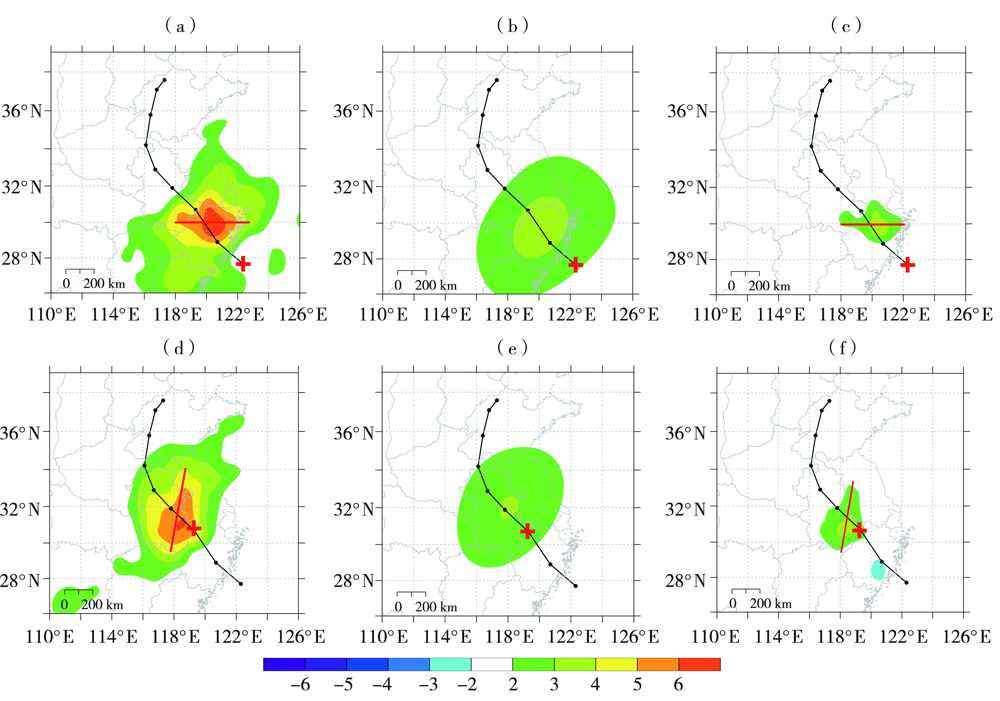
图7 2018年8月12日20:00(a、b、c)和13日08:00(d、e、f)300 hPa 24 h变温场(a、d)及其大尺度(b、e)和风暴尺度(c、f)分量(单位:K) (红色线代表强增温中心轴线方向,红色十字代表相应时刻的台风位置)
Fig.7 The 24 h temperature variation at 300 hPa (a, d) and its large scale (b, e) and storm scale (c, f) components at 20:00 BST 12 (a, b, c) and 08:00 BST 13 (d, e, f) August 2018 (Unit: K) (The red line denotes the axis direction of strong warming center and the red cross denotes the typhoon location at the corresponding time)

图8 2018年8月13日08:00 200 hPa散度场(a)及其大尺度(b)和风暴尺度(c)分量(单位:10-5 s-1) (灰色线代表散度大值区的分布趋势,红色十字代表13日08:00台风位置)
Fig.8 The divergence field at 200 hPa (a) and its large scale (b) and storm scale (c) components at 08:00 BST 13 August 2018 (Unit: 10-5 s-1) (The grey curve denotes the distribution trend of large value area of divergence, the red cross denotes the typhoon location at 08:00 BST 13)
| [1] | CANGIALOSI J P, FRANKLIN J L. 2010 National Hurricane Center forecast verification report[R/OL]. (2011-05-05) [2022-12-05]. https://www.nhc.noaa.gov/verification/pdfs/Verification_2010.pdf. |
| [2] | 端义宏, 陈联寿, 梁建茵, 等. 台风登陆前后异常变化的研究[J]. 气象学报, 2014, 72(5):969-986. |
| [3] | 王茂书, 肖递祥, 袁亮, 等. 两种不同路径台风对四川东北部持续性暴雨影响对比分析[J]. 沙漠与绿洲气象, 2020, 14(6):29-38. |
| [4] | 任丽, 赵玲, 韩冰, 等. 台风狮子山与中纬度系统相互作用所致暴雨成因分析[J]. 沙漠与绿洲气象, 2019, 13(1):44-51. |
| [5] | 余锦华, 唐家翔, 戴雨菡, 等. 我国台风路径业务预报误差及成因分析[J]. 气象, 2012, 38(6):695-700. |
| [6] |
QIAN C H, ZHANG F Q, GREEN B W, et al. Probabilistic evaluation of the dynamics and prediction of supertyphoon Megi (2010)[J]. Weather and Forecasting, 2013, 28(6):1562-1577.
DOI URL |
| [7] | 倪钟萍, 吴立广, 张玲. 2005—2010年台风突变路径的预报误差及其环流背景[J]. 气象, 2013, 39(6):719-727. |
| [8] | 许映龙, 张玲, 高拴柱. 我国台风预报业务的现状及思考[J]. 气象, 2010, 36(7):43-49. |
| [9] | 吕心艳, 许映龙, 董林, 等. 2018年西北太平洋台风活动特征和预报难点分析[J]. 气象, 2021, 47(3):359-372. |
| [10] | 梁军, 冯呈呈, 张胜军, 等. 台风“温比亚” (1818)影响辽东半岛的预报分析[J]. 干旱气象, 2020, 38(2):280-289. |
| [11] |
段晶晶, 钱燕珍, 郭建民. “莫兰蒂”外螺旋雨带在浙江局地发展引发大暴雨成因分析[J]. 干旱气象, 2019, 37(1):57-66.
DOI |
| [12] |
王文波, 王旭, 杨明, 等. 台风“达维”移动路径成因分析[J]. 干旱气象, 2014, 32(1):75-80.
DOI |
| [13] | 陈丽英, 赵蕾, 李春銮, 等. 台风“麦莎”移动路径及其内部热力结构的诊断分析[J]. 气象研究与应用, 2011, 32(3):8-11. |
| [14] | 陈联寿, 徐祥德, 解以扬, 等. 台风异常运动及其外区热力不稳定非对称结构的影响效应[J]. 大气科学, 1997, 21(1):83-90. |
| [15] | 王新伟, 罗哲贤, 马革兰, 等. 热带气旋Meranti(2010)异常路径的成因分析[J]. 大气科学学报, 2015, 38(1):37-45. |
| [16] | 袁俊鹏, 江静. 西北太平洋热带气旋路径及其与海温的关系[J]. 热带气象学报, 2009, 25(增刊): 69-78. |
| [17] |
WU L G, NI Z P, DUAN J J, et al. Sudden tropical cyclone track changes over the Western North Pacific: a composite study[J]. Monthly Weather Review, 2013, 141(8):2597-2610.
DOI URL |
| [18] | 赖巧珍, 吴立广, SHIE Chung-lin. 0908号台风“莫拉克”登陆过程中海表温度变化特点及其对“莫拉克”的影响[J]. 热带气象学报, 2013, 29(2): 221-234. |
| [19] | 郭旭, 麻素红, 吴俞, 等. 基于TIGGE资料的台风“鲇鱼”路径北翘成因分析[J]. 热带气象学报, 2014, 30(1): 55-63. |
| [20] |
XU X, PENG S, YANG X, et al. Does warmer China land attract more super typhoons?[J]. Scientific Reports, 2013,3,1522. DOI: 10.1038/srep01522.
DOI |
| [21] |
YUN K S, CHAN J, HA K J. Effects of SST magnitude and gradient on typhoon tracks around East Asia: a case study for Typhoon Maemi (2003)[J]. Atmospheric Research, 2012, 109/110(7):36-51.
DOI URL |
| [22] | 高留喜, 杨晓霞, 刘畅, 等. 台风“摩羯”(1814)的路径特点与预报分析[J]. 海洋气象学报, 2019, 39(4):108-115. |
| [23] | 朱义青, 王庆华. 台风“摩羯”螺旋雨带中衍生龙卷的非超级单体特征[J]. 干旱气象, 2020, 38(2):263-270. |
| [24] |
YING M, ZHANG W, YU H, et al. An overview of the China Meteorological Administration tropical cyclone database[J]. Journal of the Atmospheric and Oceanic Technology, 2014, 31(2):287-301.
DOI URL |
| [25] |
BOUGEAULT P, TOTH Z, BISHOP C, et al. The THORPEX interactive grand global ensemble[J]. Bulletin of the American Meteorological Society, 2010, 91:1059-1072.
DOI URL |
| [26] |
YU H Z, MENG Z Y. Key synoptic-scale features influencing the high-impact heavy rainfall in Beijing, China, on 21 July 2012[J]. Tellus A: Dynamic Meteorology and Oceanography, 2016, 68, 31045.DOI: 10.3402/tellusa.v68.31045.
DOI |
| [27] | FISHER R A. Statistical methods for research workers[M]. Edinburgh, UK: Oliver and Boyd, 1925: 378. |
| [28] | 王斌, ELSBERRY R L, 王玉清, 等. 热带气旋运动的动力学研究进展[J]. 大气科学, 1998, 22(4):535-547. |
| [29] |
FANG J, ZHANG F Q. Initial development and genesis of hurricane Dolly (2008)[J]. Journal of the Atmospheric Sciences, 2010, 67:655-672.
DOI URL |
| [30] |
CHEN X M, WANG Y Q, ZHAO K, et al. A numerical study on rapid intensification of Typhoon Vicente (2012) in the South China Sea. Part I: verification of simulation, storm-scale evolution, and environmental contribution[J]. Monthly Weather Review, 2017, 145(3):877-898.
DOI URL |
| [31] | 袁梅, 平凡, 李国平. 台风“梅花”路径转折期间的结构特征分析与模拟[J]. 大气科学, 2018, 42(5):1000-1012. |
| [32] | 张行才, 王建新. 环境温度场的异常变化与台风的趋暖运动[J]. 海洋预报, 2007, 24(4):13-19. |
| [33] | 杨诚, 于文革. 一种北上台风路径预报方法[J]. 气象, 2006, 32(8):88-91. |
| [34] | 于海侠. 高层强增温与热带气旋路径及其强度变化关系[D]. 金华: 浙江师范大学, 2010. |
| [35] | 朴贤雄, 杨平章. 转向台风路径的预报与分析[J]. 气象科学, 1993, 13(2):131-136. |
| [1] | 郝立生, 马宁, 何丽烨. 2022年长江中下游夏季异常干旱高温事件之环流异常特征[J]. 干旱气象, 2022, 40(5): 721-732. |
| [2] | 冯瑶, 阿依先木·尼牙孜, 热依拉·玉努斯. 新疆哈密“7·31”极端大暴雨过程成因分析[J]. 干旱气象, 2021, 39(3): 426-435. |
| [3] | 郑铮, 潘灵杰, 钱燕珍, 赵昶昱, 黄旋旋, 肖王星. 台风“利奇马”造成浙江沿海极端强降水的演变特征[J]. 干旱气象, 2021, 39(2): 269-278. |
| [4] | 努尔比亚·吐尼牙孜, 张超, 李泽巍, 孙成云, 黄艳. 南疆西部2016年8月4次暴雨过程特征分析[J]. 干旱气象, 2019, 37(2): 301-311. |
| [5] | 赵瑜,赵桂香,王思慜,申李文 . “7.28”山西中部强对流天气的中尺度分析[J]. 干旱气象, 2017, 35(5): 874-885. |
| [6] | 徐红,程攀,王瑞丽. 台风“海燕”过境海南岛数值模拟及暴雨成因诊断[J]. 干旱气象, 2016, 34(3): 503-510. |
| [7] | 张晓露1,李照荣2,周筠珺1,3,褚晓菊4. 西北地区东部夏季一次典型暴雨的分析和数值模拟[J]. 干旱气象, 2015, 33(4): 616-625. |
| [8] | 赵东旭,杨晓玲,周 华,刘 蓉. 甘肃武威市一次局地大到暴雨天气成因分析[J]. 干旱气象, 2015, 33(1): 149-155. |
| [9] | 张 南,张迎新,申莉莉. 冀中南一次春季雨雪过程诊断与预报技术分析[J]. 干旱气象, 2014, 32(4): 622-628. |
| [10] | 薄燕青,闵锦忠,赵桂香. 黄河中下游地区一次暴雨过程的数值模拟和诊断[J]. 干旱气象, 2014, 32(1): 60-69. |
| [11] | 狄潇泓,张新荣,刘新伟,沙宏娥. 甘肃省两次强沙尘暴天气对比分析[J]. 干旱气象, 2014, 32(1): 81-86. |
| [12] | 景怀玺,吉慧敏 ,王雅茹,石光普 ,李晓霞 ,徐科展. 甘肃白银市一次局地暴雨天气过程分析[J]. J4, 2012, 30(3): 443-450. |
| [13] | 张文军, 李建. 对甘肃酒泉一次暴雨的数值模拟和诊断分析[J]. 干旱气象, 2012, 30(1): 100-106. |
| [14] | 李安泰, 何宏让 , 阳向荣. 甘肃东南部一次暴雨天气的数值模拟和螺旋度分析[J]. J4, 2010, 28(3): 309-314. |
| [15] | 刘耀文 , 张红英 , 史云飞 , 尹振保 , 马子平. 山西省秋季罕见大暴雪天气过程诊断[J]. J4, 2010, 28(3): 332-337. |
| 阅读次数 | ||||||
|
全文 |
|
|||||
|
摘要 |
|
|||||
