

0 引言
极端气温是影响植被GPP的重要气候因子,其作用机制与影响特征具有明显差异性:高温胁迫下,植被光合作用减弱、呼吸作用增强,直接导致植被生产力下降(朴世龙等,2019),且其影响程度不仅取决于热浪强度,还与发生时间密切相关,如春季高温可能通过提前植被物候促进生态系统碳净吸收(De Boeck et al.,2011);极端低温影响植被的生理功能和发育过程,其中霜冻影响最显著(Niu et al.,2014),如2010年美国东北部春寒导致该地区高海拔森林GPP下降7%~14%(Hufkens et al.,2012)。极端降水对碳循环的影响存在明显的区域差异,能够促进干旱地区生态系统碳积累,却不利于湿润地区固碳(Zeppel et al.,2014),尤其在长时间水淹状态下,植被根系会严重缺氧、呼吸减少,引起植被死亡(Bailey-Serres and Voesenek,2008)。极端干旱通过水力失效与碳饥饿加剧植物死亡风险,对植被GPP具有显著抑制效应,且随着干旱等级升高,GPP下降速率逐步增大(曹玉娟,2023);但在干旱频发且强度较高的条件下,植被则会通过调节自身生理过程,实现水分的优化利用(Tello-García et al.,2020)。
陕西省南北纵跨陕北高原、关中平原和秦巴山区,横贯3个气候带,地形地貌多样,气候条件复杂,植被地带性差异显著。近几十年来,全省极端气候事件频发,极端高温和干旱事件明显增加,尤其陕北地区重旱和特旱程度加重,区域降水呈现极端化态势,但目前针对极端气候事件对植被GPP的影响机制研究还非常匮乏。本文基于植被GPP数据与同期极端气候指数,使用二维Copula联合分析、一元线性回归法和Pearson相关系数法等,分析极端气候对陕西不同区域、不同植被类型GPP的影响差异,精确评估区域植被GPP对极端气候事件的响应特征,以期为区域适应和减缓气候变化的影响、提高气候变化风险评估水平提供科学依据。
1 资料及方法
1.1 资料
所用资料主要包括1981—2018年GLASS(Global Land Surface Satellites)植被GPP数据集、极端气候指数和土地覆盖类型数据等。
1.1.1 GLASS GPP数据集
GLASS GPP产品采用改进的光能利用率模型,整合了大气CO₂浓度、辐射组分、水汽压亏缺等关键变量,是全球少数长时间序列GPP产品之一。相关精度验证结果显示,GLASS GPP在全球85个通量站点评估中,决定系数(R2)达0.72~0.85,均方根误差显著低于MODIS(Moderate Resolution Imaging Spectroradiometer)GPP与FLUXCOM(Flux Combinations)GPP产品(Jia et al.,2018),同时该产品针对中国复杂地形和生态系统进行本地化参数调整,精度优于国际同类产品(Yuan et al.,2010)。该数据集获取自国家地球系统科学数据中心,空间分辨率为0.05°,时间分辨率为8 d。
1.1.2 极端气候指数
气候变化监测与指数专家组(Expert Team on Climate Change Detection and Indices,ETCCDI)开发的27种核心气候指数是全球极端气候研究的标准化工具,分16个温度指数和11个降水指数,覆盖极端事件的频率、强度和持续时间(Alexander et al.,2006)。本文重点考虑高温、低温、降水和干旱指数中能够显著反映极端事件频率和强度的指数,包括极端高温指数、极端低温指数、极端降水指数、极端干旱指数(表1)。这4个指数是表征区域极端气候特征的关键指标,其对植被生产力的影响具有直接性和主导性,相关研究已证实它们是驱动植被GPP变化的核心驱动因子(朴世龙等,2019;杜文丽等,2020)。该指数基于陕西省气象观测站数据计算得到。
表1 4个极端气候指数定义
Tab.1
| 指数名称 | 类别 | 定义 |
|---|---|---|
| 极端高温指数 | 最高高温 | 日最高气温的年(月)最大值 |
| 极端低温指数 | 最低低温 | 日最低气温的年(月)最小值 |
| 极端降水指数 | 年(月)降水总量 | 年(月)全部日降水量的总和 |
| 极端干旱指数 | 最大干旱持续时长 | 日降水量<1 mm的最大连续天数 |
1.1.3 土地覆盖类型数据
土地覆盖类型数据(MODIS MCD12C1)是基于国际地圈-生物圈计划(International Geosphere-Biosphere Programme,IGBP)所定义的DIScover数据集(Friedl and Sulla-Menashe,2022)。为探究植被生长对极端气候的响应特征,结合陕西省地表覆盖现状,选取森林、农田、草地3类优势植被类型开展对比分析。第三次国土调查数据表明,这3类植被占陕西省总土地面积的85.69%,能够代表区域主要植被生态系统。
1.2 方法
1.2.1 相关分析
采用一元线性回归法和Pearson相关系数法,其中一元线性回归法是将研究时段内逐像元的年均GPP与时间进行线性回归分析,利用最小二乘法估计的拟合系数作为GPP随时间的变化速率(何晓群和刘文卿,2011),线性回归系数的显著性检验采用t检验。
Pearson相关系数法是分别逐像元计算GPP与4个极端气候指数的相关性,计算公式(黄嘉佑和李庆祥,2015)如下:
式中:r为相关系数,n为年份数,i是年序号;xi为某像元第i年的GPP,
1.2.2 二维Copula联合分析模型
构建单个气象指数(X)与植被总初级生产力GPP(Y)的二维Copula联合累积分布模型,Copula函数C(u,v)满足:
式中:x、y分别为X、Y的某一具体取值;FX(x)、FY(y)分别为X和Y的边缘累积分布函数,表示X、Y取值小于或等于x、y的概率,即FX(x)=P(X≤x)、FY(y)=P(Y≤y);P(X≤x,Y≤y)为联合概率,表示X≤x且Y≤y同时发生的概率;C(u,v)是二维Copula函数,用于描述X和Y之间的相依结构,是连接两个边缘分布的核心函数,其中u为气象要素X经边缘分布转换后的概率值,即u=FX(x),取值范围为[0,1];v是Y经边缘分布转换后的概率值,v=FY(y),取值范围为[0,1]。
分别对X∈{极端高温指数,极端低温指数,极端降水指数,极端干旱指数}与Y∈{年GPP,生长季GPP,月GPP}进行两两耦合分析。模型输出以下核心指标用来量化极端气候对GPP的影响:
1)条件概率。极端气候条件下GPP低于阈值的概率,计算公式为
式中:y0为GPP的对应阈值;P表示在该极端气候下GPP低于阈值的条件概率,P值越大表示出现低GPP的风险越高,P值越小表示风险越低。
2)影响强度。极端气候下GPP的条件期望与正常气候下GPP期望的差值,公式为
式中:E(*|*)表示条件期望;Δμ表示在该极端气候下GPP均值与正常气候下GPP均值之差,Δμ>0代表极端气候促进GPP,Δμ<0代表极端气候抑制GPP,Δμ绝对值越大,影响效应越强。需要注意的是,P和Δμ不表示相关性强弱或统计显著性,而是分别反映风险大小和均值效应程度。
2 结果分析
2.1 植被GPP时空变化
基于GLASS GPP数据集,图1给出1981—2018年陕西全省及陕北、关中、陕南3个区域的平均植被GPP逐年变化。可以看出,陕西省植被GPP在研究时段内波动增加,平均增长率达6.59 gC·m-2·a-1(R2=0.76,p<0.01),植被固碳能力稳步提升。其中,陕北地区平均GPP整体处于较低水平(340~740 gC·m-2·a-1),但上升态势突出,增长率达8.25 gC·m-2·a-1(R2=0.81,p<0.01);关中地区平均GPP为730~1 180 gC·m-2·a-1,处于中等水平,增长率为7.05 gC·m-2·a-1(R2=0.62,p<0.01),植被生产力保持稳定增长;陕南地区依托秦巴山区良好的水热条件,植被基础优越,平均GPP高达1 100~1 600 gC·m-2·a-1,但增长率相对最低(4.15 gC·m-2·a-1,R2=0.35),由于该区域植被已接近生态承载力上限,增长空间有限。
图1
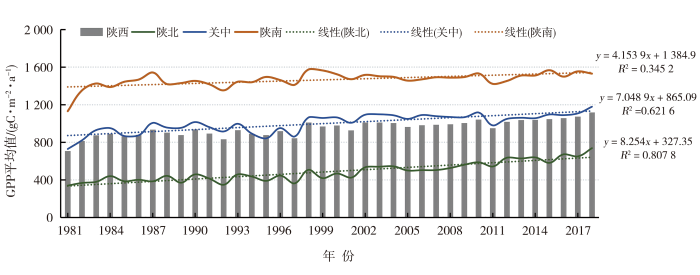
图1
1981—2018年陕西省、陕北、关中和陕南区域平均GPP逐年变化
Fig.1
Yearly variation of regional average GPP in Shaaxi Province, Northern Shaanxi, Guanzhong, and Southern Shaanxi from 1981 to 2018
表2 1981—2018年陕西省GPP变化趋势统计
Tab.2
| 变化趋势区间/(gC·m-2·a-1) | 变化等级 | 面积占比/% |
|---|---|---|
| [-0.5,0] | 略有变差 | 2.1 |
| (0,0.1] | 轻微好转 | 30.4 |
| (0.1,0.6] | 明显好转 | 67.5 |
图2
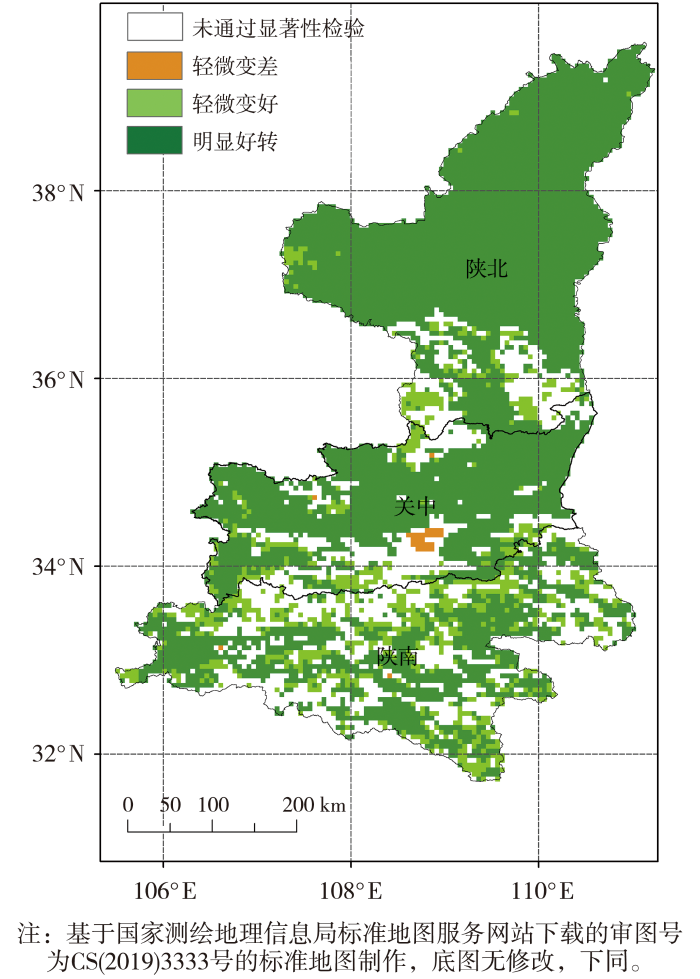
图2
1981—2018年陕西省GPP变化趋势空间分布
Fig.2
Spatial distribution of change trend of GPP in Shaaxi Province from 1981 to 2018
2.2 极端气候对不同区域GPP的影响
从极端气候指数与陕西省不同区域多年平均GPP的相关性分布(表3、图3)来看,陕北地区71.4%的区域GPP与极端高温指数呈正相关,主要分布在陕北北部毛乌素沙漠一带,热量条件改善有利于GPP提升;68.3%的区域GPP与极端低温指数呈负相关,主要分布在陕北东部和南部,极端低温抑制了GPP增长;88.6%的区域GPP与极端干旱指数呈负相关,该地区常年降水较少,极端干旱成为限制植物生长的主要因素。总体来看,极端高温和极端降水对陕北北部和西部大部分地区GPP有一定促进作用,极端低温和干旱对全区大部GPP呈抑制作用。关中地区73.5%的区域GPP与极端低温指数呈负相关,主要分布在关中东部和南部;78.5%的区域GPP与极端降水指数呈正相关,降水有利于关中地区植被GPP提升;73.1%的区域GPP与极端干旱指数呈负相关。说明关中多数区域的GPP因极端低温和干旱而受抑,但能借助极端降水实现增长,体现出水分条件对当地植被生长的关键影响。陕南75.6%的区域GPP与极端高温指数呈正相关,主要分布于商洛市大部、安康及汉中的中南部地区;商洛市中西部、安康市东部及汉中大部区域与极端降水指数呈显著正相关,正相关区域覆盖面积达87.3%,说明极端降水对陕南多数区域植被生长起到促进作用。从全省来看,极端高温和极端降水对GPP的影响多为促进效应,而极端低温和极端干旱对GPP的影响多为抑制作用。
表3 陕西省不同区域平均GPP与极端气候指数正负相关性面积占比统计
Tab.3
| 极端气候指数 | 陕北 | 关中 | 陕南 | 全省 | ||||||||
|---|---|---|---|---|---|---|---|---|---|---|---|---|
| 正相关 | 负相关 | p<0.05 | 正相关 | 负相关 | p<0.05 | 正相关 | 负相关 | p<0.05 | 正相关 | 负相关 | p<0.05 | |
| 极端高温指数 | 71.4 | 28.6 | 27.8 | 51.5 | 48.5 | 36.2 | 75.6 | 24.4 | 33.5 | 63.9 | 37.1 | 38.7 |
| 极端低温指数 | 31.7 | 68.3 | 49.9 | 26.5 | 73.5 | 52.3 | 51.3 | 49.7 | 56.7 | 35.5 | 64.5 | 62.3 |
| 极端降水指数 | 42.7 | 57.3 | 54.7 | 78.5 | 21.5 | 59.5 | 87.3 | 12.7 | 52.4 | 76.9 | 33.1 | 58.6 |
| 极端干旱指数 | 11.4 | 88.6 | 63.2 | 26.9 | 73.1 | 68.2 | 43.9 | 56.1 | 65.3 | 33.9 | 67.1 | 61.2 |
图3
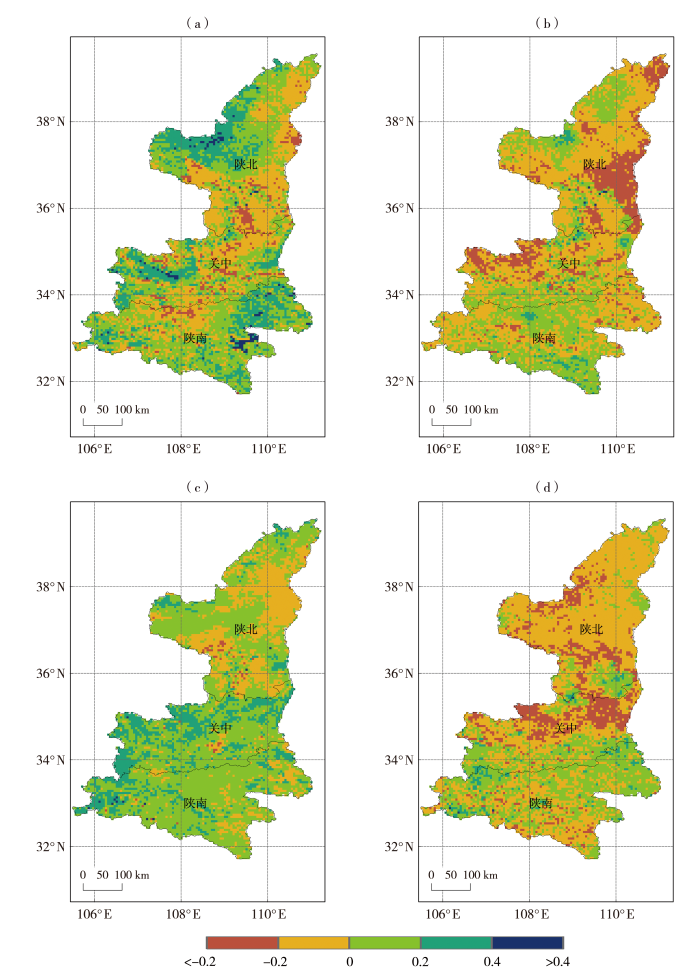
图3
1981—2018年陕西省平均GPP与极端高温指数(a)、极端低温指数(b)、极端降水指数(c)、极端干旱指数(d)相关系数的空间分布
Fig. 3
Spatial distribution of correlation coefficients between average GPP in Shaaxi Province and the extremely high temperature index (a), extremely low temperature index (b), extreme precipitation index (c), and extreme drought index (d) from 1981 to 2018
2.3 极端气候对不同植被类型GPP的定量影响评估
基于陕西省4个极端气候指数和GPP数据,使用Copula方法分别构建各指数与GPP的二维联合分布函数,比较不同时间尺度3种植被类型GPP对极端气候条件的响应特征。表4为年、生长季和月尺度4个极端气候指数对植被GPP的影响风险系数。可以看出:年与生长季尺度下,极端气候指数对GPP的影响远弱于月尺度,均处于低风险、弱效应区间,表现出微弱的促进或抑制作用。相比之下,月尺度极端气候对GPP的影响更强,表明短期极端气候事件对GPP的影响更为直接。
表4 1981—2018年陕西省年、生长季和月尺度4个极端气候指数对GPP的影响风险系数
Tab.4
| 极端高温指数 | 极端低温指数 | 极端降水指数 | 极端干旱指数 | |||||||||
|---|---|---|---|---|---|---|---|---|---|---|---|---|
| 年度 | 生长季 | 月度 | 年度 | 生长季 | 月度 | 年度 | 生长季 | 月度 | 年度 | 生长季 | 月度 | |
| P | 0.150 | 0.160 | 0.730 | 0.160 | 0.160 | 0.730 | 0.140 | 0.140 | 0.018 | 0.17 | 0.170 | 0.461 |
| Δμ | 0.110 | 0.160 | 2.534 | 0.060 | 0.030 | -2.403 | 0.090 | 0.170 | 2.973 | 0 | 0.010 | -2.259 |
月尺度下,极端高温与极端低温事件均伴随较高的GPP偏低风险,二者P值均为0.730,其中极端低温的Δμ为-2.403,对GPP表现出显著的抑制作用;极端高温则呈现特殊分异特征,虽然多数极端高温时段会造成GPP减少,但少数时段GPP提升幅度极大,使得综合效应仍表现为强烈正向驱动(Δμ=2.534)。极端降水条件下,GPP低产风险几乎完全消除,同时Δμ高达2.973,对GPP存在极强的促进作用;极端干旱时GPP偏低风险处于中等水平,严重的水分胁迫对植被生产力产生显著的抑制效应。总体而言,月尺度极端低温与极端干旱是抑制植被GPP的主要气候因素,二者均导致不同程度的GPP低值风险与抑制效应;而极端高温与极端降水则对GPP表现出正向驱动作用,其中极端降水的正向促进效应最为突出。
由表5可知,不同极端气候条件对3类植被GPP的影响呈现特异性和季节动态性,且各类植被对极端气候的响应敏感期与胁迫机制存在明显差异。极端高温对森林GPP的胁迫集中于5—8月生长旺期,呈中等抑制风险,而4、9—10月生长季始末期表现为弱促进效应,主要因为生长旺季高温引发的热胁迫直接削弱光合作用效率、加剧呼吸损耗;草地凭借较强耐热性与高水分利用效率,在7—9月生物量积累阶段受不同程度的高温抑制;农田GPP对高温的响应存在明显生育期差异,4月受高温正向驱动,6—9月关键生育期则因高温干扰植被生长而显著受抑。
表5 1981—2018年4—10月陕西省极端高温、极端低温、极端降水和极端干旱对森林、草地和农田GPP的影响风险系数
Tab.5
| 极端高温 | 极端低温 | ||||||||||||||||
|---|---|---|---|---|---|---|---|---|---|---|---|---|---|---|---|---|---|
| 月份 | 森林 | 草地 | 农田 | 森林 | 草地 | 农田 | |||||||||||
| P | Δμ | P | Δμ | P | Δμ | P | Δμ | P | Δμ | P | Δμ | ||||||
| 4 | 0.144 | 0.116 | 0.292 | 0.030 | 0.196 | 0.226 | 0.516 | -0.669 | 0.292 | -0.087 | 0.288 | -0.601 | |||||
| 5 | 0.410 | -0.503 | 0.337 | -0.120 | 0.284 | -0.048 | 0.665 | -0.944 | 0.290 | 0.017 | 0.342 | -0.409 | |||||
| 6 | 0.404 | -0.461 | 0.157 | 0.008 | 0.286 | -0.396 | 0.487 | -0.432 | 0.335 | 0.056 | 0.139 | 0.611 | |||||
| 7 | 0.361 | -0.248 | 0.147 | -0.043 | 0.222 | -0.448 | 0.466 | -0.441 | 0.299 | -0.399 | 0.233 | 0.200 | |||||
| 8 | 0.435 | -0.265 | 0.276 | -0.333 | 0.303 | -0.395 | 0.315 | -0.148 | 0.357 | -0.330 | 0.151 | 0.344 | |||||
| 9 | 0.263 | 0.066 | 0.304 | -0.257 | 0.372 | -0.431 | 0.510 | -0.389 | 0.439 | -0.435 | 0.285 | -0.062 | |||||
| 10 | 0.147 | 0.110 | 0.184 | 0.084 | 0.247 | -0.057 | 0.567 | -0.640 | 0.485 | -0.221 | 0.443 | -0.248 | |||||
| 月份 | 极端降水 | 极端干旱 | |||||||||||||||
| 森林 | 草地 | 农田 | 森林 | 草地 | 农田 | ||||||||||||
| P | Δμ | P | Δμ | P | Δμ | P | Δμ | P | Δμ | P | Δμ | ||||||
| 4 | 0.134 | 0.400 | 0.232 | 0.166 | 0.146 | 0.430 | 0.289 | -0.165 | 0.236 | -0.005 | 0.286 | -0.098 | |||||
| 5 | 0.069 | 0.351 | 0.239 | 0.189 | 0.225 | 0.021 | 0.613 | -0.849 | 0.254 | -0.075 | 0.322 | -0.299 | |||||
| 6 | 0.032 | 0.642 | 0.209 | 0.136 | 0.151 | 0.498 | 0.372 | -0.324 | 0.483 | -0.569 | 0.297 | -0.181 | |||||
| 7 | 0.051 | 0.380 | 0.093 | 1.073 | 0.147 | 0.838 | 0.519 | -0.496 | 0.260 | -0.152 | 0.203 | 0.078 | |||||
| 8 | 0.254 | -0.365 | 0.214 | 0.059 | 0.233 | -0.305 | 0.610 | -0.590 | 0.378 | -0.432 | 0.342 | -0.639 | |||||
| 9 | 0.203 | 0.066 | 0.129 | 0.569 | 0.234 | 0.039 | 0.347 | -0.196 | 0.296 | -0.225 | 0.312 | -0.236 | |||||
| 10 | 0.185 | 0.090 | 0.055 | 0.306 | 0.267 | 0.002 | 0.238 | 0.003 | 0.438 | -0.206 | 0.344 | -0.126 | |||||
极端低温整体对森林GPP构成高风险胁迫,所有月份均呈抑制效应,极端低温对新生组织的损伤是主要诱因;草地低温胁迫集中于7—10月生长季后期,低温加速叶片衰老、降低光合产物积累,且在秦巴山区等过渡带易与干旱形成协同胁迫,进一步加剧植被生产力损耗;农田GPP对低温的响应呈季节性波动,生长季的初期和末期受抑,6—8月转为促进。
极端降水对3类植被整体以正向驱动为主,但存在月尺度差异化响应:森林8月受过量降水引发的根系缺氧、养分吸收受阻影响,呈中等抑制,其余时段均为促进;草地因浅根系结构对降水补给敏感性更高,7月降水促进效应达到峰值;农田仅8月短暂受降水抑制,其余生育期均受益于适度降水的水分供给。
极端干旱对3类植被GPP均以抑制为核心特征,且胁迫敏感期各不相同:森林5、8月枝叶与果实发育期水分亏缺造成的抑制最显著;草地6月生长旺季受干旱胁迫最强,直接引发叶片枯萎、光合效率骤降;农田8月灌浆期对干旱最敏感,水分短缺直接制约籽粒发育与产量形成。
不同植被类型在生长季受极端气候影响的风险存在差异,这与不同植被的生理生态特性、生长特征及对环境因子的适应性差异密切相关。
3 讨论
陕西省地形地貌空间异质性突出,气候梯度分异显著,致使极端气候对植被GPP的驱动效应呈现明显区域差异。陕北地处半干旱气候带,水分是植被生产力的核心限制因子,极端干旱对GPP的抑制作用最为突出,极端低温胁迫广泛存在,该特征与我国北方半干旱区植被对极端气候的整体响应规律一致(朴世龙等,2019;杜文丽等,2020);关中地区水热条件空间分异复杂,表现为极端降水的正向促进效应与极端干旱、极端低温的抑制效应并存;陕南属北亚热带湿润区,降水总量充足但时空分配不均,极端高温与极端降水均显著提升区域GPP,与相关研究表明长江流域等湿润区适度升温、降水补给可缓解植被水分胁迫、促进光合生产(贾怡童,2020;张善红等,2024)相一致。
不同植被类型对极端气候的响应特征存在明显差异,本文发现森林对极端低温高度敏感,生长季内除8月外,各月均受高风险抑制;同时由于5—8月为水分需求阶段,极端干旱对森林生产力的制约作用也很突出,该特征与杜文丽等(2020)研究结论一致。草地生产力对极端降水呈积极响应,7月降水偏多可显著提升植被光合作用,仅8—9月受极端高温的负面影响,该变化趋势与张善红等(2024)和Zhao等(2025)的研究结论一致,另外生长季后期低温、干旱叠加,也会导致草地生产力加剧损耗。农田对极端低温表现出阶段性差异化响应,生长初、末期受低温抑制,6—8月反转为促进效应;极端降水总体有利于农田生长,仅8月易因积水内涝产生负面作用。
4 结论
本文基于1981—2018年GPP数据和4个极端气候指数,探究陕西省GPP对极端气候的定量响应特征,揭示极端气候事件对不同区域和不同植被类型GPP的影响差异,得到如下主要结论。
1)1981—2018年,全省植被GPP呈持续上升趋势,固碳能力稳步提升,且空间变化显著,多数区域呈改善态势,其中陕北地区GPP增长率最高,陕南地区GPP基础值高但增长率相对较低,区域间提升差异明显。
2)陕西不同区域GPP对极端气候的空间响应存在明显差异,陕北地区GPP受极端高温的促进作用显著,极端低温和极端干旱为核心制约因素;关中地区GPP对极端降水呈正向响应,极端低温和极端干旱抑制效应突出;陕南地区GPP受极端高温和极端降水的促进作用显著。
3)极端气候对GPP的影响存在显著时间尺度差异,月尺度是极端气候影响植被生产力的关键期,其影响强度远高于年尺度和生长季尺度。
4)极端高温下,森林和农田均在生长季旺期受抑;极端低温对森林、农田和生长季后期的草地均存在较强抑制效应;极端降水整体以正向作用为主,其中草地7月受促进作用最强;极端干旱对3类植被多为抑制作用。
参考文献
1980—2013年中国陆地生态系统总初级生产力对干旱的响应特征
[J].
干旱事件通过影响陆地生态系统的组成、结构和功能显著改变整个陆地生态系统碳循环。陆地生态系统总初级生产力(GPP)是全球陆地碳通量中最大的组成部分,反映了陆地生态系统的生产力水平。本研究利用基于过程模型模拟的GPP数据(DLM GPP)、基于通量观测升尺度的GPP数据(FLUXCOM GPP)和标准化降水蒸散指数(SPEI),量化分析了1980—2013年中国陆地生态系统GPP和干旱的时空格局,讨论了不同时间尺度上GPP对干旱的响应特征。结果表明:1980—2013年,两种不同GPP数据在中国地区呈现的时间变化趋势的空间分布格局较为一致,上升趋势主要分布在西南地区,下降趋势主要分布在东北大部分地区;中国干旱面积的长期时间变化趋势略有下降,其中干旱化趋势主要位于秦岭淮河以南地区,而西北内陆地区则呈现明显的湿润化趋势;时间尺度上,GPP与SPEI年际变化格局基本吻合,1986、1997、2001和2011年等干旱年份的GPP显著降低;空间尺度上,北方大部分地区的GPP与SPEI呈正相关,南方大部分地区呈负相关,干旱对GPP的影响在半干旱地区表现更加明显;GPP对干旱的响应格局与选取干旱指数的时间尺度密切相关,而且不同方式估算的GPP对干旱响应和敏感度存在差异。因此,未来需进一步改进GPP模型和方法,增加观测站点,提高GPP估算的精确性。
Global observed changes in daily climate extremes of temperature and precipitation
[J].
Flooding stress:Acclimations and genetic diversity
[J].
Hurricane pulses:Small watershed exports of dissolved nutrients and organic matter during large storms in the Southeastern USA
[J].
Whole-system responses of experimental plant communities to climate extremes imposed in different seasons
[J].
Effects of climate extremes on the terrestrial carbon cycle:Concepts,processes and potential future impacts
[J].
Ecological impacts of a widespread frost event following early spring leaf-out
[J].
Uncertainty in simulating regional gross primary productivity from satellite-based models over northern China grassland
[J].
Plant growth and mortality under climatic extremes: An overview
[J].
Drought- and heat-induced shifts in vegetation composition impact biomass production and water use of alpine grasslands
[J].
Evaluation of MODIS NPP and GPP products across multiple biomes
[J].
Remote sensing of the terrestrial carbon cycle: A review of advances over 50 years
[J].
Global estimates of evapotranspiration and gross primary production based on MODIS and global meteorology data
[J].
Impacts of extreme precipitation and seasonal changes in precipitation on plants
[J].. The global hydrological cycle is predicted to become more intense in future climates, with both larger precipitation events and longer times between events in some regions. Redistribution of precipitation may occur both within and across seasons, and the resulting wide fluctuations in soil water content (SWC) may dramatically affect plants. Though these responses remain poorly understood, recent research in this emerging field suggests the effects of redistributed precipitation may differ from predictions based on previous drought studies. We review available studies on both extreme precipitation (redistribution within seasons) and seasonal changes in precipitation (redistribution across seasons) on grasslands and forests. Extreme precipitation differentially affected above-ground net primary productivity (ANPP), depending on whether extreme precipitation led to increased or decreased SWC, which differed based on the current precipitation and aridity index of the site. Specifically, studies to date reported that extreme precipitation decreased ANPP in mesic sites, but, conversely, increased ANPP in xeric sites, suggesting that plant-available water is a key factor driving responses to extreme precipitation. Similarly, the effects of seasonal changes in precipitation on ANPP, phenology, and leaf and fruit development varied with the effect on SWC. Reductions in spring or summer generally had negative effects on plants, associated with reduced SWC, while subsequent reductions in autumn or winter had little effect on SWC or plants. Similarly, increased summer precipitation had a more dramatic impact on plants than winter increases in precipitation. The patterns of response suggest xeric biomes may respond positively to extreme precipitation, while comparatively mesic biomes may be more likely to be negatively affected. Moreover, seasonal changes in precipitation during warm or dry seasons may have larger effects than changes during cool or wet seasons. Accordingly, responses to redistributed precipitation will involve a complex interplay between plant-available water, plant functional type and resultant influences on plant phenology, growth and water relations. These results highlight the need for experiments across a range of soil types and plant functional types, critical for predicting future vegetation responses to future climates.
Response of Gross Primary Productivity (GPP) of the desert steppe ecosystem in the northern foothills of Yinshan Mountain to extreme climate
[J].The desert steppe ecosystem at the Northern Foothills of the Yinshan Mountains (NFYS) is characterized by its fragility and heightened sensitivity to global climate change. Understanding the response and lag effects of Gross Primary Productivity (GPP) to climate change is imperative for advancing ecological management and fostering sustainable development. The spatiotemporal dynamics of chlorophyll fluorescence-based GPP data and its responses to precipitation, temperature, and extreme climate from 2001 to 2023 were analyzed. The random forest model and the partial least squares regression model were employed to further elucidate the response mechanisms of GPP to extreme climate, with a specific focus on the lag effect. The findings revealed that the GPP in the NFYS exhibited distinct regional characteristics, demonstrating a predominantly increasing trend over the past 23 years. The region has experienced a warming and drying trend, marked by a decrease in the intensity and frequency of extreme precipitation events, and an increase in extremely high temperatures and consecutive hot days, except a slight, albeit insignificant, increase in precipitation in the northeastern part. GPP exhibits varying degrees of lag, ranging from one to three months, in response to both normal and extreme climatic conditions, with a more immediate response to extreme temperatures than to precipitation. The influence of different climatic conditions on the lag effects of GPP can amplify the negative effects of extreme temperatures and the positive impact of extreme precipitation. The anticipated trend towards a warmer and more humid climate is projected to foster an increase in GPP. This research is of great theoretical and practical significance for deeply understanding the adaptation mechanisms of ecosystems under the context of climate change, optimizing desertification control strategies, and enhancing regional ecological resilience.
Extreme events in gross primary production: A characterization across continents
[J].. Climate extremes can affect the functioning of terrestrial ecosystems, for instance via a reduction of the photosynthetic capacity or alterations of respiratory processes. Yet the dominant regional and seasonal effects of hydrometeorological extremes are still not well documented and in the focus of this paper. Specifically, we quantify and characterize the role of large spatiotemporal extreme events in gross primary production (GPP) as triggers of continental anomalies. We also investigate seasonal dynamics of extreme impacts on continental GPP anomalies. We find that the 50 largest positive extremes (i.e., statistically unusual increases in carbon uptake rates) and negative extremes (i.e., statistically unusual decreases in carbon uptake rates) on each continent can explain most of the continental variation in GPP, which is in line with previous results obtained at the global scale. We show that negative extremes are larger than positive ones and demonstrate that this asymmetry is particularly strong in South America and Europe. Our analysis indicates that the overall impacts and the spatial extents of GPP extremes are power-law distributed with exponents that vary little across continents. Moreover, we show that on all continents and for all data sets the spatial extents play a more important role for the overall impact of GPP extremes compared to the durations or maximal GPP. An analysis of possible causes across continents indicates that most negative extremes in GPP can be attributed clearly to water scarcity, whereas extreme temperatures play a secondary role. However, for Europe, South America and Oceania we also identify fire as an important driver. Our findings are consistent with remote sensing products. An independent validation against a literature survey on specific extreme events supports our results to a large extent.


