

0 引言
对于葡萄而言,气温升高通常会使花芽期提前7~15 d(Wolkovich et al.,2017;Koch and Oehl,2018;Bernáth et al.,2021),但也会使其遭受终霜冻的可能性增加(Mosedal et al.,2015)。气温变化、终霜冻与低温冻害等已成为葡萄产业发展的主要气候风险(柏秦凤等,2019:Venios et al.,2020;吴炫柯等,2021),不但制约着葡萄种植范围(岳慧欣等,2021),也严重影响葡萄的品质和产量(马麒龙等,2016)。目前针对葡萄花芽期生物学观察和葡萄春季霜冻气象指标的研究较多(张振文等,2010;刘伟等,2017;罗惠格等,2023;黄娟等,2023;季芬等,2024;梁小娟等,2024),而针对葡萄花芽期对气候变化的响应以及葡萄花芽期霜冻灾害风险的研究尚不多见。
新疆是中国七大葡萄产区之一,葡萄种植面积和产量稳居全国首位。其中极端干旱区吐鲁番市葡萄种植面积为新疆最大,产量约占新疆总产量的40%,是我国重要的优质葡萄生产基地,葡萄种植已成为吐鲁番市农业经济的主要支柱产业。吐鲁番地处天山南坡,春季气温回升迅速但极不稳定,终霜冻出现时间波动大,严重影响葡萄生长。了解气候因子和终霜冻对葡萄花芽期的影响,对于保障葡萄产业可持续发展具有重要意义。本文以极端干旱区新疆吐鲁番市主栽品种无核白葡萄为研究对象,通过分析1991—2024年葡萄花芽期物候与气候因子、终霜冻的变化特征,确定葡萄花芽期物候提前的主要气象影响因子,并探讨其潜在的霜冻灾害风险,旨在为防灾减灾及指导葡萄生产提供参考依据。
1 研究区概况、资料与方法
1.1 研究区概况
新疆吐鲁番市属典型暖温带大陆性干旱荒漠气候,年平均气温为12.6~15.7 ℃,年降水量为9.2~26.7 mm,年日照时数大于3 000 h,极端最高气温为49.0 ℃,极端最低气温为-24.7 ℃(张山清等,2009),该区域干燥少雨、日照时间长、昼夜温差大等气候条件十分适合种植葡萄。新疆吐鲁番市冬季寒冷,11月上旬至次年3月中旬为葡萄埋土期,埋土防寒是确保本地葡萄安全越冬的关键方法,春季开春早、升温快的气候特点在影响葡萄出土期早晚的同时也影响葡萄生长的物候期。
1.2 资料
选择新疆吐鲁番主栽品种无核白葡萄主产地(42°30′N—43°15′N,89°23′E—91°55′E)为研究区域。1991—2024年葡萄花芽期(4—5月,芽开放期至开花末期)物候数据,以及同期逐旬平均气温(Tm)、最高气温(Tmax)、最低气温(Tmin)、降水量(P)、相对湿度(Relative Humidity,RH)、日照时数(S)、0 cm地温(Tg0)、最高0 cm地温(Tg0max)、最低0 cm地温(Tg0min)、5 cm地温(Tg5)、10 cm地温(Tg10)、≥0 ℃积温(∑T0)等气象资料均来源于鄯善国家基本气象站。
1.3 方法
本文将逐年终霜冻日、葡萄不同物候期起始日期转换为日序数(即自当年1月1日起的累计天数),构建终霜冻日、物候期时间序列。采用线性倾向估计法分析葡萄不同物候期日序数及其气候因子的变化趋势(刘璐等,2020)。斯皮尔曼(Spearman)等级相关系数(Myers and Well,2003)可理解为对两组变量排序后计算得到的皮尔逊相关系数,因此采用该方法分析葡萄不同物候期日序数与终霜冻日日序数、终霜冻日最低0 cm地温、逐旬气候因子的相关性。将相关系数通过显著性检验的气候因子(p<0.05),利用逐步线性回归方法得到标准化回归系数,以回归系数绝对值最大的变量作为影响葡萄物候期的主导气候因子(王挺等,2023)。
2 葡萄花芽期变化特征
2.1 物候统计特征
表1列出1991—2024年新疆吐鲁番葡萄不同物候期起始日期与花芽期长度。可以看出,1991—2024年吐鲁番无核白葡萄从芽开放期至开花末期平均花芽期长度为45 d,最长61 d(2023年)、最短28 d(2002年),两者相差33 d。其中1995、1998、2000、2002—2004、2022、2024年花芽期日数短于平均值5~17 d,2008—2011、2014、2023年长于平均值6~12 d,其他年份的花芽期长度接近平均值(表略)。
表1 1991—2024年新疆吐鲁番葡萄不同物候期起始日期与花芽期长度
Tab.1
| 芽开放期 | 展叶始期 | 展叶盛期 | 花蕾花序期 | 开花始期 | 开花盛期 | 开花末期 | 花芽期长度/d | |
|---|---|---|---|---|---|---|---|---|
| 平均日 | 4月7日 | 4月13日 | 4月19日 | 4月24日 | 5月12日 | 5月17日 | 5月21日 | 45 |
| 最早日 | 3月30日 | 4月7日 | 4月12日 | 4月12日 | 5月5日 | 5月7日 | 5月16日 | 28 |
| 最晚日 | 4月20日 | 4月27日 | 5月12日 | 5月20日 | 5月25日 | 5月29日 | 6月2日 | 61 |
新疆吐鲁番葡萄进入花芽期(芽开放期)的平均日期为4月7日,结束花芽期(开花末期)的平均日期为5月21日。从芽开放期到开花末期等物候期早晚相差18~39 d,其中开花末期相差最小,花蕾花序期相差最大。芽开放期最早在3月30日(2008年),最晚在4月20日(2003年)。展叶始期平均日期在4月13日,最早在4月7日(2009年),最晚在4月27日(2002年)。展叶盛期平均在4月19日,最早、最晚出现年份与展叶始期一致,分别在4月12日、5月12日。花蕾花序期一般出现在4月中旬至5月中旬,平均在4月24日。开花始期和开花盛期的平均日期分别为5月12日和17日。葡萄花芽期最早5月16日(2005、2006年)结束,最晚6月2日(2010年)结束。
2.2 主要气候因子变化特征
从新疆吐鲁番市葡萄不同物候期气候因子的气候倾向率(表2)可以看出,1991—2024年葡萄芽开放期至开花末期平均气温、≥0 ℃积温、0 cm地温、5 cm地温、10 cm地温均呈显著上升趋势,升温速率分别为0.49、68.77、0.69、1.64、1.71 ℃·(10 a)-1,近34 a分别升高约1.67、233.82、2.35、5.58、5.81 ℃,其中平均气温、≥0 ℃积温、0 cm地温在芽开放期上升最显著,升温速率分别为0.71、52.56、0.88 ℃·(10 a)-1;降水量呈不显著增加趋势,增幅为0.31 mm·(10 a)-1,但芽开放期至花蕾花序期降水量呈减少趋势,在年降水量仅26.7 mm的极端干旱区,该变化的影响可忽略不计;日照时数、相对湿度均呈逐渐递减的趋势,降幅分别为8.07 h·(10 a)-1、1.55%·(10 a)-1,近34 a分别降低27.44 h、5.27%,其中芽开放期相对湿度下降最明显,平均每10 a降低1.84%。总体来看,吐鲁番市葡萄花芽期气候呈暖干化趋势,且芽开放期暖干化趋势最明显。
表2 1991—2024年新疆吐鲁番葡萄不同物候期气候因子的气候倾向率
Tab.2
| 物候期 | 温度/[℃·(10 a)-1] | P/[mm·(10 a)-1] | S/[h·(10 a)-1] | RH/[%·(10 a)-1] | ||||
|---|---|---|---|---|---|---|---|---|
| Tm | ∑T0 | Tg0 | Tg5 | Tg10 | ||||
| 花芽期 | 0.49* | 68.77** | 0.69** | 1.64** | 1.71** | 0.31 | -8.07 | -1.55* |
| 芽开放期 | 0.71* | 52.56* | 0.88** | 1.73** | 1.72** | -0.05 | 1.99 | -1.84* |
| 展叶期 | 0.46 | 9.04 | 0.75* | 0.35 | 1.63** | -0.02 | 0.16 | -1.36* |
| 花蕾花序期 | 0.48 | 14.38 | 0.74* | 1.74** | 1.75** | -0.14 | -2.20 | -1.22 |
| 开花期 | 0.47 | 10.26 | 0.63* | 1.75** | 1.79** | 0.16 | -3.89* | -1.56* |
注:*、**分别表示通过0.05、0.01的显著性检验,下同。
2.3 花芽期物候趋势变化特征
图1
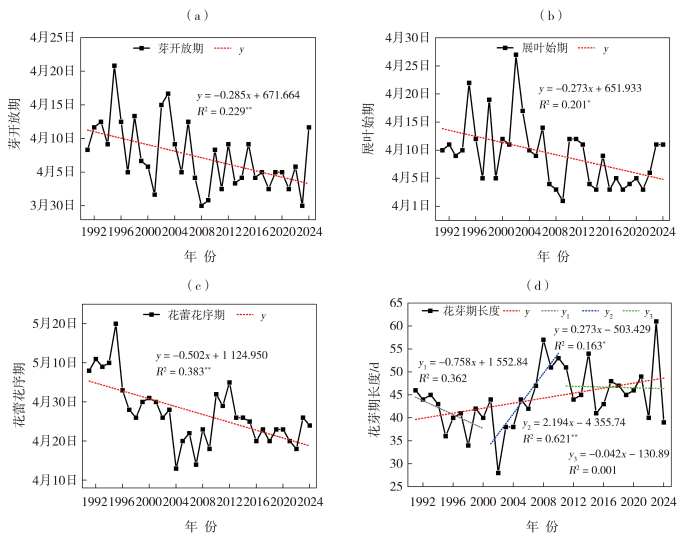
图1
1991—2024年新疆吐鲁番葡萄不同物候期起始日期及花芽期长度年际变化
(a)芽开放期,(b)展叶始期,(c)花蕾花序期,(d)花芽期长度
Fig. 1
Interannual variations of onset dates of different phenological stages and flower bud duration of grapes in Turpan, Xinjiang from 1991 to 2024
(a) bud opening stage, (b) initial leaf expansion stage, (c) flower bud and inflorescence stage, (d) flower bud duration
由此可见,近34 a新疆吐鲁番葡萄花芽期气候呈暖干化趋势,致使葡萄芽开放期、展叶始期、花蕾花序期显著提前,展叶盛期、开花始期至开花末期不显著提前,最终导致葡萄花芽期长度显著延长。
3 气候因子对葡萄花芽期的影响
新疆吐鲁番葡萄芽开放期至展叶盛期日序数与多个旬气候因子存在显著相关性;花蕾花序期至开花末期,影响物候进程的旬气候影响因子数量逐渐减少,花芽期长度仅与相对湿度和降水量存在相关性(表3)。
表3 1991—2024年新疆吐鲁番葡萄不同物候期日序数、花芽期长度与逐旬气候因子的相关性及其主导气候因子
Tab.3
| 物候期 | 相关系数通过p<0.05显著性检验的气候因子 | 相关系数通过p<0.01显著性检验的气候因子 | 主导气候因子及其相关系数 |
|---|---|---|---|
| 芽开放期 | -Tmax3下、-Tg03下、-Tg0max3下、-Tg04中、-Tg0min4中 | -Tg53下、-Tg103下、-∑T03下、RH3下、RH4上、-Tg0max4中、-Tg54中、-Tg104中 | RH4上;r=0.572** |
| 展叶始期 | -Tm4上、-Tmax4上、Tg04上、-Tg04中、-Tg104下 | -Tg0max4上、-Tg54上、-Tg104上、RH4上、-Tg0max4中、-Tg54中、-Tg104中、-∑T04中 | Tg0max4中;r=-0.546** |
| 展叶盛期 | -Tg04中、-Tg0max4中、-Tg0min4中、Tg104下、-Tg05上 | -Tg54中、-Tg104中、-∑T04中、-Tg0max5上、-Tg55上、-Tg105上 | Tg0max5上;r=-0.722** |
| 花蕾花序期 | -Tg0max4中、-Tg55中、-Tg105中 | -Tg0minx4中、-Tg54中、-Tg10x4中、-Tg0min4下、-Tg54下、-Tg104下 | Tg0min4下;r=-0.530** |
| 开花始期 | -Tm5上、-Tg05上、-∑T05上、-RH5中 | RH5中;r=-0.509** | |
| 开花盛期 | -Tm5上、-Tmax5上、Tg05上、-Tmin5中、-Tg0min5中、S5下 | ||
| 开花末期 | -Tmin5中、-Tg0min5中 | ||
| 花芽期长度 | RH3下、RH4上、P5上 | RH3下;r=-0.486** |
注:负号表示负相关,气候因子上标数字为月份,上、中、下分别为上旬、中旬、下旬。
芽开放期的主导旬气候因子为4月上旬相对湿度,其每增加(减少)10%,芽开放期推后(提前)6.51 d[图2(a)];展叶始期和展叶盛期的主导旬气候因子为4月中旬和5月上旬最高0 cm地温,其每升高1 ℃,展叶始期、展叶盛期分别提前0.99 d、1.22 d[图2(b)、(c)];花蕾花序期主导旬气候因子为4月下旬最低0 cm地温,其每增加(减少)1 ℃,花蕾花序期提前(推后)1.89 d[图2(d)];开花始期的主导旬气候因子为5月中旬相对湿度,其每增加(减少)10%,开花始期提前(推后)3.18 d[图2(e)],这与芽开放期的影响规律存在明显差异。开花盛期与开花末期无主导旬气候因子。花芽期长度的主导旬气候因子为3月下旬相对湿度,若相对湿度每减少(增加)10%,葡萄花芽期长度将延长(缩短)7.16 d[图2(f)]。表明较高的相对湿度会延缓葡萄芽开放的进程,进而缩短花芽期持续时间。
图2
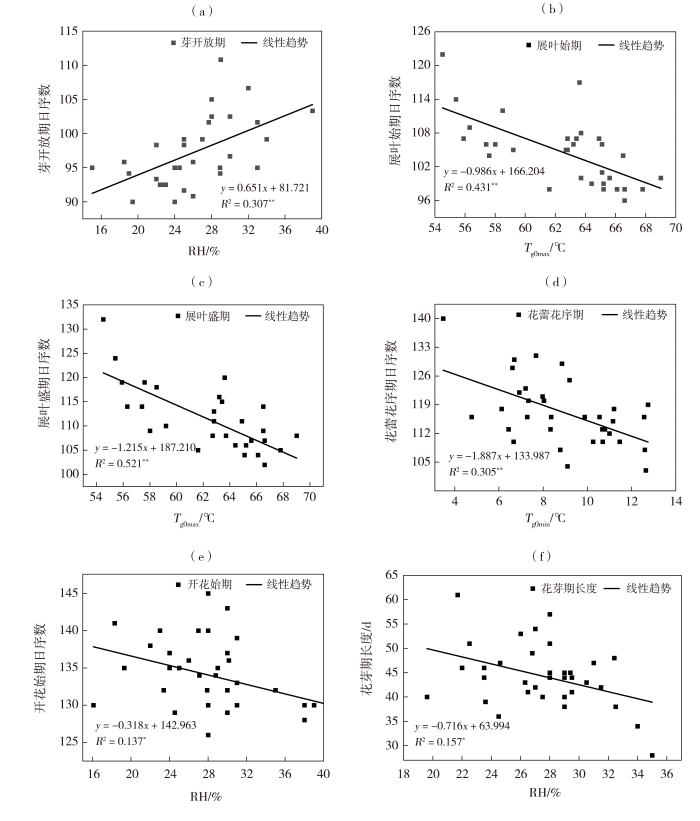
图2
1991—2024年新疆吐鲁番葡萄不同物候期日序数及花芽期长度与主导旬气候因子的相关性
(a)芽开放期,(b)展叶始期,(c)展叶盛期,(d)花蕾花序期,(e)开花始期,(f)花芽期长度
Fig. 2
Correlations between day-of-year for different grape phenological stages, flower bud duration and the dominant ten-day climatic factors in Turpan, Xinjiang from 1991 to 2024
(a) bud opening stage, (b) initial leaf expansion stage, (c) full leaf expansion stage, (d) flower bud and inflorescence stage, (e) flowering initial stage, (f) flower bud duration
综上所述,影响新疆吐鲁番葡萄不同物候期日序数的主导逐旬气候因子为相对湿度与地温。芽开放期至花蕾花序期相对湿度越小、地温越高,物候期越早;而开花始期则表现为相对湿度越大(小),物候期越早(晚)。在干旱低湿环境下,葡萄花芽期持续时间更长。因此,在新疆吐鲁番市,春季相对湿度变化是影响葡萄花芽期长度的关键气象条件,对花期调控及产量形成具有重要意义。
4 终霜冻对葡萄花芽期的影响
4.1 花芽期物候及长度与终霜冻的关系
图3
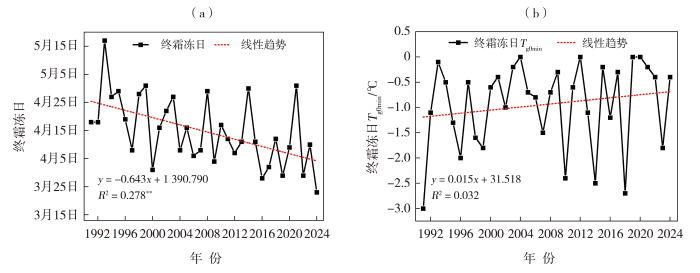
图3
1991—2024年新疆吐鲁番市终霜冻日(a)、终霜冻日Tg0min(b)年际变化
Fig. 3
Interannual variations of the last frost day (a) and Tg0min of the last frost day (b) in Turpan City from 1991 to 2024
分析葡萄花芽期物候与终霜冻日日序数、终霜冻日最低0 cm地温的相关性(表略),发现葡萄花芽期日序数、花芽期长度与终霜冻日最低0 cm地温呈不显著负相关;终霜冻日日序数与开花始期至开花末期日序数呈显著正相关性(p<0.05),与芽开放期至花蕾花序期日序数呈不显著正相关,与花芽期长度呈不显著负相关。
由此可见,终霜冻日提前可促进葡萄花芽期物候进程,尤以开花始期至开花末期的响应更为显著,进而影响葡萄花芽期长度。
4.2 花芽期长度与终霜冻灾害
根据葡萄花芽期平均气温[图4(a)]、相对湿度[图4(b)]及花芽期长度[图1(d)]年际变化趋势,结合历史霜冻灾情资料统计(表4),分析花芽期长度变化与终霜冻发生的关系。结果表明,1991—2024年新疆吐鲁番葡萄芽开放期后遭受终霜冻影响的年份共计10次,平均约3.4 a发生1次。21世纪最初十年,葡萄花芽期呈暖干化趋势,气温升高0.16 ℃,相对湿度降低6.48%,花芽期长度显著延长,延长幅度为21.94 d·(10 a)-1(p<0.01),该阶段霜冻灾害发生频率最高,平均约每2.0 a一遇;20世纪90年代与21世纪10年代以来,葡萄花芽期呈相对暖湿化变化,气温分别升高2.01 ℃和1.04 ℃,相对湿度分别上升3.91%和0.85%,花芽期长度呈缩短趋势,缩短幅度分别为7.58、0.42 d·(10 a)-1,相应霜冻灾害发生频率降低,分别约为每3.3 a、每7.0 a一遇。由此可见,在极端干旱区,气候暖干化会导致葡萄花芽期长度延长,霜冻灾害发生频率显著增加。
图4
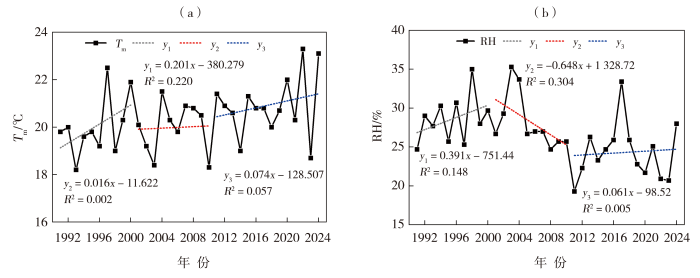
图4
1991—2024年新疆吐鲁番葡萄花芽期Tm(a)、RH(b)年际变化
Fig. 4
Interannual variation of Tm (a) and RH (b) during grape flower bud duration in Turpan, Xinjiang from 1991 to 2024
表4 1991—2024年新疆吐鲁番葡萄花芽期终霜冻灾害的温度特征
Tab.4
| 年份 | 日期 | 物候期 | 最低0 cm地温/℃ | 日最低气温/℃ | 灾害持续日数/d | 过程降温幅度/℃ |
|---|---|---|---|---|---|---|
| 1993 | 4月7—9日 | 芽开放期 | -3.6 | -0.7 | 3 | 7.8 |
| 1994 | 4月12—13日 | 展叶期 | -3.1 | 0.3 | 2 | 7.3 |
| 1996 | 4月12—13日 | 芽开放期 | -2.0 | -1.0 | 2 | 5.6 |
| 2001 | 4月9—10日 | 芽开放期 | -7.7 | -1.6 | 2 | 8.6 |
| 2003 | 4月17—20日 | 芽开放期 | -2.5 | 1.0 | 4 | 14.1 |
| 2005 | 4月8—9日 | 芽开放期 | -4.9 | -2.7 | 2 | 16.8 |
| 2006 | 4月11—12日 | 芽开放期 | -0.2 | 2.1 | 2 | 13.3 |
| 2008 | 4月21—22日 | 展叶期 | -2.7 | 2.7 | 3 | 14.3 |
| 2014 | 4月24—25日 | 花蕾花序期 | -3.5 | -0.2 | 2 | 12.9 |
| 2021 | 4月25—26日 | 花蕾花序期 | -0.2 | 0.8 | 2 | 14.5 |
4.3 花芽期终霜冻致灾气象条件
分析1991—2024年新疆吐鲁番10次葡萄花芽期终霜冻致灾气象条件(表4)发现,霜冻灾害最早发生在4月7日(1993年),最晚发生于4月26日(2021年)。灾害发生时,日最低气温为-2.7(2005年)~2.7 ℃(2008年),最低0 cm地温为-7.7(2001年)~-0.2 ℃(2006年、2021年),灾害持续日数多为2~4 d,过程降温幅度为5.6~16.8 ℃。花芽期冻害多出现于强冷空气过境当日或天气转晴后1~2 d内。降温幅度>5 ℃的冷空气过境会造成芽开放期至展叶期冻害;降温幅度>10 ℃的强冷空气过境,不仅会造成芽开放期至展叶期冻害,还可能造成花蕾花序期冻害。
以2021年4月25—26日冻害为例,4月21日08:00(北京时,下同)冷空气过境前期,出现明显的回暖,平均温度为23.0 ℃,最低气温为14.4 ℃;4月23日08:00冷空气过境期间,出现降温,平均温度为11.0 ℃,最低气温为8.2 ℃;4月25日,冷空气过境后,温度进一步下降,平均温度为8.8 ℃,最低气温为0.8 ℃。此次冻害发生在花蕾花序期,过程降温达14.5 ℃,最低气温降温幅度达13.6 ℃。2003年以来,造成霜冻灾害的强冷空气过程,过程降温幅度均超过12.0 ℃,降温幅度远大于20世纪90年代,更容易造成葡萄花芽期霜冻冻害。
总体来看,新疆吐鲁番市近34 a终霜冻日提前,21世纪初葡萄花芽期长度显著延长,霜冻灾害发生的频率增加。如果终霜冻日出现在葡萄芽开放期前,不会造成冻害,但终霜冻日出现在葡萄花芽期,则对葡萄生长造成不利影响。在极端干旱区日常服务中关注春季强冷空气过程,能够有效提高葡萄花芽期冻害预报和服务准确率。
5 讨论与结论
5.1 讨论
影响葡萄花芽期物候早晚的主导旬气候因子为相对湿度与地温。芽开放期至花蕾花序期相对湿度越小、地温越高,葡萄花芽期物候越早;开花始期则相对湿度越大,物候期越早。在葡萄气象服务与栽培管理中应密切关注地温与相对湿度等关键气象要素对葡萄物候期的影响,重点防范气候暖干化背景下花芽期物候提前、强降温引发霜冻灾害,降低气候变化对葡萄生产的不利影响。
受观测资料的限制,已有研究数据难以全面反映葡萄园近地层微气候特征,且未充分考虑土地性质、栽培管理措施及田间环境差异等多重因素影响。未来可进一步结合地面多源观测与遥感监测技术,精准解析葡萄物候变化与霜冻灾害的发生机制,为葡萄产业布局优化、气候风险防控与可持续发展提供更有力的技术支撑。
5.2 结论
本文利用1991—2024年新疆吐鲁番市主栽品种无核白葡萄芽开放期至开花末期等物候期数据和同时期气象观测资料,分析极端干旱区气候因子和终霜冻对葡萄花芽期的影响,得到以下主要结论。
(1)新疆吐鲁番市葡萄花芽期气候呈暖干化趋势,平均气温、10 cm地温的升温速率分别为0.49、1.71 ℃·(10 a)-1,相对湿度降低幅度为1.55%·(10 a)-1。以21世纪最初十年暖干化特征突出,该阶段霜冻灾害发生频率达每2 a一遇。
(2)相对湿度与地温是影响葡萄花芽期物候早晚的主导旬气候因子。1991—2024年,葡萄花芽期长度延长2.73 d·(10 a)-1,芽开放期至开花末期物候期提前幅度为0.13~5.02 d·(10 a)-1,以花蕾花序期提前幅度最大。
(3)降温幅度>5 ℃的冷空气过境会造成芽开放期至展叶期冻害;降温幅度>10 ℃的强冷空气过境,不仅会造成芽开放期至展叶期冻害,还可能造成花蕾花序期冻害。
参考文献
且末县气候变化特征及其对棉花发育期和产量的影响
[J].
为探究气候变化对且末县棉花发育期和产量的影响,利用新疆且末县国家基准气候站1961—2021年气温、降水量以及日照时数等资料,结合棉花发育期和产量资料,采用线性倾向法、气候趋势率等方法,对且末县气候变化特征及其对棉花发育期和产量影响进行分析。结果表明:1961—2021年,且末县棉花生长季平均气温、平均最高气温、平均最低气温和5 cm平均地温呈线性上升趋势;降水量以及≥10℃积温和日数呈微弱增加趋势,日照时数呈现减少趋势;7—8月最高温度及高温持续日数呈显著升高趋势。且末县初霜日出推后,终霜日提前,无霜期日数显著增多。棉花出苗期至开花期与生育期内的气温和地面温度呈负相关关系,吐絮期至收获期与气温和地面温度呈正相关关系。且末县棉花伏桃数与平均最低气温和≥10℃积温为呈正相关,棉花产量与气温、日照时数和5 cm地面温度呈正相关关系。气候变化背景下且末县棉花播种至开花期提前,吐絮期和收获期推迟,全生育期延长。且末县棉花生长季热量资源的增加总体有利于棉花产量及品质的提高,但应注意夏季气温过高对棉铃发育的不利影响。
气候变化对‘红地球’葡萄发育期及花序开放的影响
[J].为适应气候变化,促进北疆地区葡萄产业持续稳定的发展,采取平行观测和试验方法,通过试验观测研究气象要素变化对葡萄生长发育期以及花序开放的影响。结果表明,北疆葡萄生长期在4月中下旬—10月中旬,休眠期在10月下旬—4月上中旬。‘红地球’葡萄萌芽至可采成熟≥10℃活动积温、开花期气温与葡萄产量显著相关。葡萄开花期为生长关键期,一般需要持续1~2周,盛花期2~3 d。花序开放日动态表现为明显的双峰曲线,10:00—12:00时开花最多,14:00—16:00时空气干燥、气温超过30℃花序开放减少步入低谷。葡萄花序开放温度在16~30℃之间,最适宜温度为22~26℃。葡萄开花最适合空气相对湿度在50%~80%之间。葡萄盛花期花序开放日变化与净光合速率日变化吻合,相关系数达到极显著水平。温度、湿度、光照是影响葡萄生长及花序开放的3个重要环境要素。试验结果可为研究葡萄生物学特征、预防气象灾害和安全生产提供参考。
近58年华北地区初、终霜日及无霜期变化特征分析
[J].基于华北地区90个气象站点1961 -2018年地面0 cm日最低温度和平均气温资料, 采用线性倾向估计、 反距离加权、 Mann-Kendall检验、 累积距平法, 研究了近58年华北地区初、 终霜日和无霜期的变化特征。结果表明: (1)在年际和年代际尺度上, 华北地区初、 终霜日和无霜期均分别呈显著推迟、 提前和延长的趋势, 从20世纪80年代开始, 趋势逐渐明显, 反映出气候的变暖趋势。(2)由北向南随纬度和海拔的降低, 初、 终霜日和无霜期分别呈推迟、 提前和延长的趋势, 平均气温上升速率越大越显著的站点, 其初、 终霜日和无霜期推迟、 提前和延长的速率也较显著; 山区初、 终霜日和无霜期分别比平原早、 晚和短。(3)初、 终霜日和无霜期突变分别发生在1986, 1995和1995年, 各区域初、 终霜日和无霜期均在20世纪80年代和90年代发生突变。(4)初、 终霜日和无霜期的等值线呈北移趋势。(5)初、 终霜日和无霜期在未来分别呈持续推迟、 持续提前和持续延长的趋势, 且三者的变化幅度为无霜期>终霜日>初霜日。
新疆哈密市初、终霜冻日变化及其对棉花生长的影响
[J].采用1971―2019年新疆哈密国家基准气候站逐日最低气温观测资料,统计分析哈密市初霜冻日(秋季日最低气温≤-1.0 ℃的第一天)、终霜冻日(春季日最低气温≤1.0 ℃的最后一天)的气候特征及变化趋势,以及在棉花苗期和成熟期出现的概率,探讨其对棉花生长的影响。结果表明:这49年哈密市平均终霜冻日为4月16日,终霜冻日出现在棉花播种出苗期(4月10―25日)的概率为57%,出现在棉花苗期(4月25日之后)的概率为18%;2011―2019年终霜冻日出现在棉花播种出苗期的概率下降13百分点,出现在苗期的概率下降7百分点;哈密市终霜冻日变化整体呈明显的提前趋势,提前2.7 d·(10 a)-1,终霜冻日提前对棉花生长有利。这49年哈密市平均初霜冻日为10月18日,初霜冻日出现在棉花成熟期10月上旬的概率为24%,出现在10月中旬的概率为33%,出现在10月下旬的概率为41%;2011―2019年初霜冻日出现在10月上旬的概率变化不大,出现在10月中旬的概率上升23百分点,出现在10月下旬的概率下降19百分点;哈密市初霜冻日变化整体呈缓慢提前趋势,提前0.2 d·(10 a)-1,初霜冻日提前对棉花生长不利。
1963—2012年中国主要木本植物花期长度时空变化
[J].花期物候变化研究对赏花活动安排、园林景观布置和致敏花粉防治等具有重要意义。现有研究对始花期与盛花期的变化趋势已有较为深刻的认识,但很少有研究辨识了花期长度的时空变化。本文基于“中国物候观测网”观测数据,统计了1963-2012年中国42个站点23种广布木本植物的花期长度变化趋势,分析了花期长度变化的时空格局、种间差异和变化形式。主要结论为:所有的259条花期长度时间序列中,61.39%的序列呈延长趋势,其中显著延长的占21.24%(P
贵州霜冻气候变化特征
[J].为合理利用气候资源指导农业生产,利用贵州省1961—2018年84个气象站点地面0 cm日最低气温资料,采用线性趋势、M-K突变检验和空间分析等方法,分析了贵州地区初霜冻日、终霜冻日和无霜冻期的变化特征。结果表明:近58 a贵州地区平均初霜冻日、终霜冻日分别为12月2日和2月23日,平均无霜冻期为291 d,分别以2.34 d·(10a)-1、2.95 d·(10a)-1和5.76 d·(10a)-1的速率呈明显推迟、提前和延长的变化趋势;空间上初霜冻日呈现西部早、东部晚,北部早、南部晚的变化特征,69%的站点呈显著推迟的变化趋势;终霜冻日呈现南部早、西北部和东北部晚的变化特征;无霜冻期整体呈延长趋势,82%的站点通过显著性水平检验;海拔高度是影响贵州地区初霜冻日、终霜冻日和无霜冻期的关键因子,无霜冻期随纬度和海拔高度升高呈缩短趋势。初霜冻日推迟、终霜冻日提前和无霜冻期的延长,为贵州农业生产提供了充足的热量资源,利于粮食生产。
Influence of climate warming on grapevine (Vitis vinifera L.) phenology in conditions of central Europe (Slovakia)
[J].
Rethinking false spring risk
[J].
Grapevine phenology in France: from past observations to future evolutions in the context of climate change
[J].Aim: Phenology is a key factor in explaining the distribution and diversity of current vineyards in France. This work has the objective to summarize the different studies developed in France to analyze grapevine phenology.Methods and results: Several topics are presented: a general description of all historical databases and observatory networks developed in France during the last 70 years; an overview of the different models developed to calculate the main phenological stages; an analysis of the main results obtained using these models in the context of studies of climate change impacts on viticulture in France; and finally a general discussion about the main strategies to adapt the phenological cycle to future climate conditions.Conclusion: This review emphasizes that even if phenology is not the only trait to be considered for adapting grapevine to climate change, it plays a major role in the distribution of the current variety x vineyard associations.Significance and impact of the study: It is therefore critical to continue to study phenology in order to better understand its physiological and genetic basis and to define the best strategies to adapt to future climatic conditions.
The influence of climate warming on flowering phenology in relation to historical annual and seasonal temperatures and plant functional traits
[J].Climate warming has the potential to influence plant flowering phenology which in turn can have broader ecological consequences. Herbarium collections offer a source of historical plant data that makes possible the ability to document and better understand how warming climate can influence long-term shifts in flowering phenology. We examined the influence of annual, winter, and spring temperatures on the flowering phenology of herbarium specimens for 36 species collected from 1884–2015. We then compared the response to warming between native and non-native, woody and herbaceous, dry and fleshy fruit, and spring vs summer blooming species. Across all species, plants flowered 2.26 days earlier per 1 °C increase in annual average temperatures and 2.93 days earlier per 1 °C increase in spring onset average temperatures. Winter temperatures did not significantly influence flowering phenology. The relationship of temperature and flowering phenology was not significantly different between native and non-native species. Woody species flowered earlier than herbaceous species only in response to increasing annual temperatures. There was no difference in the phenological response between species with dry fruits and those fleshy fruits for any of the temperature periods. Spring blooming species exhibited a significantly greater phenological response to warming yearly average temperatures than summer blooming species. Although herbarium specimens can reveal climate change impacts on phenology, it is also evident that the phenological responses to warming vary greatly among species due to differences in functional traits such as those considered here, as well as other factors.
Stronger spring phenological advance in future warming scenarios for temperate species with a lower chilling sensitivity
[J].Spring warming could induce earlier leaf-out or flowering of temperate plant species, and decreased chilling in winter has a delaying effect on spring phenology. However, the relative contribution of the decreased chilling and increased forcing on spring phenological change is unclear. Here, we analyzed the experimental data for 14 temperate woody species in Beijing, China and quantified the forcing requirements (FR) of spring phenology and chilling sensitivity (the ratio of the FR at the low chilling condition to the FR at the high chilling condition) for each species. Furthermore, using species-specific functions between the amount of chilling and FR, we established a phenological model to simulate the annual onset dates of spring events during the past 69 years (1952–2020) and in the future (2021–2099) under RCP 4.5 and RCP 8.5 climate scenarios. We also developed a novel method to quantitatively split the predicted phenological change into the effects caused by changes in forcing and those caused by changes in chilling. The results show that the FR of spring events decreased with the increase in the amount of chilling, and this relationship could be described as an exponential decay function. The basic FR (the FR at the high chilling condition) and chilling sensitivity varied greatly among species. In the 1952–2020 period, the advancing effect of increased forcing was stronger than the effect of chilling, leading to earlier spring events with a mean trend of −1.96 days/decade. In future climate scenarios, the spring phenology of temperate species would continue to advance but will be limited by the decreased chilling. The species with lower chilling sensitivities showed stronger trends than those with high chilling sensitivities. Our results suggested that the delaying effect of declining chilling could only slow down the spring phenological advance to a certain extent in the future.
Predicting future frost damage risk of kiwifruit in Korea under climate change using an integrated modelling approach
[J].
Climate change favors grapevine production in temperate zones
[J].
Climate change and crop exposure to adverse weather: Changes to frost risk and grapevine flowering conditions
[J].
Plant phenology and global climate change: Current progresses and challenges
[J].
Grapevine responses to heat stress and global warming
[J].The potential effects of the forthcoming climate change include the rising of the average annual temperature and the accumulation of extreme weather events, like frequent and severe heatwaves, a phenomenon known as global warming. Temperature is an important environmental factor affecting almost all aspects of growth and development in plants. The grapevine (Vitis spp.) is quite sensitive to extreme temperatures. Over the current century, temperatures are projected to continue rising with negative impacts on viticulture. These consequences range from short-term effects on wine quality to long-term issues such as the suitability of certain varieties and the sustainability of viticulture in traditional wine regions. Many viticultural zones, particularly in Mediterranean climate regions, may not be suitable for growing winegrapes in the near future unless we develop heat-stress-adapted genotypes or identify and exploit stress-tolerant germplasm. Grapevines, like other plants, have developed strategies to maintain homeostasis and cope with high-temperature stress. These mechanisms include physiological adaptations and activation of signaling pathways and gene regulatory networks governing heat stress response and acquisition of thermotolerance. Here, we review the major impacts of global warming on grape phenology and viticulture and focus on the physiological and molecular responses of the grapevine to heat stress.
The interaction between freezing tolerance and phenology in temperate deciduous trees
[J].Temperate climates are defined by distinct temperature seasonality with large and often unpredictable weather during any of the four seasons. To thrive in such climates, trees have to withstand a cold winter and the stochastic occurrence of freeze events during any time of the year. The physiological mechanisms trees adopt to escape, avoid, and tolerate freezing temperatures include a cold acclimation in autumn, a dormancy period during winter (leafless in deciduous trees), and the maintenance of a certain freezing tolerance during dehardening in early spring. The change from one phase to the next is mediated by complex interactions between temperature and photoperiod. This review aims at providing an overview of the interplay between phenology of leaves and species-specific freezing resistance. First, we address the long-term evolutionary responses that enabled temperate trees to tolerate certain low temperature extremes. We provide evidence that short term acclimation of freezing resistance plays a crucial role both in dormant and active buds, including re-acclimation to cold conditions following warm spells. This ability declines to almost zero during leaf emergence. Second, we show that the risk that native temperate trees encounter freeze injuries is low and is confined to spring and underline that this risk might be altered by climate warming depending on species-specific phenological responses to environmental cues.
Phenological diversity provides opportunities for climate change adaptation in winegrapes
[J].
Leaf-out in northern ecotypes of wide-ranging trees requires less spring warming, enhancing the risk of spring frost damage at cold range limits
[J].


