

0 引言
目前,国内关于复合极端事件的研究多集中于事件发生频率的时空演变分析。现有成果虽然明确了高温干旱复合事件自1990年代以来频次增加、影响范围持续扩大的演变特征(Wu et al.,2019a;韩佳昊等,2021),但此类统计分析方法存在明显局限,不仅易受极端异常值影响,同时还缺乏趋势外推能力。而通过长期历史观测资料构建概率分布模型的方法,在单变量极端气候研究中展现出较强的外推潜力,相关研究(蔡慧君等,2020)已基于多种概率分布模型对区域极端低温的发生概率及空间分布进行了深入探讨。而复合事件往往由多个气象变量协同驱动,变量间的依赖关系对评估复合事件的发生概率及其潜在影响至关重要(梁媛媛等,2022),传统单变量概率模型难以有效刻画变量间的内在协同关联。Copula函数因其能够刻画多变量间的非线性依赖关系,成为干旱与高温复合事件研究的重要方法(Hao et al.,2018;Zhang et al.,2022a),已在小麦、玉米等主要粮食作物的复合事件研究中得到应用(Guo et al., 2022;Chen et al., 2024)。
水稻作为对水分和温度高度敏感的作物,其关键生育期(如孕穗期、抽穗期和成熟期)遭遇高温干旱复合胁迫会导致产量显著下降(董朝阳等,2015;雷智雯等,2025)。四川省作为我国西南地区最大的水稻生产基地,其气候受亚热带季风与复杂地形共同影响,降水时空分异性显著(应寿英等,2024),近年来高温频发与降水格局变化的叠加效应日益突出,使水稻生产面临复合事件的常态化威胁(Ridder et al.,2021)。因此,本文基于四川省7个水稻种植区92个气象站1981—2022年逐日降水量和最高温度数据,分别使用标准化降水蒸散指数和标准化温度指数构建联合分布模型,结合Copula函数构建各站点在水稻不同生育期的联合累积概率分布,以获得高温和干旱强度的联合重现期及其概率分布,解析高温干旱复合事件的发生特征,旨在为四川水稻生产风险管理提供一定的理论依据。
1 研究区概况、资料与方法
1.1 研究区概况
四川省地处亚热带,复杂的地貌与季风环流共同作用,形成了多样化的气候类型(熊志强,1999)。水稻种植主要集中于攀西地区与四川盆地。攀西地区属干湿季分明的季风气候,年降水量为800~1 200 mm,区域差异显著;四川盆地则为典型的亚热带季风气候,雨量丰沛,年降水量为800~1 600 mm。
1.2 数据及水稻种植区关键生育期时段划分
四川省水稻种植区92个气象站1981—2022年逐日最高气温、最低气温、平均温度、降水量、平均风速等资料来自四川省农业气象中心,数据完整齐全且经过严格的质量控制。
图1
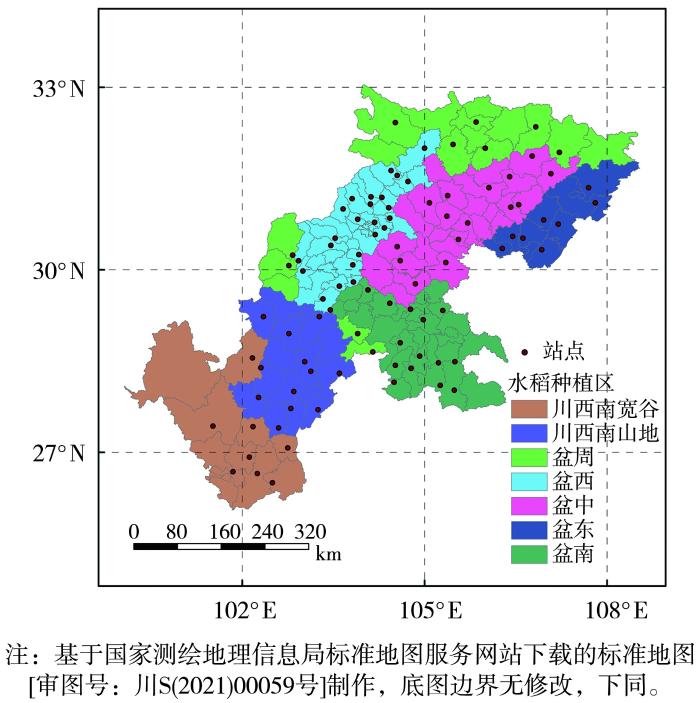
图1
研究区水稻种植分区(填色)及92个气象站点(圆点)空间分布
Fig.1
Spatial distribution of rice planting regions (the color shaded) and 92 meteorological stations (dots) in the study area
表1 四川省不同区域水稻关键生育期时段划分
Tab.1
| 区域 | 孕穗—抽穗 | 抽穗—成熟 |
|---|---|---|
| 川西南宽谷 | 7月21日—8月10日 | 8月11日—9月10日 |
| 川西南山地 | 7月21日—8月10日 | 8月11日—9月10日 |
| 盆南 | 7月1—10日 | 7月11日—8月10日 |
| 盆西 | 7月21日—8月10日 | 8月11日—9月10日 |
| 盆中 | 7月21—31日 | 8月1日—9月10日 |
| 盆东 | 7月21日—8月10日 | 8月11—31日 |
| 盆周 | 7月21日—8月20日 | 8月21日—9月30日 |
1.3 研究方法
1.3.1 高温干旱复合事件识别
高温事件采用标准化温度指数(Standardized Temperature Index,STI)进行识别。该指数对逐日最高气温序列进行标准化处理,可表征高温强度的异常程度,是极端高温监测的常用指标,具体计算方法参考Hansen等(2012)文献。STI为标准化距平,正值越大代表高温强度越强。
表2 高温与干旱强度等级划分标准
Tab.2
| 干旱或高温强度 | SPEI | STI |
|---|---|---|
| 轻度 | -1.0<SPEI≤-0.5 | 0.5≤STI<1.0 |
| 中度 | -1.5<SPEI≤-1.0 | 1.0≤STI<1.5 |
| 重度 | SPEI≤-1.5 | STI≥1.5 |
利用SPEI和STI对水稻关键生育期的高温干旱复合事件进行识别与分析,并通过累积分布函数(Cumulative Distribution Function,CDF),量化水稻两个关键生育期高温与干旱强度的分布特征。为使SPEI与STI变化趋势保持一致,对SPEI取负值变换。变换后干旱越严重,SPEI数值越大,便于后续开展概率分布拟合与联合概率计算。参照既定的高温与干旱强度等级标准,基于变换后SPEI与原序列STI构建9种双变量组合类型,进而分析不同干旱-高温强度组合下的复合极端事件特征。
1.3.2 Copula和二元联合重现期
为量化不同等级的高温与干旱复合事件发生概率,针对复合事件分析中的STI与SPEI双变量。基于1981—2022年观测数据,对各站点的STI序列和SPEI序列分别进行正态分布(Normal)、极值分布(Extreme Value,EV)和广义极值分布(Generalized Extreme Value,GEV)的边际分布拟合。采用Kolmogorov-Smirnov (K-S)检验的P值进行拟合优度检验,筛选出最优边际分布。将确定的STI与SPEI最优边际分布,分别与Frank、Clayton、Gumbel、Student’s t、Plackett及Symmetrised Joe-Clayton 6种Copula函数进行联合拟合,并利用赤池信息准则(Akaike Information Criterion,AIC)进行模型比较,筛选出最优Copula函数。各Copula函数的具体数学表达式及参数约束范围参考梁媛媛等(2022)文献。
由拟合的最优Copula函数,可计算高温干旱复合事件的二元联合重现期(Return Period,RP),表示两个变量同时超过某一阈值的平均发生间隔。重现期可由二维联合超越概率计算得到(Zscheischler et al.,2020),二维联合超越概率即一个事件中两个变量都超过一定阈值的概率,具体公式如下:
式中:RP为重现期;p为联合超越概率;P为概率运算符;X和Y分别代表高温强度和干旱强度两个随机变量;x和y分别为高温强度和干旱强度的阈值;FX和FY是两个随机变量边际分布函数;μ和ν分别为随机变量X和Y的累积概率;C(μ,ν)为联合累积概率。
2 结果与分析
2.1 水稻种植区高温干旱特征
图2
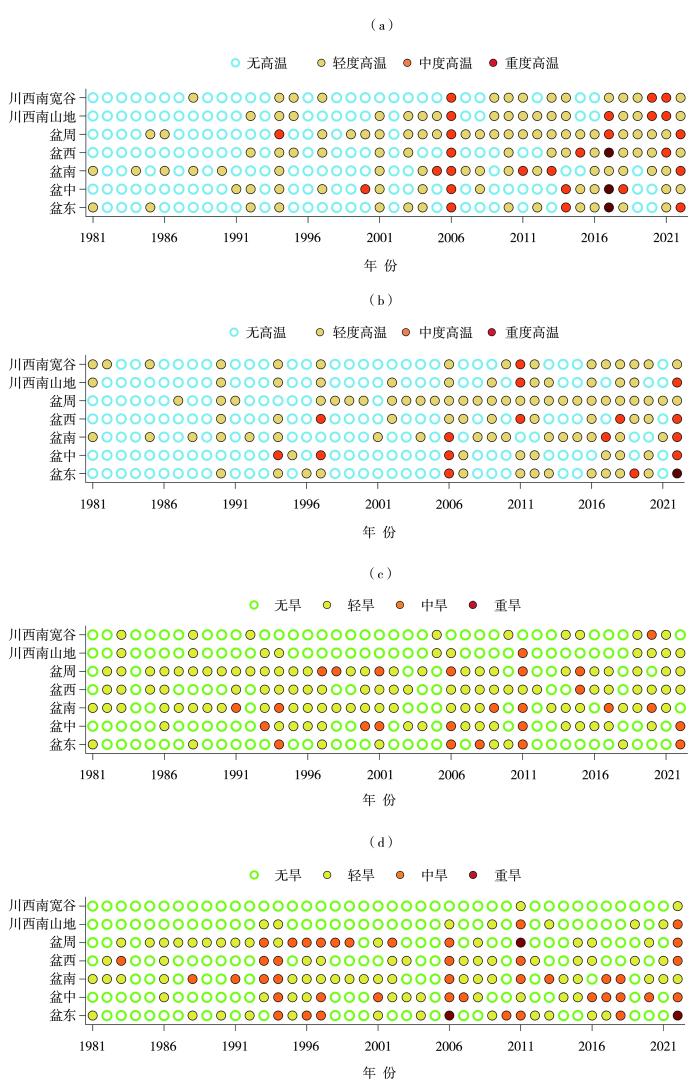
图2
1981—2022年四川省不同水稻种植区孕穗—抽穗期(a、c)、抽穗—成熟期(b、d)逐年高温(a、b)和干旱(c、d)平均强度等级统计
Fig.2
Statistics of annual average intensity grades of high temperature (a, b) and drought (c, d) during the booting-heading (a, c) and heading-maturity (b, d) stages in different rice planting regions of Sichuan Province from 1981 to 2022
孕穗—抽穗期,高温干旱复合事件的高发区主要集中在盆中、盆南以及盆周西北部(图3)。相比之下,川西南山地及川西南宽谷部分地区的发生频次则相对较低。抽穗—成熟时期,高温干旱复合事件的高频区域发生转移,盆东及通江、巴中等盆周东部的发生频次明显高于其他区域,而川西南山地、川西南宽谷以及芦山等盆周西部的发生频次则明显降低。
图3
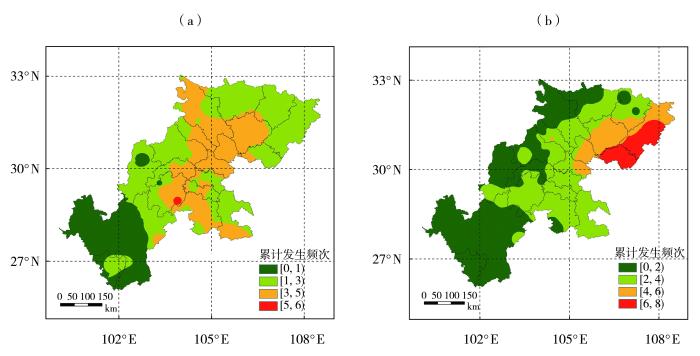
图3
1981—2022年四川水稻种植区孕穗—抽穗期(a)、抽穗—成熟期(b)高温干旱复合事件累计发生频次(单位:次)空间分布
Fig.3
Spatial distribution of cumulative occurrence frequency of compound high temperature and drought events during the booting-heading (a) and heading-maturity (b) stages in rice planting regions of Sichuan Province from 1981 to 2022 (Unit: times)
为揭示不同增暖背景下四川省水稻关键生育期高温、干旱事件的发生规律变化,参考中国气候增暖的阶段性特征(魏凤英等,2003),将研究期划分为1981—2000年与2001—2022年两个时段进行对比分析。图4为1981—2022年四川省不同区域水稻关键生育期两个时段的高温、干旱累计发生频次。可以看出,相较于1981—2000年,2001—2022年不同区域水稻关键生育期的高温发生频次均呈增加趋势,其中盆西、盆南和盆中增幅最明显。例如在孕穗—抽穗期高温事件中,盆西、盆南和盆中高温频次分别增加139、122和100次,在抽穗—成熟期高温事件中,则分别增加98、102和45次。除盆周地区水稻抽穗—成熟期外,2001—2022年其余区域水稻关键生育期的干旱发生频次相较于1981—2000年均呈增加趋势,尤以盆西地区最为突出,但其增加次数低于高温频次增加次数。
图4
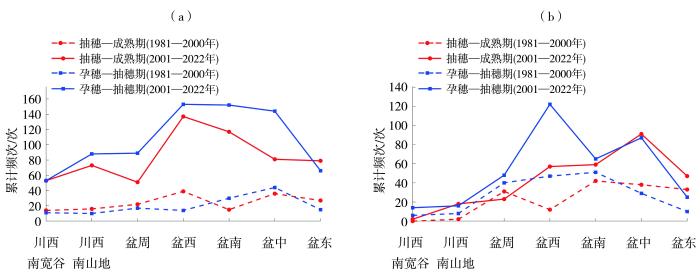
图4
1981—2022年四川省不同水稻种植区、不同生育期、不同时期的高温(a)、干旱(b)累计发生频次
Fig.4
Cumulative occurrence frequency of high temperature (a) and drought (b) in different rice planting regions, growth stages and periods in Sichuan Province from 1981 to 2022
2.2 高温、干旱事件强度最优边际分布函数和Copula函数拟合
对每个站点1981—2022年的STI与SPEI序列进行多边际分布拟合,并依据K-S检验结果遴选出各站点的最优分布类型。结果显示,92个站点在孕穗—抽穗期SPEI和STI的K-S检验P值范围分别为0.29~0.99和0.21~0.99,其中乐山、安县和广安SPEI的K-S检验P值最大均为0.99,大竹、武胜和青川STI的K-S检验P值最大均为0.99(图略)。在抽穗—成熟期SPEI和STI的K-S检验P值范围分别为0.23~0.99和0.19~0.99,其中长宁、岳池和青川SPEI的K-S检验P值最大均为0.99,天全、简阳和绵竹STI的K-S检验P值最大均为0.99(图略)。92个站点均通过显著性水平为0.01的拟合优度检验,以位于盆周边缘稻区的叙永站孕穗—抽穗期为例,该区地处四川盆地南缘、地形复杂,与盆地核心稻区的水热特征存在系统性差异,其最优分布的理论概率与经验概率基本接近,验证了分布拟合的有效性(图5)。
图5
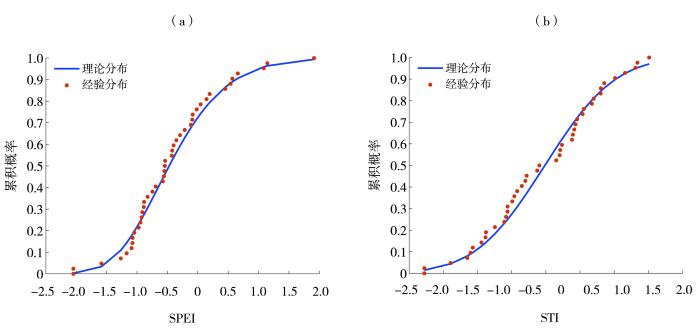
图5
叙永站1981—2022年水稻孕穗—抽穗期SPEI(a)与STI(b)的最优边际分布拟合曲线
Fig.5
Fitted curves of the optimal marginal distributions of SPEI (a) and STI (b) during the booting-heading stage of rice at Xuyong Station from 1981 to 2022
图6为1981—2022年水稻孕穗—抽穗期、抽穗—成熟期SPEI与STI最优边际分布函数空间分布。可以看出,在孕穗—抽穗时期,对于SPEI和STI采用EV、GEV、Normal等边际函数拟合,GEV分布成为SPEI和STI的最优边际分布,两者均有59个站点服从该分布;其余站点主要服从正态分布,其中SPEI和STI分别对应29个和32个站点,主要分布在川西南宽谷、川西南山地、盆西及盆东等水稻种植区;服从EV分布的站点数量最少。抽穗—成熟期,GEV仍为SPEI和STI的最优边际分布,分别有68个和81个站点服从该分布;其余站点以正态分布为主,对应SPEI与STI的站点数分别为23个和8个;EV函数拟合的站点数量最少。
图6
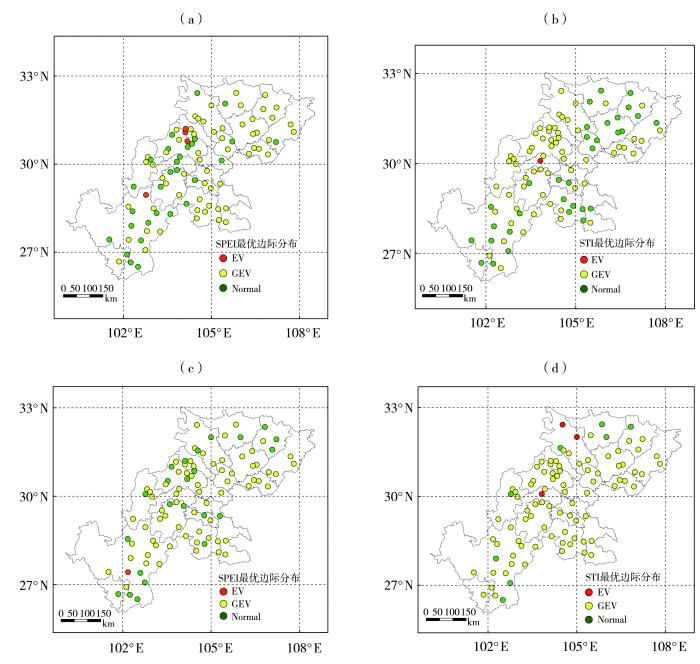
图6
1981—2022年四川水稻种植区孕穗—抽穗期(a、b)、抽穗—成熟期(c、d)SPEI(a、c)与STI(b、d)最优边际分布函数空间分布
Fig.6
Spatial distribution of optimal marginal distribution functions of SPEI (a, c) and STI (b, d) during the booting-heading (a, b) and heading-maturity (c, d) stages in rice planting regions of Sichuan Province from 1981 to 2022
对通过K-S检验的92个站点,采用6种Copula函数,分别构建水稻孕穗—抽穗期与抽穗—成熟期高温与干旱强度的联合累积概率分布。基于赤池信息准则筛选得到各站点在两个关键生育期的最优Copula函数类型空间分布如图7所示。可以看出,在孕穗—抽穗期,Gumbel Copula占据主导地位,适用于50个站点;Frank Copula次之,适用于21个站点;而Plackett与Clayton Copula则分别适用于13个和5个站点,其余类型的Copula函数应用较少。抽穗—成熟期,Gumbel Copula适用于59个站点;Plackett(11站)与Symmetrised Joe-Clayton(9站)Copula成为次优选择,而其他函数应用极少。这表明,Gumbel Copula在两个关键生育期中均为普适性最强的依赖结构模型。
图7
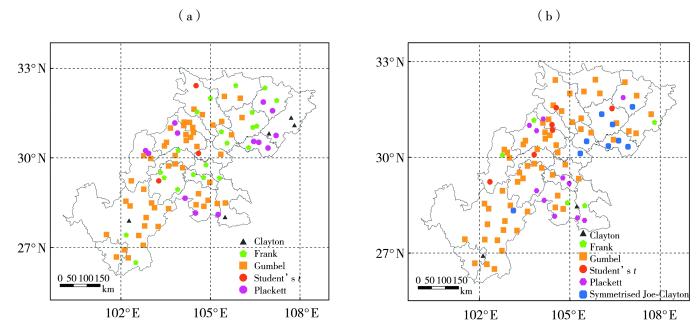
图7
1981—2022年四川水稻种植区孕穗—抽穗期(a)、抽穗—成熟期(b)高温与干旱强度最优Copula函数空间分布
Fig.7
Spatial distribution of optimal Copula functions of high temperature and drought intensity during the booting-heading (a) and heading-maturity (b) stages in rice planting regions of Sichuan Province from 1981 to 2022
图8
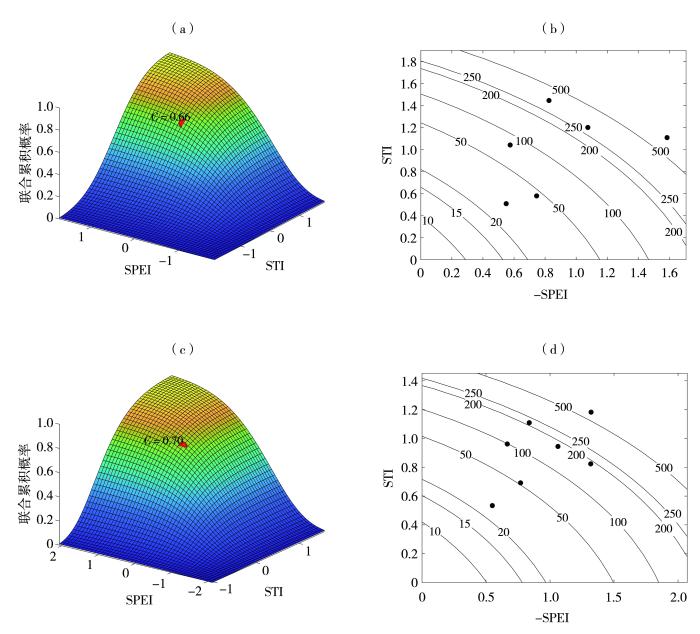
图8
1981—2022年叙永站水稻孕穗—抽穗期(a、b)、抽穗—成熟期(c、d)SPEI与STI联合累积概率(a、c)及其重现期(b、d)
(黑色点为高温干旱复合事件)
Fig.8
Joint cumulative probability (a, c) and corresponding return period (b, d) of SPEI and STI during the booting-heading (a, b) and heading-maturity (c, d) stages of rice at Xuyong Station from 1981 to 2022
(Black dots represent compound high-temperature and drought events)
图9为1981—2000年与2001—2022年两个时期,在水稻孕穗—抽穗期与抽穗—成熟期高温与干旱强度的累积分布函数(CDF)及其90%分位数(Q90)的变化特征。可以看出,在高温强度(STI)累积分布中,与1981—2000年相比,2001—2022年在两个生育期内,除抽穗—成熟期盆周地区CDF曲线相对稳定外,其余水稻种植区的CDF都明显右移;而在干旱强度(SPEI)累积分布中,与1981—2000年相比,2001—2022年在两个生育期内,除盆南地区CDF略微左移以及抽穗—成熟期盆周地区CDF相对稳定外,其余地区的CDF都向右移,且干旱强度右移幅度明显低于高温强度。这表明,近20 a来四川水稻生育期内高温胁迫持续存在并呈现加剧趋势,其加剧程度高于干旱。
图9
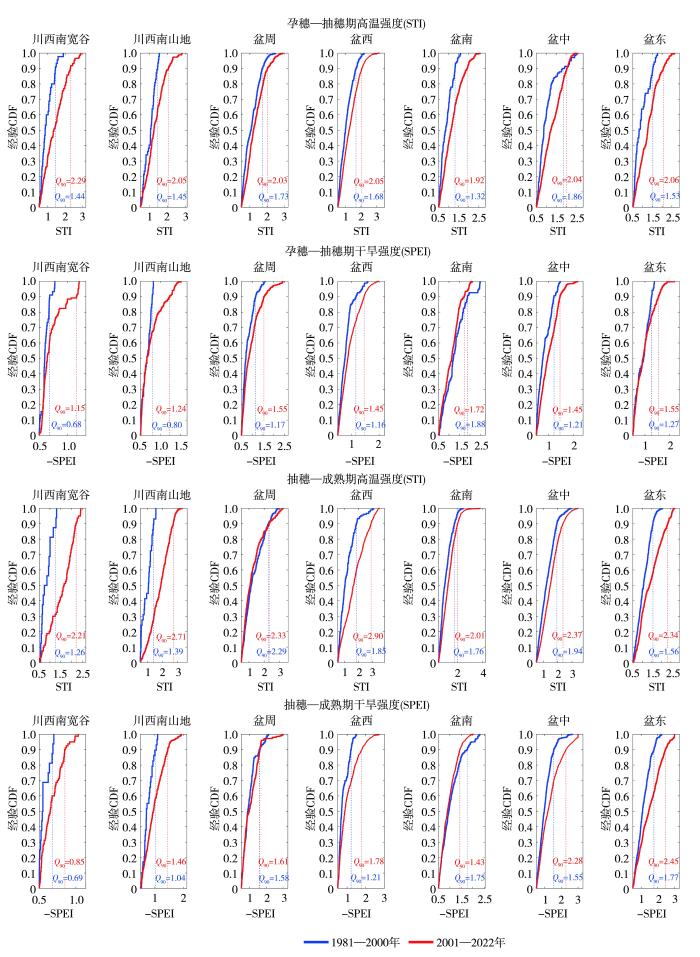
图9
四川省不同水稻种植区不同生育期不同时期的高温干旱强度累积分布函数及其90%分位数(Q90)
Fig.9
The cumulative distribution functions and their 90th percentiles (Q90) of high temperature and drought intensity in different rice planting regions of Sichuan Province during different growth stages and periods
图10为四川省水稻种植区孕穗—抽穗期不同等级高温干旱联合重现期空间分布。可以看出,轻度高温干旱复合事件的联合重现期最短,并呈现明显的空间分异,其中53个站点(占总数的58%)的重现期集中在9~20 a,即平均每9~20 a发生一次,主要分布在盆中、盆东以及盆西中部地区;25个站点(占总数的27%)重现期则为20~50 a,其余站点重现期超过50 a,甚至如布拖、会理、绵阳等地重现期则超过100 a。在轻度高温等级下,随着干旱等级增加,复合事件联合重现期明显增加,达到重旱时大部分地区重现期超过550 a。同时研究发现,在低强度等级下,盆中、盆东及盆西地区是轻度事件的高频区,其重现期低于其他区域;随着高温干旱事件强度增至中度时,盆西、川西南宽谷与川西南山地的重现期开始增加;对于高强度等级复合事件,盆中及盆周北部对高强度高温更敏感,重现期较短,而盆周西北部则对高强度干旱更为敏感。
图10
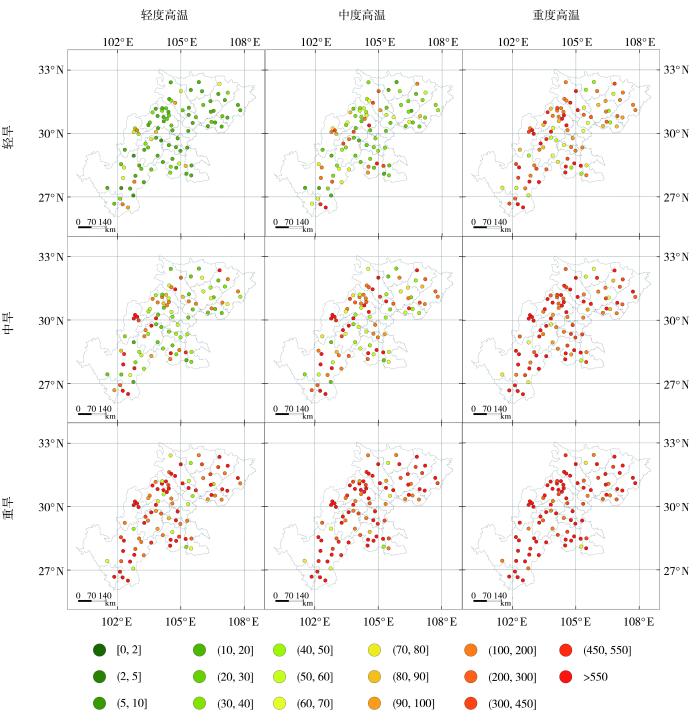
图10
四川省水稻种植区孕穗—抽穗期不同等级高温干旱联合重现期空间分布(单位:a)
Fig.10
Spatial distribution of the combined recurrence periods of high temperature and drought with different grades during the booting-heading stages in rice planting regions of Sichuan Province (Unit: a)
图11为四川省水稻种植区抽穗—成熟期不同等级高温干旱联合重现期分布。可以看出,轻度高温伴随轻旱的复合事件发生概率最高,其联合重现期最短。其中,都江堰、安岳、德阳等12个站点(占站点总数的13%)的重现期为5~10 a;另有34个站点(占总数的37%)的重现期则集中在20~50 a;剩余站点联合重现期则超过50 a,甚至青川、长宁等站点,重现期超过100 a,相对于孕穗—抽穗期有所增加。随着高温和干旱等级增加,复合事件联合重现期明显增加,如高温等级达到重度、干旱等级达到重旱时的复合事件联合重现期多在450 a以上。此外,相对于水稻孕穗—抽穗期,抽穗—成熟期轻度高温及轻旱复合事件的联合重现期整体更长。随着复合事件等级增加,联合重现期出现空间差异,盆西西北部地区以及盆南南部地区重现期低于其他地区,当高温和干旱强度为重度时,重现期则无明显的空间分布差异。
图11
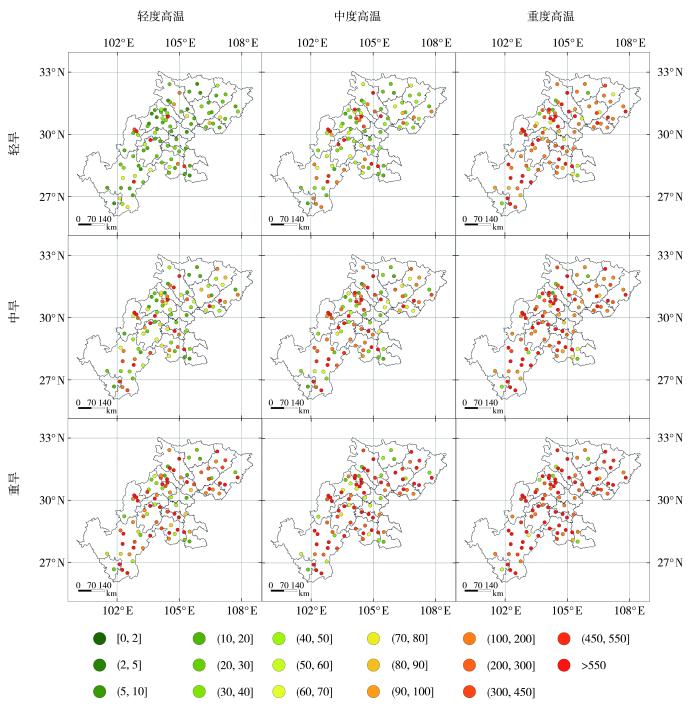
图11
四川省水稻种植区抽穗—成熟期不同等级高温干旱联合重现期分布(单位:a)
Fig.11
Spatial distribution of the combined recurrence periods of high temperature and drought with different grades during the heading-maturity stages in rice planting regions of Sichuan Province (Unit: a)
3 结论与讨论
3.1 讨论
随着全球变暖,高温干旱复合事件在北美洲、南亚及欧洲等地区频繁发生(Yao et al.,2018;Mukherjee et al., 2021;Tripathy et al., 2023)。在中国,特别是西南和长江流域,受气候增暖和降水格局变化的叠加影响,近20 a来此类复合事件的发生风险也持续加剧(金燕等,2018;韩兰英等,2019;Wu et al.,2019b;Wang et al., 2021)。水稻作为水生植物受高温干旱胁迫尤为明显,因此高温干旱指标的选择是衡量复合事件的主要依据,SPEI考虑降水并引入潜在蒸散发,全面反映水分供需平衡,而STI通过标准化,消除量纲差异,便于不同地区温度异常的比较,计算结果能更准确评估高温干旱事件特征。同时,四川省地域辽阔、区域差异大,不同区域水稻种植与成熟时期存在明显差异,因此本文将研究区划分为7个区域(甘书龙,1986)分别进行计算,更符合实际结果。
在研究方法上,以往研究大多基于高温干旱指数对历史数据进行统计,计算事件发生的频率、面积等(Sharma and Mujumdar,2017;武新英等,2021;蔡怡亨等,2023):如Zhang等(2022b)基于多个干旱指标评估中国高温干旱复合事件的频率、持续时间和严重程度等多个特征的变化情况。但现有成果多聚焦于复合事件的整体特征,本文则引入Copula函数,通过构建高温强度与干旱强度的联合累积概率分布模型,实现对任意等级复合事件的特征分析。相较于传统的多维高斯分布或泊松分布模型,Copula函数在刻画多变量非线性依赖关系时具有明显优势,其既能保持原始变量的边际分布特性,又可灵活拟合复杂的相依结构,因此将Copula函数拓展应用于高温干旱并发事件的研究中具有合理性。
综合试验结果,无论是孕穗—抽穗期,还是抽穗—成熟期广义极值分布(GEV)是四川水稻种植区大部分站点SPEI和STI的最优边际分布,与已有关于极端气候指数的研究一致(俞昕等,2023),可能原因是GEV是极值理论的核心模型,其概率密度函数具有重尾特征,能更准确描述高温、干旱等极端事件。同时在不同生育期也出现一定差异,如孕穗—抽穗期边际分布拟合优度优于抽穗—成熟期,可能与后者降水波动性更强有关。而在联合分布函数选择时,Gumbel Copula函数在两个生育期的大部分站点均由赤池信息准则判定为最优,说明SPEI和STI之间存在明显的上尾相关性。这意味着,当一个变量(如温度)趋于极端高值时,另一个变量(如干旱)也倾向于同时出现极端值的概率会明显增加,说明在四川水稻种植区,极端高温事件与极端干旱事件的发生并非独立,而是存在强烈的协同增强机制,其原因可能是持续异常高温会显著增加地表蒸散,加速土壤水分损耗,从而加剧干旱(姜大膀和王晓欣,2021);而土壤湿度降低会减少潜热通量,使得更多的净辐射转化为感热,进一步推升气温,这种双向强化机制,使得极端高温与极端干旱极易同时发生,反映出四川典型的干热共生气候风险特征(张菡等,2015)。
另外,在发生频率上,高温胁迫的加剧趋势远较干旱胁迫普遍和显著。由图4和图9可知,高温干旱时空演变趋势中,2001—2022年较1981—2000年,高温发生频率均呈一致且显著上升趋势;相比之下,干旱频率虽在整个种植区普遍上升,但增幅总体低于高温频率,且空间差异明显。在等级强度上,高温强度的增强也较干旱更为剧烈。2001—2022年高温强度(STI)的累积分布曲线在两个生育期内普遍右移;与此对应,干旱强度(SPEI)的累积分布曲线虽也呈现右移趋势,但其右移幅度明显小于高温强度。这与卫仁娟等(2024)等对四川极端高温干旱复合事件、邓彪等(2024)对区域性干旱过程综合强度显著增强的研究结论基本一致。然而,本文通过对比进一步发现,虽然干旱强度整体呈增强态势,但其增强的幅度明显低于同期高温的增幅。
当然,本研究仍存在一定局限性。首先,站点数据难以完全捕捉小尺度地形效应,未来需融合遥感与高分辨率模式数据开展进步一研究。其次,分析过程中未考虑人为灌溉对干旱指标的修正,可能低估实际水分胁迫。因此,未来研究中可考虑引入高时空分辨率的遥感反演数据(如土壤水分、地表温度、蒸散发产品等),弥补站点空间代表性的不足,或者直接采用考虑灌溉的土壤水分指数,以更真实地反映水稻实际遭受的水分胁迫。
3.2 结论
本文结合四川省1981—2022年92个气象站资料,通过SPEI及STI,分析7个水稻种植区高温干旱复合事件的时空特征,得到以下主要结论。
1)在7个水稻种植区中,轻度高温叠加轻度干旱的复合事件发生概率最高,在孕穗—抽穗期的联合重现期为9~20 a。
2)盆中、盆南、盆周等区域是高温干旱复合事件的高频区。孕穗—抽穗期是复合胁迫发生概率更高的关键生育期,夏合事件联合重现期整体短于抽穗—成熟期。
3)与1981—2000年相比,2001—2022年各种植区高温干旱复合事件的频率及强度均呈增加趋势,且高温的增幅大于干旱。这表明近20 a来四川省水稻生育期内高温干旱复合事件风险正在加剧,高温风险的累积尤为迅速。
参考文献
1997—2021年四川省干旱时空变化特征分析
[J].
构建适宜的气象干旱指标是开展干旱监测和干旱评价业务服务的基础。基于1997—2021年四川省155个国家气象站逐日平均气温和降水,以及各县(市、区)农作物播种面积资料,通过改进气象干旱综合指数(Meteorological Drought Composite Index, MCI)中的季节调节系数,形成改进的气象干旱综合指数(Modified Meteorological Drought Composite Index, MCI<sub>m</sub>);再结合历年干旱受灾面积、有效灌溉面积修订区域性干旱过程识别方法,并识别出四川省历年区域性干旱过程51次,然后再利用经验正交函数(Empirical Orthogonal Function,EOF)、旋转经验正交函数(Rotated Empirical Orthogonal Function)、Morlet小波分析法,分析区域性干旱过程时空分布特征。结果表明:1997—2021年四川省发生区域性干旱过程的持续日数呈现出“先变短再增长再变短”,平均影响范围呈现出“先减小再增大再减小”,平均强度和综合强度呈现出“先减弱再增强再减弱”的变化趋势。平均年干旱过程累积日数总体呈现盆地多于盆周山区、盆周山区多于川西高原和攀西地区的特征。年累积MCI<sub>m</sub>距平EOF分解空间型存在全区一致特征,同时也存在南北反位相特征。四川省可划分为6个区域性干旱气候区,2009—2015年各区年累积MCI<sub>m</sub>周期变化比2001—2008年更明显。改进后的区域性干旱过程识别方法识别出的干旱过程与干旱灾情更为吻合,更能准确反映四川省干旱发生的实际状况。
气候变暖背景下中国干旱强度、频次和持续时间及其南北差异性
[J].在全球气温日趋升高和极端降水增加的气候背景下,近年来中国干旱变化特征异常突出,新形势下需进一步深入认识干旱灾害影响机制。利用1960—2014年中国527个气象站逐日气温和降水量数据,选用改进的综合气象干旱指数(MCI)作为监测指标,详细分析了中国干旱强度、频次和持续时间变化特征及其南北差异性。结果表明:气候变暖背景下,中国干旱范围扩大、程度加剧、频次增加;干旱发生的范围发生了明显的转移,北方干旱加剧的同时,南方干旱明显加重,尤其是大旱范围明显增加。中国干旱范围主要在黄河流域以南和长江以北地区。干旱频次北方高于南方,东部高于西部,长江流域以北干旱频次较高。中国干旱持续时间较长,而且四季都有可能发生干旱。干旱不仅发生在干旱区和半干旱区,湿润和半湿润区域也常有干旱发生。不同年代、不同区域干旱发生的程度、持续时间和频次有一定的差异。中国20世纪90年代中后期至21世纪初期干旱范围最广、持续时间最长,造成的损失最严重。中国干旱强度、频次和持续时间南北差异性显著。气候变暖后,中国干旱强度加重、范围扩大、频次增加和持续时间增加明显。
基于Copula函数的西南地区一季稻高温干旱复合事件演变特征
[J/OL].
Global warming and changes in risk of concurrent climate extremes: Insights from the 2014 California drought
[J].
Climatic challenges in the growth cycle of winter wheat in the Huang-Huai-Hai Plain: New perspectives on high-temperature-drought and low-temperature-drought compound events
[J].Global climate change increasingly impacts agroecosystems, particularly through high-temperature–drought and low-temperature–drought compound events. This study uses ground meteorological and remote sensing data and employs geostatistics, random forest models, and copula methods to analyze the spatial and temporal distribution of these events and their impact on winter wheat in the Huang-Huai-Hai Plain from 1982 to 2020. High-temperature–drought events increased in frequency and expanded from north to south, with about 40% of observation stations recording such events from 2001 to 2020. In contrast, low-temperature–drought events decreased in frequency, affecting up to 80% of stations, but with lower frequency than high-temperature–drought events. Sensitivity analyses show winter wheat is most responsive to maximum and minimum temperature changes, with significant correlations to drought and temperature extremes. Copula analysis indicates temperature extremes and drought severity are crucial in determining compound event probability and return periods. High-temperature–drought events are likely under high temperatures and mild drought, while low-temperature–drought events are more common under low temperatures and mild drought. These findings highlight the need for effective agricultural adaptation strategies to mitigate future climate change impacts.
Implications of changing climate for global wildland fire
[J].Wildland fire is a global phenomenon, and a result of interactions between climate–weather, fuels and people. Our climate is changing rapidly primarily through the release of greenhouse gases that may have profound and possibly unexpected impacts on global fire activity. The present paper reviews the current understanding of what the future may bring with respect to wildland fire and discusses future options for research and management. To date, research suggests a general increase in area burned and fire occurrence but there is a lot of spatial variability, with some areas of no change or even decreases in area burned and occurrence. Fire seasons are lengthening for temperate and boreal regions and this trend should continue in a warmer world. Future trends of fire severity and intensity are difficult to determine owing to the complex and non-linear interactions between weather, vegetation and people. Improved fire data are required along with continued global studies that dynamically include weather, vegetation, people, and other disturbances. Lastly, we need more research on the role of policy, practices and human behaviour because most of the global fire activity is directly attributable to people.
Joint analysis of drought and heat events during maize (Zea mays L.) growth periods using Copula and cloud models: A case study of Songliao Plain
[J].
A multivariate approach for statistical assessments of compound extremes
[J].
Perception of climate change
[J].
Increase in compound drought and heatwaves in a warming world
[J].
Do CMIP6 climate models simulate global or regional compound events skillfully?
[J].
Increasing frequency and spatial extent of concurrent meteorological droughts and heatwaves in India
[J].The impacts of concurrent droughts and heatwaves could be more serious compared to their individual occurrence. Meteorological drought condition is generally characterized by low rainfall, but impact of such an event is amplified with simultaneous occurrence of heatwaves. Positive feedback between these two extremes can worsen the rainfall deficit situation to serious soil moisture depletion due to enhanced evapotranspiration. In this study, the concurrence of meteorological droughts and heatwaves is investigated in India using Indian Meteorological Department (IMD) high resolution gridded data over a period of 60 years. Significant changes are observed in concurrent meteorological droughts and heatwaves defined at different percentile based thresholds and durations during the period 1981-2010 relative to the base period 1951-1980. There is substantial increase in the frequency of concurrent meteorological droughts and heatwaves across whole India. Statistically significant trends in the spatial extent of droughts are observed in Central Northeast India and West Central India; however, the spatial extent affected by concurrent droughts and heatwaves is increasing across whole India. Significant shifts are identified in the distribution of spatial extent of concurrent drought and heatwaves in India compared to the base period.
Climate change will accelerate the high-end risk of compound drought and heatwave events
[J].
Likelihood of compound dry and hot extremes increased with stronger dependence during warm seasons
[J].
Variations of compound precipitation and temperature extremes in China during 1961-2014
[J].
Spatial and temporal variations of compound droughts and hot extremes in China
[J].Droughts and hot extremes may lead to tremendous impacts on the ecosystem and different sectors of the society. A variety of studies have been conducted on the variability of the individual drought or hot extreme in China. However, the evaluation of compound droughts and hot extremes, which may induce even larger impacts than the individual drought or hot extreme, is still lacking. The aim of this study is to investigate changes in the frequency and spatial extent of compound droughts and hot extremes during summer in China using monthly precipitation and daily temperature data from 1953 to 2012. Results show that a high frequency of compound droughts and hot extremes mostly occur in the regions stretching from northeast to southwest of China. There is an overall increase in the frequency of co-occurrence of droughts and hot extremes across most parts of China with distinct regional patterns. In addition, an increasing trend in the areas covered by compound extremes has been observed, especially after the 1990s. At regional scales, the increase of the frequency and spatial extent of compound extremes has been shown to be most profound in North China (NC), South China (SC), and Southwest China (SWC), while the decrease of compound extremes was found in Central China (CC). These results show the variability of compound droughts and hot extremes and could provide useful insights into the mitigation efforts of extreme events in China.
Drought evolution, severity and trends in mainland China over 1961-2013
[J].
Comparisons of changes in compound dry and hot events in China based on different drought indicators
[J].
Evolution, severity, and spatial extent of compound drought and heat events in North China based on Copula model
[J].
A typology of compound weather and climate events
[J].

