

0 引言
山火是全球生态系统的重要干扰因素,对空气质量、生态环境、社会经济和公共安全造成深远且不可逆的影响。美国加利福尼亚州(简称“加州”)是全球山火最频发的地区之一,每年直接经济损失高达数十亿美元,防控费用可达30亿美元。2023年山火过火面积约33万英亩(约1 335 km2),造成4人死亡,157座建筑损毁;2024年“Park Fire”山火烧毁43万英亩(约1 740 km2)土地,成为加州北部第四大单体火灾;2025年初,洛杉矶发生特大型山火,经济损失估计超过2 500亿美元(Qiu et al., 2025)。这些事件表明,加州山火在规模与影响上依然保持高风险态势,需深入研究其时空分布特征、气候驱动机制与防控策略。
干旱被广泛认为是加州山火风险增加的关键驱动因素(Keeley and Syphard, 2016;Higuera and Abatzoglou, 2021),其通过改变植被含水量、提升燃料可燃性,进而影响山火的发生频率和规模(Abatzoglou and Williams, 2016;Westerling, 2016)。饱和水汽压差(Vapor Pressure Deficit,VPD)是衡量大气干燥度和植被水分状况的关键指标。研究表明,VPD与山火活动高度相关,尤其在夏末至秋季表现出显著的正相关(Williams et al., 2015;Brey et al., 2021)。VPD升高会加速燃料失水、提升植被可燃性,尤其会明显增强大型山火的发展潜力(Holden et al., 2018),同时也是未来极端火灾风险增加的重要气候信号(Goss et al., 2020)。降水对山火活动的影响具有两面性:充足的降水有助于植物生长,增加可燃物总量;降水短缺则会导致植被干燥、燃料堆积,从而增加山火风险(Keeley and Syphard, 2016)。Swain(2021)研究发现,加州秋季雨季延迟且时长缩短,明显增加了山火规模;Holden等(2018)指出,过去40 a美国西部夏季湿雨日数减少,延长了燃料的易燃期。标准化降水蒸散指数(Standardized Precipitation Evapotranspiration Index,SPEI)综合考虑了降水与潜在蒸散发量,是评估干旱程度及其对山火影响的常用指标。研究(Telesca and Lasaponara, 2025)发现,SPEI可有效反映区域燃料干燥程度,与烧毁面积和火险等级呈显著负相关。
气温、VPD、降水和SPEI是驱动加州山火规模变化的关键气候因子。然而,现有研究多侧重于年度或夏季气候因子对山火的影响,针对四季气候因子变化对山火影响的系统性分析仍较为缺乏。因此,本文基于长时间高分辨率火灾历史矢量数据和多源高分辨率气候数据集,分季节探讨高温和干旱条件下山火活动的时空响应特征,揭示干旱背景下山火规模持续扩大的潜在驱动因素,为理解加州山火成因机制及制定科学有效的防控策略提供理论支撑和数据依据。
1 研究区概况、资料与方法
1.1 研究区概况
加利福尼亚州(32°N—42°N,114°W—124°W)总面积约42.4万km2,地形差异显著,海拔从巴德沃特盆地(Badwater Basin)的-85 m,延伸至惠特尼峰(Mount Whitney)的4 421 m。大部分区域属北美地中海气候带(North American Monsoon Core Zone, NAMCZ)(Safford et al., 2022),表现为夏季炎热干燥、冬季凉爽湿润。受纬度与海拔差异影响,南北气候差异明显,全州年平均气温约11 ℃,冬季最低气温低于-12 ℃,东南部莫哈韦沙漠夏季气温常超45 ℃,年降水量40~3 000 mm且北部显著高于南部,冬季及早春降水充沛利于植被生长,但茂密植被也为山火提供了潜在燃料。
1.2 资料
1.2.1 山火数据
1984—2023年山火数据从加州森林及防火局(California Department of Forestry and Fire Protection,CAL FIRE)开放数据中心下载。本文剔除了有计划的燃烧,共纳入11 123条山火记录,数据包括开始时间、结束时间、烧毁原因、烧毁位置、过火面积。该文件没有包括加州持续时间过短和烧毁面积过小的山火。
1.2.2 气象要素及干旱数据
气象要素包括最高气温和降水量,来源于美国国家海洋和大气管理局(National Oceanic and Atmospheric Administration,NOAA)的月度美国气候网格数据集(NClimGrid),空间分辨率为4 000 m[(1/24)°×(1/24)°]。干旱数据包括最大饱和水汽压差(VPDmax)、最小饱和水汽压差(VPDmin)和标准化降水蒸散指数(SPEI),鉴于加州山火具有很强的季节性,本文将分季节研究1984—2023年气象要素变化与山火之间的关系。
1.2.3 其他数据
加州矢量边界数据来源于加州自然资源署(California Natural Resources Agency)下属的地理信息系统平台。加州森林覆盖矢量数据(Forest Cover Shapefile)源自美国森林局国家森林数据集。
运用加州森林覆盖矢量数据区分森林地区和非森林地区,用空间叠加分析方法,将气象要素和干旱数据与森林区边界进行空间裁剪,分别计算区域平均值及趋势变化,以探讨干旱对于森林山火的影响。
1.3 方法
1.3.1 数据处理方法
通过计算1984—2023年每年各季节的平均最高气温(Tmax)、VPDmax、VPDmin、降水量(P)、SPEI,分析加州气候趋势。将逐月数据聚合为冬(12月至次年2月)、春(3—5月)、夏(6—8月)、秋(9—11月)四季,构建季节尺度的时间序列,分析不同季节气候变量的变化趋势及其显著性。
1.3.2 变化趋势拟合方法
1.3.3 统计相关方法
2 结果分析
2.1 山火时空分布
2.1.1 山火时间变化
图1
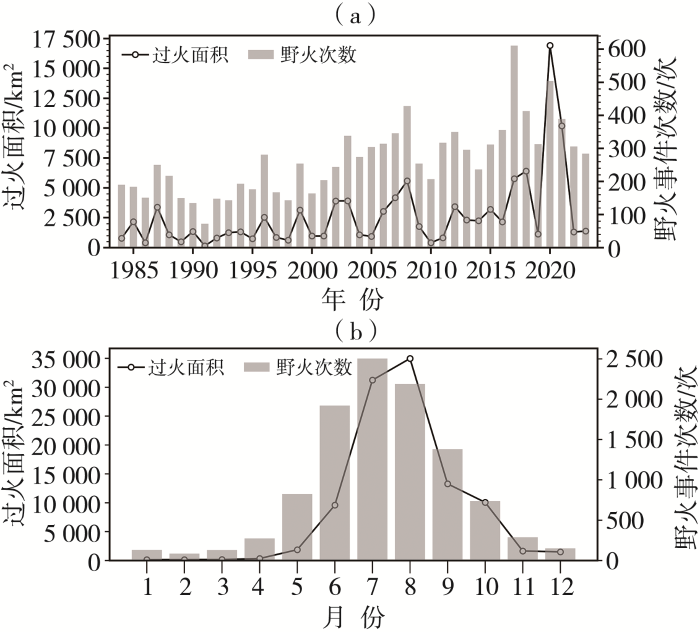
图1
1984—2023年加州山火过火面积与发生频次的年际(a)及月际(b)变化
Fig.1
The inter-annual (a), monthly (b) variation of burned area and occurrence frequency of wildfires in California from 1984 to 2023
2.1.2 山火季节变化
图2为1984—2023年加州四季山火发生频次及过火面积的年际变化。该地区山火活动具有明显的季节性规律,其中夏季与秋季共同构成山火的活跃期,即这两个季节山火发生频率较高。春季气温虽有所回升,但植被含水量较高,山火规模普遍较小。冬季气温低,湿度较大,山火数量和过火面积均处于全年最低水平。总体而言,近40 a加州山火频次和过火面积均呈现出显著的增长趋势。
图2
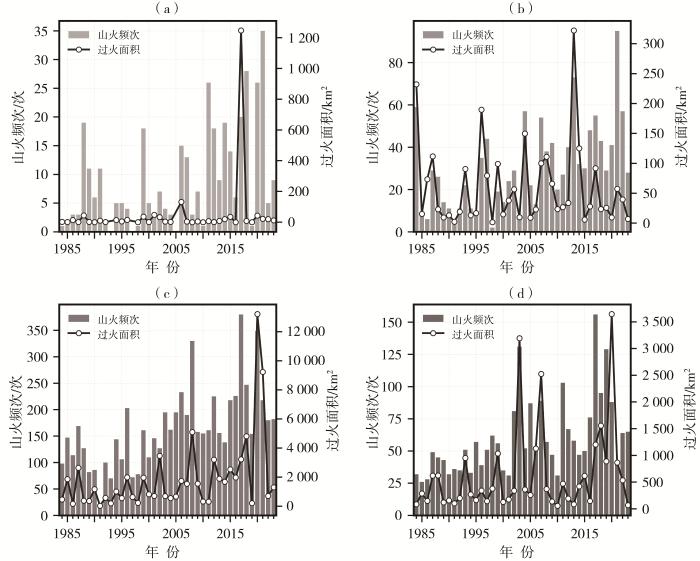
图2
1984—2023年不同季节加州山火过火面积与发生频次的年际变化
(a)冬季,(b)春季,(c)夏季,(d)秋季
Fig.2
The inter-annual variation of burned area and occurrence frequency of wildfires in California in different seasons from 1984 to 2023
(a) winter, (b) spring, (c) summer, (d) autumn
2.1.3 山火空间分布
图3为1984—2023年加州平均山火过火面积空间分布。可以看出,1984—2023年加州的山火主要集中在南部的横断山脉(Transverse Ranges)、西部的海岸山脉(Coast Ranges)、以及北部的南喀斯喀特山脉(South Cascade Range)、克拉马斯山脉(Klamath Mountains)和莫多克高原(Modoc Plateau)。与之形成鲜明对比的是,萨克拉门托谷地(Sacramento Valley)、圣华金谷地(San Joaquin Valley)、莫哈韦沙漠(Mojave Desert)和索诺兰沙漠(Sonoran Desert)山火活动极少,几乎可忽略不计。
图3
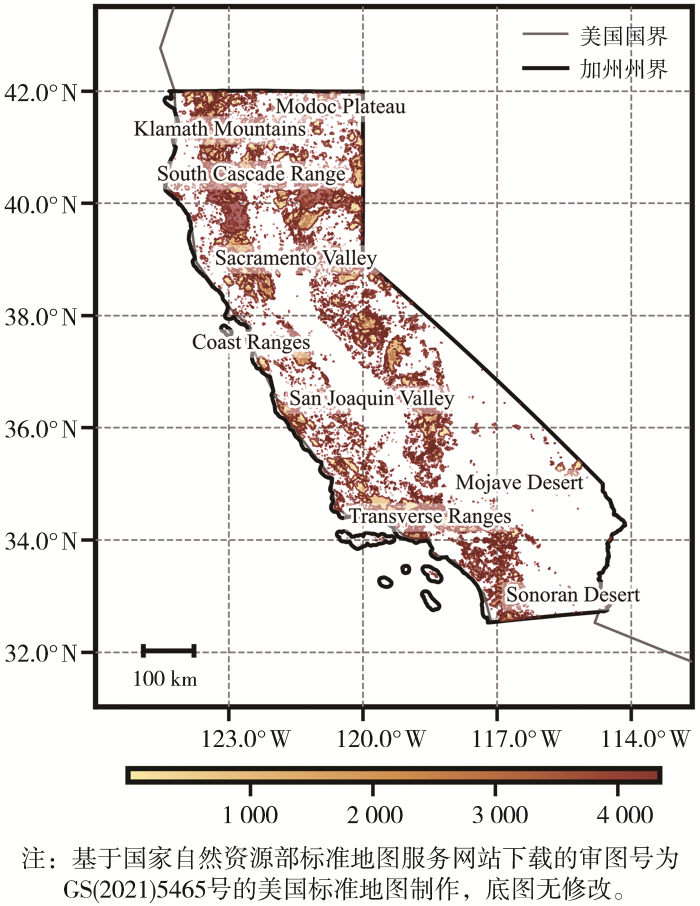
图3
1984—2023年加州平均山火过火面积空间分布(单位:km2)
Fig.3
Spatial distribution of average burned area of wildfires in California from 1984 to 2023 (Unit: km2)
2.2 高温和干旱对山火的影响
2.2.1 最高气温
图4
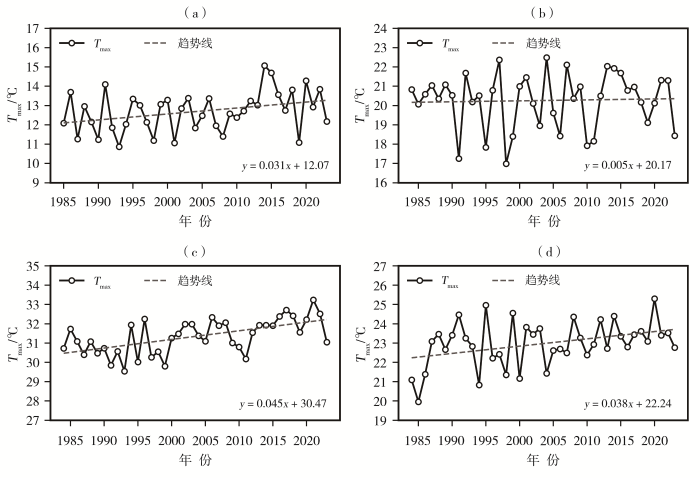
图4
1984—2023年不同季节加州最高气温年际变化
(a)冬季,(b)春季,(c)夏季,(d)秋季
Fig.4
The inter-annual variation of Tmax in California in different seasons from 1984 to 2023
(a) winter, (b) spring, (c) summer, (d) autumn
图5
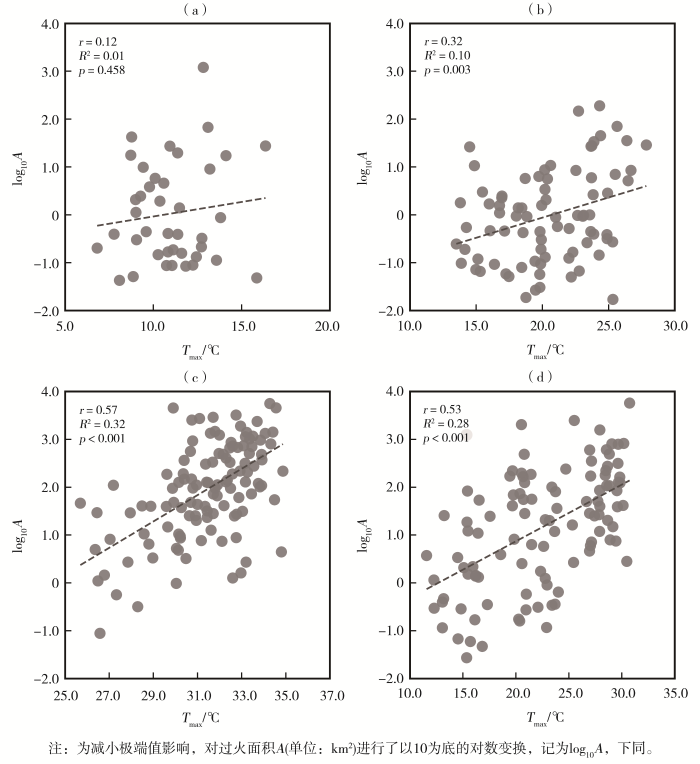
图5
1984—2023年不同季节加州最高气温与log10A的关系
(a)冬季,(b)春季,(c)夏季,(d)秋季
Fig.5
Relationship between maximum temperature and log10A in California in different seasons from 1984 to 2023
(a) winter, (b) spring, (c) summer, (d) autumn
2.2.2 最大饱和水汽压差
图6
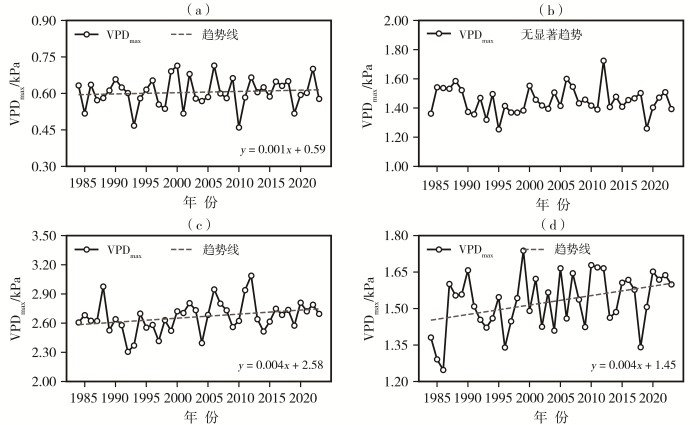
图6
1984—2023年不同季节加州最大饱和水汽压差年际变化
(a)冬季,(b)春季,(c)夏季,(d)秋季
Fig.6
The inter-annual variation of VPDmax in California in different seasons from 1984 to 2023
(a) winter, (b) spring, (c) summer, (d) autumn
图7
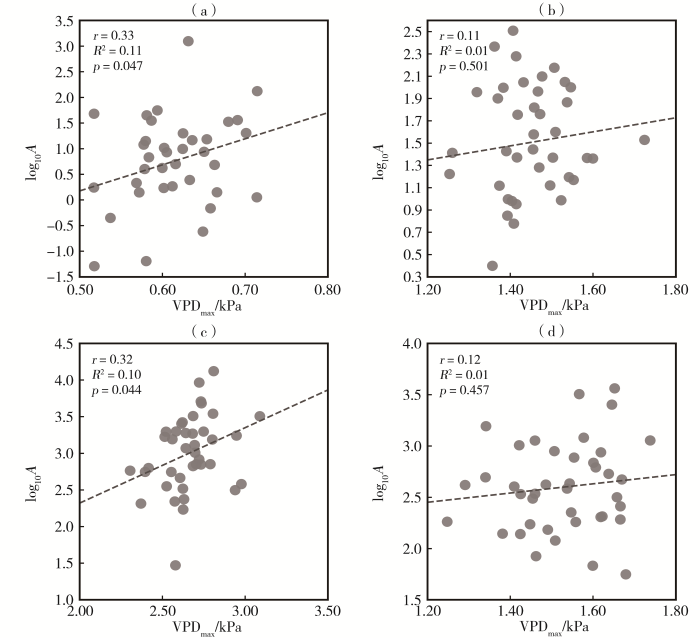
图7
1984—2023年不同季节加州最大饱和水汽压差与log10A过火面积的关系
(a)冬季,(b)春季,(c)夏季,(d)秋季
Fig.7
Relationship betweenVPDmax and log10A in California in different seasons from 1984 to 2023
(a) winter, (b) spring, (c) summer, (d) autumn
2.2.3 最小饱和水汽压差
VPDmin的变化趋势与VPDmax类似,夏季VPDmin最高,春季和秋季次之,冬季最低。夏季、秋季VPDmin呈上升趋势,变化速率分别为0.002、0.001 kPa·a-1(图8)。加州VPDmin与过火面积相关性(图9)分析表明,夏季、春季和冬季过火面积与VPDmin均有显著正相关,相关系数分别为0.50(p<0.01)、0.43(p<0.01)、0.34(p<0.05),表明即便在一天中湿度最高的时段,燃料仍旧难以恢复水分,山火风险持续存在。秋季,VPDmin与过火面积相关性不显著,日最低干燥条件对秋季山火规模影响有限。对比以前的研究结果,Juang等(2022)发现,即便在湿度最高的时段,高VPDmin也意味着燃料水分无法有效恢复,延长高火险期,日最低干燥度对植被含水量的影响可能被低估。本文分析与这些发现基本一致,强调了VPDmin作为山火风险评估指标的潜力。
图8

图8
1984—2023年不同季节加州最小饱和水汽压差年际变化
(a)冬季,(b)春季,(c)夏季,(d)秋季
Fig.8
The inter-annual variation of VPDmin in California in different seasons from 1984 to 2023
(a)winter, (b) spring, (c) summer, (d) autumn
图9
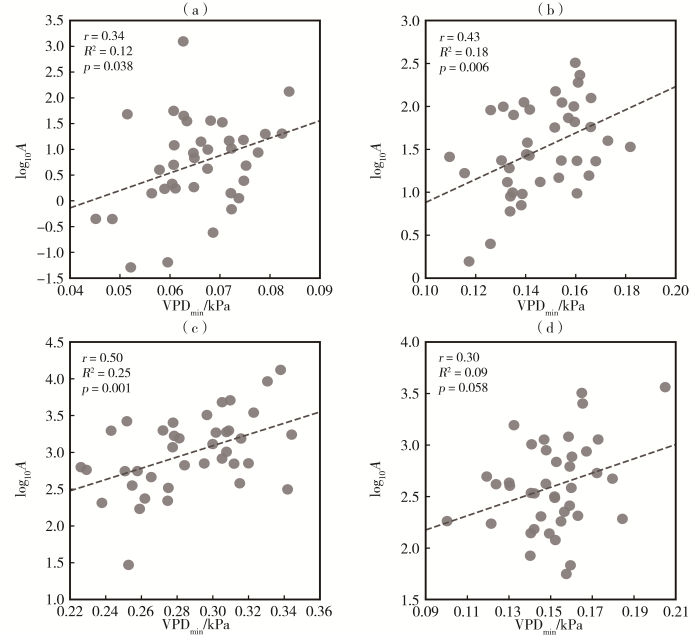
图9
1984—2023年不同季节加州最小饱和水汽压差与log10A的关系
(a)冬季,(b)春季,(c)夏季,(d)秋季
Fig.9
Relationship between VPDmin and log10A in California in different seasons from 1984 to 2023
(a) winter, (b) spring, (c) summer, (d) autumn
2.2.4 降水量与SPEI
图10、图11分别为1984—2023年不同季节加州降水量、SPEI年际变化。可以看出,加州夏季降水量最少,秋季和春季次少,冬季最多。降水量和SPEI在季节维度上的变化趋势均不显著。然而,夏季、春季及冬季,加州SPEI与过火面积之间呈现出显著的负相关关系(夏季p<0.001、春季p<0.01、冬季p<0.05)(图12)。SPEI作为综合考虑温度和降水的干旱指标,已被多项研究证实与山火活动有关(Dennison et al., 2014;Abatzoglou et al., 2021)。干旱通过降低植被含水量和改变燃料结构间接增加山火风险(Dennison et al., 2014)。此外,加州不同季节降水量与过火面积的相关性均不显著(图略)。Littell等(2009)提出,降水对山火的影响往往滞后数月,且在燃料不受限制的区域作用有限。本文的结果进一步支持这一观点,即仅依靠季节性降水量,难以将其作为山火风险的有效预测因子。
图10

图10
1984—2023年不同季节加州降水量年际变化
(a)冬季,(b)春季,(c)夏季,(d)秋季
Fig.10
The inter-annual variation of precipitation in California in different seasons from 1984 to 2023
(a) winter, (b) spring, (c) summer, (d) autumn
图11
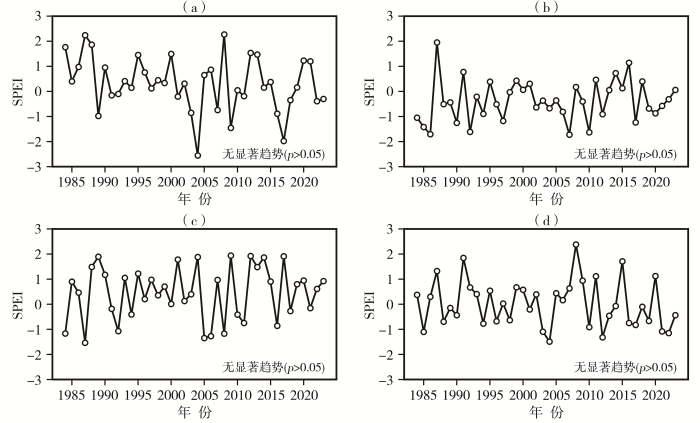
图11
1984—2023年不同季节加州标准化降水蒸散指数年际变化
(a)冬季,(b)春季,(c)夏季,(d)秋季
Fig.11
The inter-annual variation of SPEI in California in different seasons from 1984 to 2023
(a)winter, (b) spring, (c) summer, (d) autumn
图12

图12
1984—2023年不同季节加州标准化降水蒸散指数与log10A的关系
(a)冬季,(b)春季,(c)夏季,(d)秋季
Fig.12
Relationship between SPEI and log10A in California in different seasons from 1984 to 2023
(a) winter, (b) spring, (c) summer, (d) autumn
2.3 高温和干旱因子综合影响分析
图13为基于随机森林回归的1984—2023年不同季节加州气候因子对过火面积的相对重要性。可以看出,气候因子对过火面积的重要性,随季节变化存在明显差异。春季与秋季,VPDmax、VPDmin和Tmax的贡献明显较高,均在22.0%以上,表明气温及饱和水汽压差在这两个季节对燃料干燥度和山火规模的影响较为显著。夏季Tmax、VPDmax和VPDmin同样占据主导地位,但整体OOB R²仅为0.16,说明虽然模型识别出这些因子的重要性,但其对过火面积的解释力有限。冬季降水量、SPEI和VPDmax的重要性虽均超过20.0%,但冬季OOB R²为-0.21,表明冬季气候因子几乎无法有效解释过火面积变化,推测非气候驱动因素(如人类活动、燃料可燃性等)可能更为关键。
图13
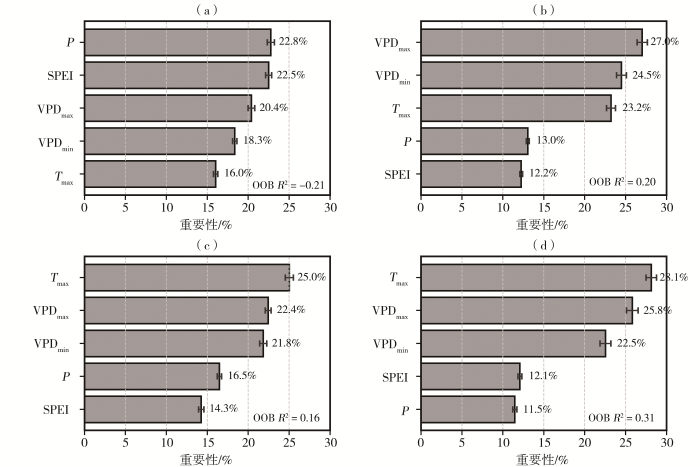
图13
基于随机森林回归的1984—2023年不同季节加州气象因子对过火面积的相对重要性
(a)冬季,(b)春季,(c)夏季,(d)秋季
(误差棒表示20次重复训练的重要性标准差,OOB R²为袋外样本在未见数据上的决定系数)
Fig.13
Relative importance of meteorological factors on burned area in California in different seasons from 1984 to 2023 based on random forest regression
(a) winter, (b) spring, (c) summer, (d) autumn
(Error bars denote the standard deviation of importance across 20 repeated runs, OOB R² represents the coefficient of determination calculated using out-of-bag samples on unseen data)
3 讨论
在气候因子的影响上,Tmax与过火面积的显著正相关说明气温升高加速了燃料干燥过程,增强了其可燃性。Williams等(2019)、Abatzoglou和Williams(2016)研究发现,高温通过加速燃料干燥、增加植被可燃性,进而驱动山火规模扩大;Holden等(2018)证实美国西部山火活动与Tmax异常密切相关。这与本文研究结果高度一致,说明加州夏、秋两季山火对气温升高尤为敏感。VPDmax和VPDmin的上升同样反映空气干燥程度增强,是山火频发的重要气候背景。在季节尺度上,夏秋两季VPD与山火关系紧密,而冬春两季受降水和湿度的影响,VPD与山火的关联程度明显较弱。Holden等(2018)指出,VPD升高加速燃料失水,使山火易于蔓延;Goss等(2020)强调VPD上升是极端火灾频发的重要信号,这与本文研究结果基本一致。此外,Tmax和VPD的同步上升表明,加州山火频次和规模的增长并非单一气象因子作用的结果,而是高温与干旱的协同效应。高温导致植被含水量下降,与此同时,VPD升高会进一步抑制燃料湿度恢复,使燃料长时间维持高可燃性状态。尤其在夏、秋两季,这种干燥累积效应使火险等级持续升高。
通过随机森林模型分析表明,Tmax、VPDmax和VPDmin在主要山火季节中的综合贡献率最高,表明干热条件对山火的触发与维持具有核心作用。整体来看,气候对山火的影响具有很强的季节性,高温和大气干燥度在春、夏、秋三季均为主要驱动因子,而湿润度指标(P、SPEI)在冬季作用相对更突出,但各季节模型解释力差异明显。夏季和秋季是加州山火最频繁的季节,Tmax、VPDmax和VPDmin的持续上升是加州夏季山火规模扩大的主要气候驱动。秋季气象因子的变化趋势虽与过火面积相关,但相关性较弱且异常年份较多,暗示火灾规模还可能受其他因素影响,例如风速、植被类型、燃料负荷和人为因素等(Keeley and Syphard, 2016;李丹等,2021)。
通过整合长期火灾记录与高分辨率气候数据,本文系统揭示了加州山火与气候干旱要素的关系,为理解气候变化背景下山火规模扩大的驱动机制提供了重要科学依据。研究结果对于优化火灾风险预测、提升防灾减灾能力和制定区域适应性管理策略具有重要参考价值。但研究仍存在一定局限性。网格化数据仍难以精准模拟加州各地实际天气条件与气候趋势。此外,研究主要关注山火分布格局与加州整体气候变化的关系,但考虑到该州纬度跨度大、气候类型多样,内部存在显著的空间异质性,未来研究需进一步深入分析不同气候区山火活动及其气候驱动特征。研究揭示了干旱对山火频次和规模扩张的显著作用,但气候因素并非孤立发挥影响。风速、风向、燃料可燃性、点火源等自然因素,以及人口增长、城市扩张等人类活动,同样对山火行为产生重要影响(李明星等,2025)。这些非气候因素可能干扰甚至掩盖气候变化对山火的真实效应,增加了精确评估其相对贡献的复杂性。未来研究应结合高分辨率气候数据、燃料特征、风场模拟及社会经济因素,探索多因子对山火动态的综合影响,并建立精准的火灾风险评估体系。
4 结论
本文基于1984—2023年山火历史矢量数据和多源气象数据,系统分析了加州山火的时空分布特征及其与干旱的关系,得到以下主要结论。
(1)1984—2023年,加州山火发生频次与过火面积均呈明显上升趋势。山火活动具有明显的季节性,其中夏季和秋季山火活跃程度最高。空间分布上,山火主要集中于地形复杂的南部横断山脉、西部海岸山脉,以及北部的南喀斯喀特山脉、克拉马斯山脉和莫多克高原等区域,谷地与沙漠地区山火活动明显较弱,地形和植被覆盖是控制山火空间分布的重要基础条件。
(2)气象要素对山火的影响具有很强的季节性。夏季Tmax、VPDmax和VPDmin与过火面积均呈显著正相关,表明高温和大气干燥度是驱动加州山火频发与规模扩大的主要气象因素。Tmax与VPD的同步升高表明,山火的频次和强度增加源于高温与干旱的协同作用,高温加速燃料干燥,而VPD升高抑制燃料水分恢复,使干热条件得以持续累积。
(3)随机森林模型分析进一步验证了高温和干旱在主要山火季节中的主导作用,Tmax、VPDmax和VPDmin在各气候要素中贡献率最高,但模型解释力存在明显季节差异。
参考文献
干旱半干旱区中小流域洪水机器学习预警模型及其应用
[J].
由于对地形地貌特征、临界雨量、汇流时间和重现期等洪水特征因子的认识不足,干旱半干旱地区中小流域的洪水预报准确率有待提高。因此,本文选取甘肃省夏河县(位于半干旱区)和永昌县(位于干旱区)为研究对象,对夏河县(2015年)86个沿河村落的34个小流域和永昌县(2014年)395个沿河村落的240个过水断面的洪水特征要素进行了野外调查,并采用“铁一院”法、瞬时单位线法和地区经验公式法计算了两个区域的汇流时间、设计暴雨和设计洪水,推算了洪水预警值。然后基于计算结果,采用机器学习方法(线性回归、随机森林和神经网络),建立了针对干旱和半干旱地区的洪水预警模型,并对各模型进行了评价分析。结果表明,准备转移雨量与暴雨时程分配、临界雨量和主沟比降之间存在线性相关性,且线性回归模型能较准确地计算预警降雨量。为进一步验证回归模型适用性,使用该模型反演分析甘肃省合作市34个调查流域的准备转移雨量,平均绝对误差仅为0.56 mm。
基于机器学习的湖北省夏季干旱预测模型构建与检验
[J].为构建准确的干旱预测模型,选择具有物理意义的预测因子和采用高效的预测方法至关重要。与传统预测技术相比,机器学习算法因其高效性和可靠性,在气候预测中被广泛应用。本文基于1960—2022年湖北省70个国家气象站逐月气象要素数据,以及国家气候中心与美国国家海洋和大气管理局提供的大气环流和海温指数,采用标准化降水蒸散指数判断是否干旱作为目标变量,运用特征选择方法筛选出11个指数作为输入变量。在此基础上,分别使用分类回归树和随机森林两种机器学习算法,构建了湖北省夏季干旱预测模型。随机选取47 a数据作为训练集,并利用剩余16 a数据作为测试集,对预测结果进行检验。结果表明,分类回归树和随机森林模型对干旱是否发生的预测准确率分别为88%和81%。此外,两种算法建模时均将亚洲纬向环流指数列为最重要的变量,表明该指数在湖北省夏季干旱预测中具有关键作用。通过构建两种机器学习算法预测模型,为湖北省夏季干旱预测提供了客观有效的新思路,对湖北省防旱减灾具有重要意义。
Projected increases in western US forest fire despite growing fuel constraints
[J].
Impact of anthropogenic climate change on wildfire across western US forests
[J].
Past variance and future projections of the environmental conditions driving western U.S. summertime wildfire burn area
[J].
Large wildfire trends in the western United States, 1984-2011
[J].
Climate change is increasing the likelihood of extreme autumn wildfire conditions across California
[J].California has experienced devastating autumn wildfires in recent years. These autumn wildfires have coincided with extreme fire weather conditions during periods of strong offshore winds coincident with unusually dry vegetation enabled by anomalously warm conditions and late onset of autumn precipitation. In this study, we quantify observed changes in the occurrence and magnitude of meteorological factors that enable extreme autumn wildfires in California, and use climate model simulations to ascertain whether these changes are attributable to human-caused climate change. We show that state-wide increases in autumn temperature (∼1 °C) and decreases in autumn precipitation (∼30%) over the past four decades have contributed to increases in aggregate fire weather indices (+20%). As a result, the observed frequency of autumn days with extreme (95th percentile) fire weather—which we show are preferentially associated with extreme autumn wildfires—has more than doubled in California since the early 1980s. We further find an increase in the climate model-estimated probability of these extreme autumn conditions since ∼1950, including a long-term trend toward increased same-season co-occurrence of extreme fire weather conditions in northern and southern California. Our climate model analyses suggest that continued climate change will further amplify the number of days with extreme fire weather by the end of this century, though a pathway consistent with the UN Paris commitments would substantially curb that increase. Given the acute societal impacts of extreme autumn wildfires in recent years, our findings have critical relevance for ongoing efforts to manage wildfire risks in California and other regions.
Record-setting climate enabled the extraordinary 2020 fire season in the western United States
[J].
Decreasing fire season precipitation increased recent western US forest wildfire activity
[J].
Rapid growth of large forest fires drives the exponential response of annual forest-fire area to aridity in the western United States
[J].
Climate change and future fire regimes: Examples from California
[J].Climate and weather have long been noted as playing key roles in wildfire activity, and global warming is expected to exacerbate fire impacts on natural and urban ecosystems. Predicting future fire regimes requires an understanding of how temperature and precipitation interact to control fire activity. Inevitably this requires historical analyses that relate annual burning to climate variation. Fuel structure plays a critical role in determining which climatic parameters are most influential on fire activity, and here, by focusing on the diversity of ecosystems in California, we illustrate some principles that need to be recognized in predicting future fire regimes. Spatial scale of analysis is important in that large heterogeneous landscapes may not fully capture accurate relationships between climate and fires. Within climatically homogeneous subregions, montane forested landscapes show strong relationships between annual fluctuations in temperature and precipitation with area burned; however, this is strongly seasonal dependent; e.g., winter temperatures have very little or no effect but spring and summer temperatures are critical. Climate models that predict future seasonal temperature changes are needed to improve fire regime projections. Climate does not appear to be a major determinant of fire activity on all landscapes. Lower elevations and lower latitudes show little or no increase in fire activity with hotter and drier conditions. On these landscapes climate is not usually limiting to fires but these vegetation types are ignition-limited. Moreover, because they are closely juxtaposed with human habitations, fire regimes are more strongly controlled by other direct anthropogenic impacts. Predicting future fire regimes is not rocket science; it is far more complicated than that. Climate change is not relevant to some landscapes, but where climate is relevant, the relationship will change due to direct climate effects on vegetation trajectories, as well as by feedback processes of fire effects on vegetation distribution, plus policy changes in how we manage ecosystems.
Climate and wildfire area burned in western U.S. ecoprovinces, 1916-2003
[J].The purpose of this paper is to quantify climatic controls on the area burned by fire in different vegetation types in the western United States. We demonstrate that wildfire area burned (WFAB) in the American West was controlled by climate during the 20th century (1916–2003). Persistent ecosystem‐specific correlations between climate and WFAB are grouped by vegetation type (ecoprovinces). Most mountainous ecoprovinces exhibit strong year‐of‐fire relationships with low precipitation, low Palmer drought severity index (PDSI), and high temperature. Grass‐ and shrub‐dominated ecoprovinces had positive relationships with antecedent precipitation or PDSI. For 1977–2003, a few climate variables explain 33–87% (mean = 64%) of WFAB, indicating strong linkages between climate and area burned. For 1916–2003, the relationships are weaker, but climate explained 25–57% (mean = 39%) of the variability. The variance in WFAB is proportional to the mean squared for different data sets at different spatial scales. The importance of antecedent climate (summer drought in forested ecosystems and antecedent winter precipitation in shrub and grassland ecosystems) indicates that the mechanism behind the observed fire–climate relationships is climatic preconditioning of large areas of low fuel moisture via drying of existing fuels or fuel production and drying. The impacts of climate change on fire regimes will therefore vary with the relative energy or water limitations of ecosystems. Ecoprovinces proved a useful compromise between ecologically imprecise state‐level and localized gridded fire data. The differences in climate–fire relationships among the ecoprovinces underscore the need to consider ecological context (vegetation, fuels, and seasonal climate) to identify specific climate drivers of WFAB. Despite the possible influence of fire suppression, exclusion, and fuel treatment, WFAB is still substantially controlled by climate. The implications for planning and management are that future WFAB and adaptation to climate change will likely depend on ecosystem‐specific, seasonal variation in climate. In fuel‐limited ecosystems, fuel treatments can probably mitigate fire vulnerability and increase resilience more readily than in climate‐limited ecosystems, in which large severe fires under extreme weather conditions will continue to account for most area burned.
The rising threats of wildland-urban interface fires in the era of climate change: The Los Angeles 2025 fires
[J].
The 2020 California fire season: A year like no other, a return to the past or a harbinger of the future?
[J].
Observed changes in extreme wet and dry spells during the south Asian summer monsoon season
[J].
A shorter, sharper rainy season amplifies California wildfire risk
[J].
Integrated investigation of the time dynamics of forest fire sequences in Basilicata Region (southern Italy)
[J].The time fluctuations of forest fires occurring in Basilicata, a region situated in Southern Italy, between 2004 and 2023 were investigated using various analytical approaches. Analysis revealed a clustering of fire occurrences over time, as indicated by a significantly high coefficient of variation. This suggests that the fire sequence does not follow a Poisson distribution and instead exhibits a clustered structure, largely driven by the heightened frequency of events during the summer seasons. The analysis of monthly forest fire occurrences and total burned area indicates a significant correlation between the two. This correlation is reinforced by shared patterns, notably an annual cycle that appears to be influenced by meteorological factors, aligning with the yearly fluctuations in the region’s weather conditions typical of a Mediterranean climate. Furthermore, the relationship between the Standardized Precipitation Evapotranspiration Index (SPEI) and forest fires revealed that the accumulation period of the SPEI corresponds to the cycle length of the fires: longer cycles in fire occurrences align with higher accumulation periods in SPEI data.
Increasing western US forest wildfire activity: Sensitivity to changes in the timing of spring
[J].
Observed impacts of anthropogenic climate change on wildfire in California
[J].Recent fire seasons have fueled intense speculation regarding the effect of anthropogenic climate change on wildfire in western North America and especially in California. During 1972–2018, California experienced a fivefold increase in annual burned area, mainly due to more than an eightfold increase in summer forest‐fire extent. Increased summer forest‐fire area very likely occurred due to increased atmospheric aridity caused by warming. Since the early 1970s, warm‐season days warmed by approximately 1.4 °C as part of a centennial warming trend, significantly increasing the atmospheric vapor pressure deficit (VPD). These trends are consistent with anthropogenic trends simulated by climate models. The response of summer forest‐fire area to VPD is exponential, meaning that warming has grown increasingly impactful. Robust interannual relationships between VPD and summer forest‐fire area strongly suggest that nearly all of the increase in summer forest‐fire area during 1972–2018 was driven by increased VPD. Climate change effects on summer wildfire were less evident in nonforested lands. In fall, wind events and delayed onset of winter precipitation are the dominant promoters of wildfire. While these variables did not change much over the past century, background warming and consequent fuel drying is increasingly enhancing the potential for large fall wildfires. Among the many processes important to California's diverse fire regimes, warming‐driven fuel drying is the clearest link between anthropogenic climate change and increased California wildfire activity to date.

