

0 引言
山火是在自然环境中快速蔓延的火灾现象,不仅直接破坏生物多样性(Hernandez et al., 2015)、加剧水土流失、释放大量有害污染物,还会带来建筑损坏、相关产业受冲击及生态恢复投入大等严重经济损失(Thompson and Spies, 2009; Galanis et al., 2021)。随着全球气候变化,全球变暖导致区域性极端高温干旱频发,增加了山火风险(Running, 2006; Jolly et al., 2015);另一方面,山火又会释放温室气体,加剧温室效应,形成山火和气候变化的恶性循环(吴东佑,2024)。在气候变暖的情况下,美国西南部、巴西高地和阿拉伯岛屿的干旱地区面临更高的山火风险,燃烧面积更大,碳排放量更多(Peng et al., 2023)。
山火燃烧需要天气干燥、有可燃物且有火源(Moritz et al., 2005; Dong et al., 2021);其中,气象条件是最重要的自然因素,影响山火的气象要素主要包括气温、湿度和风(Girardin and Wotton, 2009; Freeborn et al., 2016)。气温是影响山火的最关键因素,持续性高温可加速可燃物的水分蒸发,降低其含水量(彭道福等,2023)。相对湿度与可燃物含水量之间存在非线性关系,当环境相对湿度低于临界值时,地表枯落物含水率会迅速下降至易燃区间(胡海清等,2016)。风则是山火蔓延的核心驱动力,风速较大会加速氧气输送,使得山火燃烧更加剧烈。研究表明,日最高气温高于30 ℃、相对湿度小于30%、风速超过2.5 m·s-1是加州山火爆发的阈值,当气温、湿度和风速突破阈值后,火险等级呈指数级上升(Mass and Ovens, 2019)。
大尺度环流异常是导致地面气象要素异常的主要因素(王健疆等,2021;李忆平等,2022),直接影响山火事件的概率(Pollina et al., 2013; Pachalidou and Kassomenos, 2016),美国西部500 hPa高度场异常偏高会额外增加加州地区的下沉辐散气流,导致降水减少(田永丽和王秋华,2019),进而增加山火爆发风险。海温是大气环流异常的主要强迫源,特别是厄尔尼诺-南方涛动(El Niño-Southern Oscillation,ENSO)事件通过强迫大气环流影响气候尺度降水、温度和干旱(郝立生等,2023),增加山火爆发的风险、频率和山火面积,极端厄尔尼诺事件造成了全球多个地区山火事件频发(周煜,2022)。
2024年7月24日,美国加利福尼亚州(简称“加州”)北部突发大规模山火(“帕克大火”),在极端高温和强风的推动下迅速发展,成为2024年加州规模最大、破坏力最强的山火事件之一。截至8月8日,山火控制范围达到全州的34%。这场山火已跻身加州历史第四大火灾,过火面积达1 709平方公里,超过洛杉矶市面积。帕克大火的核心区域植被类型复杂多样,具有高度易燃性,属于易燃植被(橡树-草原-灌丛)、崎岖地形(峡谷-熔岩流)与极端气候(干旱-强风)组合。
气象条件是山火爆发的关键驱动因子,大尺度环流和海温异常对区域气候的影响已有大量研究,但在全球变暖背景下,极端事件频发、强度加剧。针对2024年7月加州“帕克大火”这一破坏性极强的特大山火事件,其爆发的具体气象阈值、异常环流形势及厄尔尼诺事件如何通过跨季节尺度远程影响区域干旱和同期热力条件,仍需要进一步深入研究。因此,本文基于多源数据融合方法,使用干旱程度和面积指数、再分析资料及海温数据集,分析了2024年7月24日美国加州山火爆发的气象条件及成因,以期揭示极端山火事件背后的多尺度气象驱动机制,并为未来高风险地区山火预警与防灾减灾提供科学依据。
1 研究区概况、资料及方法
1.1 研究区域概况
图1

图1
美国加利福尼亚州州界范围(黑色实线)及地形(填色,单位:m)
(红色圆点为起火点)
Fig.1
State boundary (black solid line) and topography (the color shaded, Unit: m) of California, USA
(The red dot marks the wildfire ignition point)
1.2 数据
1.2.1 干旱程度和面积指数数据
干旱程度和面积指数(Drought Severity and Coverage Index,DSCI)是一种用于量化区域干旱严重程度和空间覆盖范围的综合指数,其将每周美国干旱监测的强度类别转换为一个单一的值,该值考虑了一个地区(县、气候部门、气候区域、国家气象局区域、河流预报中心区域、城市地区以及美国农业部气候中心区域)的干旱面积和程度,便于跨区域和时间段的比较,在美国具有较好的适用性(Kuwayama et al., 2019)。
1.2.2 再分析数据
使用2024年4—10月欧洲中期天气预报中心(European Centre for Medium-Range Weather Forecasts, ECMWF)发布的第五代再分析资料ERA5(ECMWF Reanalysis v5),主要包括单层逐日格点数据(降水量、气温、露点温度及相对湿度)及ERA5垂直气压层的500 hPa和700 hPa位势高度和水汽数据。经验证,ERA5被公认为当前全球范围内精度较高、信息较全面的大气再分析数据集之一,广泛应用于气候研究、气象分析和环境监测(Muñoz-sabater et al., 2021)。
1.2.3 海温数据
利用美国国家海洋和大气管理局(National Oceanic and Atmospheric Administration,NOAA)下属国家环境信息中心开发的扩展重建海表温度(Sea Surface Temperature, SST)数据集第五版(Extended Reconstructed Sea Surface Temperature,ERSST V5),该数据集是当前全球海温研究领域的核心基础数据之一(Huang et al., 2017)。ERSST常用于分析Niño 3.4区海温异常和监测ENSO状态,被广泛应用于气候预测等(颜鹏程等,2024)。本文使用2024年1—8月逐月海温数据,水平分辨率为2.0°×2.0°,分析了Niño 3.4区(5°S—5°N,170°W—120°W)海温异常。
1.2.4 气溶胶光学厚度数据
气溶胶光学厚度(Aerosol Optical Depth, AOD)是量化大气中气溶胶颗粒对太阳光衰减能力的关键参数,反映了气溶胶浓度及污染程度,广泛用于空气质量监测、气候效应评估及灾害事件(如火山喷发、山火烟雾)的动态追踪。本文使用的AOD数据源自美国中分辨率成像光谱仪(Moderate-resolution Imaging Spectroradiometer,MODIS)的遥感观测产品,空间分辨率为10 km。MODIS AOD产品在全球范围内经过了长期、大规模的地面站点观测验证,具备较高的精度和可靠性;同时,10 km空间分辨率能够满足区域尺度气溶胶研究的需求,适用于相关分析工作(He et al., 2017)。
1.3 方法
干旱程度和面积指数(DSCI)不仅包含干旱强度和覆盖范围,还纳入了特定时段内干旱的累积持续时间,能够生成一个可表征干旱整体状况的单一汇总统计数据,为干旱评估提供简洁且全面的量化依据(Martin et al., 2020)。DSCI的计算综合了多种观测数据(降水、土壤湿度、径流、遥感等)和数值模式数据,是美国官方干旱监测的核心产品,且计算公式严格依据美国干旱监测(United States Drought Monitor, USDM)的官方定义,具体计算公式如下:
式中:D0、D1、D2、D3、D4分别代表轻度干旱、中度干旱、严重干旱、极端干旱、异常干旱;1、2、3、4、5分别为不同等级干旱的权重系数。DSCI值的大小直接反映了区域整体干旱的严重程度和范围,其取值范围为0~500,其中0表示无干旱,500表示整个区域处于极端干旱,DSCI值越大表明干旱越严重且影响范围越广。
在实际应用中,DSCI指数已在干旱监测、农业管理、水资源评估及山火监测等领域得到广泛应用(Smith et al., 2020)。
2 结果分析
2.1 大气环流异常对山火发生的影响
大尺度环流对山火爆发的影响不可忽视。为有效滤除高频天气尺度噪声,同时凸显次季节尺度的持续异常信号,文中分析采用了5 d滑动平均处理。图2为加州山火爆发前(2024年6月29日—7月23日)逐5 d 500 hPa平均位势高度场和温度场与1991—2020年气候态差值的空间分布。自2024年6月底起[图2(a)],北美西海岸开始出现正位势高度异常中心,数值较气候态偏高2~4 dagpm,覆盖加利福尼亚州西部地区,副热带高压脊初步发展但强度尚弱,同期该区域出现500 hPa温度暖异常。7月4—8日[图2(b)],位势高度正异常范围显著扩大,覆盖加州全境,同时暖异常区域扩展,加州500 hPa温度较气候态偏高2~3 ℃。7月9—13日[图2(c)],正异常进一步强化并形成闭合高压中心,加州北部地区升温加剧。7月14—18日[图2(d)],加州北部的正位势高度异常维持在4~8 dagpm,500 hPa温度显著偏高3~4 ℃,表明高压脊进一步发展并持续控制该区域。7月19—23日[图2(e)]是山火爆发前最后阶段,正位势高度异常依然维持在这一高位区间,高压稳定且控制范围较大,同期500 hPa暖异常依旧持续,高温与干燥状况进一步加剧,为山火爆发提供了极为有利的气象条件。2024年7月下旬北美加州山火发生前,异常强大且稳定的副热带高压通过抑制降水、加剧高温、增强风力及维持干旱等多重机制,共同形成了极为有利于山火爆发的大气环境。
图2
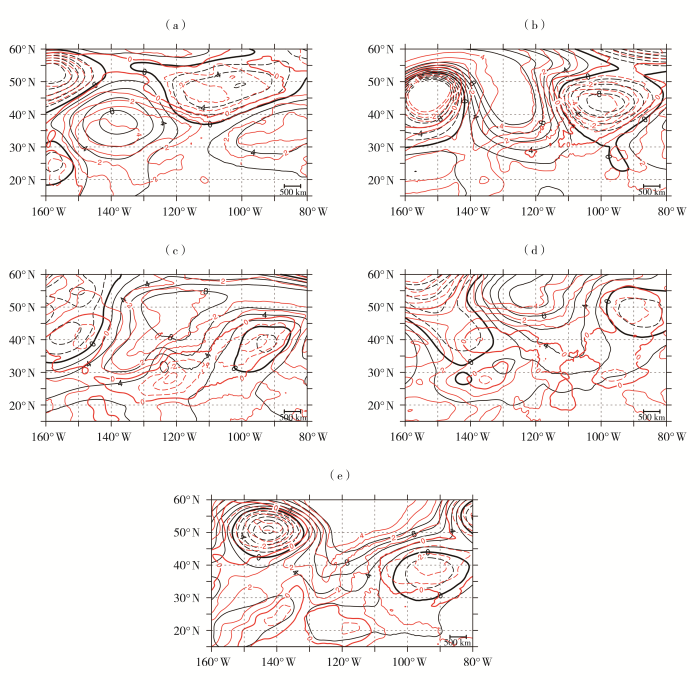
图2
2024年6月29日—7月3日(a)、7月4—8日(b)、7月9—13日(c)、7月14—18日(d)、7月19—23日(e)500 hPa平均位势高度场(黑色等值线,单位:dagpm)和温度场(红色等值线,单位:℃)与1991—2020年气候态差值的空间分布
(实线为正值、虚线为负值)
Fig.2
The spatial distribution of differences between average geopotential height field (black contour lines, Unit: dagpm) and temperature field (red contour lines, Unit: ℃) at 500 hPa from June 29 to July 3 (a), July 4 to July 8 (b), July 9 to July 13 (c), July 14 to July 18 (d), July 19 to July 23 (e), 2024 and the climatological state from 1991 to 2020
(The solid lines denote positive anomalies, dashed lines denote negative anomalies)
图3为2024年6月29日—7月23日山火爆发前逐5 d 700 hPa平均比湿场与1991—2020年气候态差值的空间分布,可直观反映中层大气的湿度特征。山火爆发前,6月29日—7月13日[图3(a)、(b)、(c)],加利福尼亚州北部地区相对于气候态以偏干为主要特征,大气中层水汽严重不足,导致云滴形成困难,抑制了降水和对流活动的发展。同时,该区域受持续高压脊系统控制[图2(a)、(b)、(c)],加剧了中层大气的异常干燥,进而导致大气下沉运动加强、湿度平流作用减弱。7月14—23日[图3(d)、(e)],中层大气湿度较前期有所回升,加州部分地区有少量降水,但降水量级很小,对区域干旱状况无显著缓解。在此期间,由于缺乏降水且对流活动微弱,地表热量难以通过潜热释放耗散,使得近地面维持高温态势,同时植被干燥程度进一步加剧,为后续山火爆发与蔓延提供了正反馈机制。
图 3
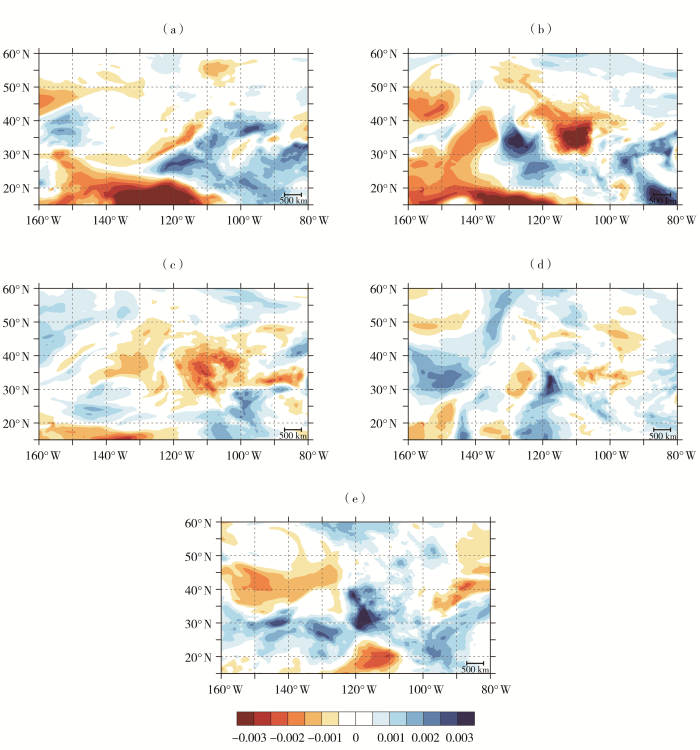
图 3
2024年6月29日—7月3日(a)、7月4—8日(b)、7月9—13日(c)、7月14—18日(d)、7月19—23日(e)700 hPa平均比湿场(单位:kg·kg-1)与1991—2020年气候态差值的空间分布
Fig. 3
The spatial distribution of differences between the 700 hPa average specific humidity field (Unit: kg·kg-1) from June 29 to July 3 (a), July 4 to July 8 (b), July 9 to July 13 (c), July 14 to July 18 (d), July 19 to July 23 (e), 2024 and the climatological state from 1991 to 2020
进一步分析山火爆发前大气环流对区域环境的影响,图4为2024年6月29日—7月23日逐5 d平均垂直风场、水平风速和散度场沿122°W的纬度-高度剖面。可以看出,山火爆发前,加利福尼亚州41°N附近区域上空700~500 hPa持续存在明显的辐散中心,配合反气旋式垂直环流结构,形成下沉运动。该辐散中心与高压脊驱动的反气旋式垂直次级环流耦合,其中环流的下沉支恰好位于加州上空,而上升支则偏向西侧海洋一侧,加强了中层大范围的下沉运动。这种动力强迫作用导致近地层(<850 hPa)水汽通量辐合被抑制,相对湿度降至40%以下,形成“动力-热力”驱动的持续性大气干旱状态,为山火爆发创造了有利的大气环境条件。
图4
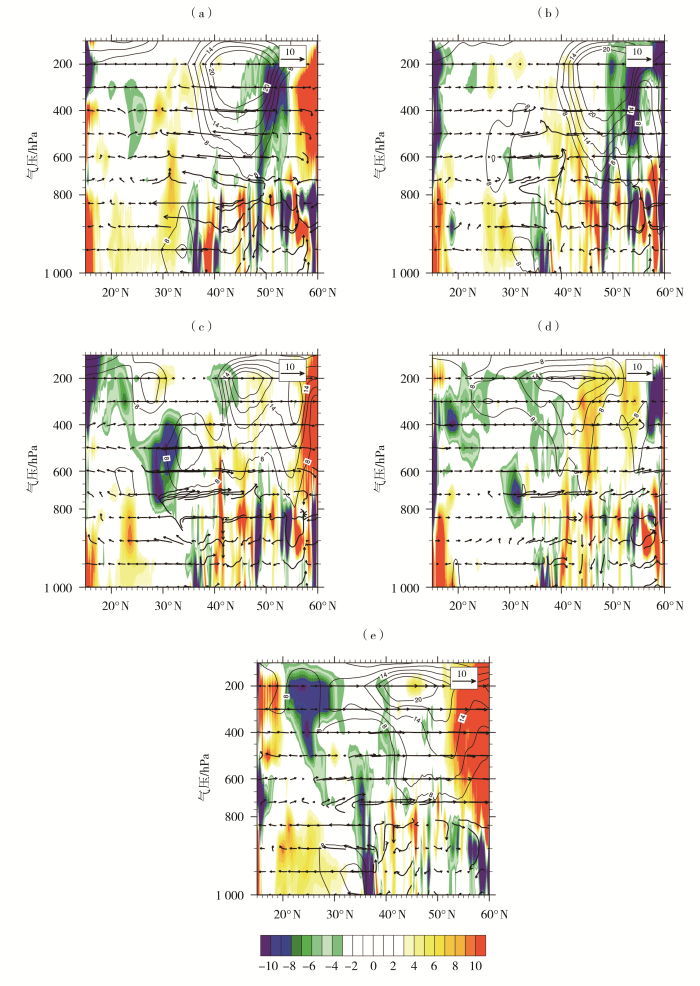
图4
2024年6月29日—7月3日(a)、7月4—8日(b)、7月9—13日(c)、7月14—18日(d)、7月19—23日(e)平均垂直风场(箭头,单位:m·s-1)、水平风速(等值线,单位:m·s-1)和散度(彩色填色,单位:10-6 s-1)沿122°W的纬度-高度剖面
Fig.4
The latitude-time sections of the average vertical wind fields (arrows, Unit: m·s-1), total horizontal wind speed (contours, Unit: m·s-1), and divergence (the color shaded, Unit: 10-6 s-1) from June 29 to July 3 (a), July 4 to July 8 (b), July 9 to July 13 (c), July 14 to July 18 (d), July 19 to July 23 (e), 2024
2.2 海温对山火的影响
海洋表面温度(SST)异常可通过大气遥相关机制对区域山火活动产生显著调控作用,其中ENSO作为热带太平洋最强的年际气候信号,其相位转换能引发全球山火燃烧面积的系统性响应。Niño3.4 指数是表征热带太平洋海温异常的核心指标,其计算方式为Niño3.4关键区的海表温度异常平均值,当Niño3.4指数≥0.5 ℃时,判定为厄尔尼诺事件,当Niño3.4指数≤-0.5 ℃时,则判定为拉尼娜事件。厄尔尼诺事件(Niño3.4区海温偏高)通常会使加州冬季降水增多,气温偏暖。因此,进一步分析Niño3.4区海温对加州山火的影响(图5)。可以看出,2024年1—4月连续4个月Niño3.4指数≥0.5 ℃,即Niño3.4区海温持续正异常,厄尔尼诺事件进入稳定发展阶段。导致北美西海岸高压脊增强,抑制冬季降水并延长干旱期;热带东太平洋海温升高会增强哈德莱环流,进一步强化加州地区的下沉气流,形成“高温-低湿-干旱”的耦合模式。上述双重机制叠加,使得加州地区的植被干燥度、大气干旱度均处于高位,山火爆发风险持续攀升。5—8月Niño3.4区海温恢复正常,但前期厄尔尼诺事件通过大气环流调整,仍可能继续影响加州的山火风险。
图5
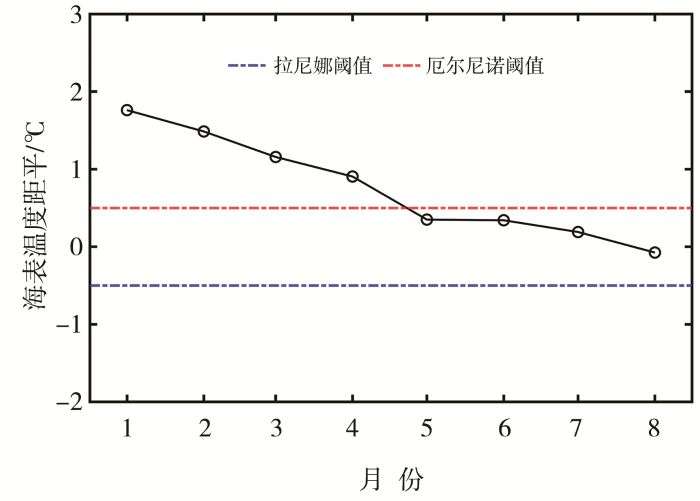
图5
2024年1—8月Niño 3.4区海表温度逐月距平
Fig.5
Monthly sea surface temperature (SST) anomalies in the Niño 3.4 region from January to August 2024
与加州其他山火事件相比,此次山火既存在与同类灾害的同性特征,也因特殊气候背景呈现出独特性。从相似性来看,高温、干旱及异常降水仍然是驱动此次山火爆发的主要因素(Williams et al., 2019)。而其独特性主要表现在:一方面,2024年秋冬季圣安娜风活跃度达历史峰值,实测最大风速超过160 km·h-1,且湿度低于5%;另一方面,2024年北太平洋高压脊异常稳定,持续阻挡太平洋湿润西风向加州内陆输送,导致区域夏季无雨期延长至120 d(历史平均为80 d)。双重条件影响下,导致“帕克大火”不仅持续时间更长,其规模和影响范围也明显扩大。
2.3 山火发生前后干旱特征
基于周尺度DSCI的定量评估(图6)分析美国加州干旱演变对山火爆发的影响。2024年6月底前,加州DSCI均值稳定在3.9,标准差为2.6。该DSCI均值表明该区域绝大部分时间处于无干旱(DSCI≈0)或仅有小范围处于轻度干旱状态。从2024年7月第一周起,加州干旱程度进入快速发展阶段,DSCI呈现明显上升趋势,三周内从6.0激增至26.0,每周增速达6.7,干旱覆盖范围扩大、严重程度加剧。至山火爆发的7月24日当周DSCI为26.0,表明该区域广泛存在D2级中度干旱,且局地可伴随D3级严重干旱,爆发山火的风险随之增加。山火结束后的8月初,加州干旱再次逐渐增加,至8月底DSCI突破80.0,表明该区域大部分地区以D3级严重干旱为主导。
图6
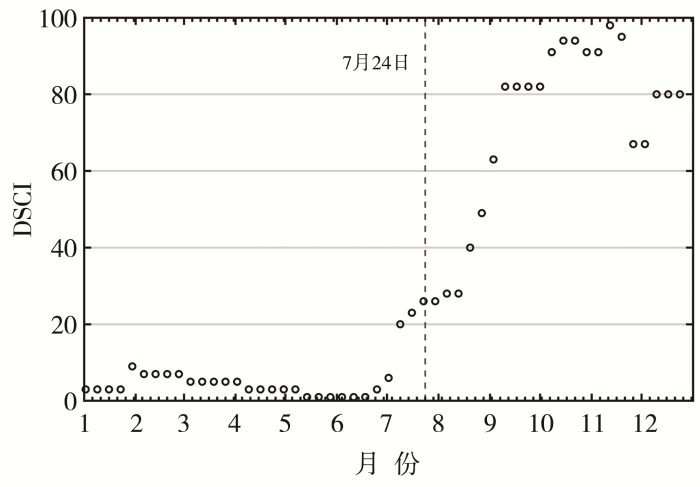
图6
2024年加州DSCI周变化
(黑色虚线为山火爆发时间,下同)
Fig.6
Weekly variations of DSCI in California in 2024
(The black dashed line denotes the wildfire outbreak date, the same as below)
2.4 关键气象要素异常对山火发生的影响
进一步分析气温、湿度和风对山火爆发的影响,图7是山火前后加州日平均气温、日最高气温、相对湿度和降水的逐日变化。平均气温和最高气温逐日变化[图7(a)]表明,2024年加州山火爆发前热力学条件呈现显著异常。自6月中旬起,加州日平均气温持续稳定在20.0 ℃以上,7月中旬突破25.0 ℃。7月1—24日,最高气温有13 d(其中连续9 d)超过30.0 ℃,峰值达32.1 ℃,持续性高温使得大气热力强迫强度持续积累。结合相对湿度[图7(a)]和降水逐日变化[图7(b)]可以看到,从2024年4月起,加州相对湿度呈现不断下降趋势,6—7月日均相对湿度低于50%。4月至5月初有3次降水过程,但降水量较少,区域平均降水量低于0.1 mm,对于缓解前期累积的干旱胁迫几乎没有任何作用,6—7月区域降水进一步减少,基本无有效降水补充。综上所述,此次“帕克大火”爆发之前,气温、湿度、干旱程度和面积指数在加州地区形成了典型的“高温-低湿-干旱”的耦合模式(VAN Oldenborgh et al., 2021),加剧了山火爆发的风险。
图7
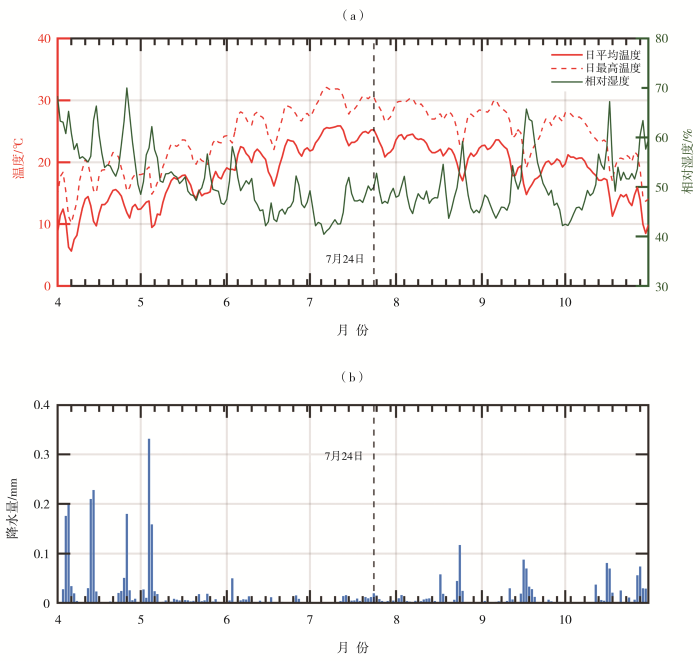
图7
2024年4—10月美国加州日平均气温、日最高气温、相对湿度(a)及降水量(b)逐日变化
Fig.7
Daily variations of mean temperature, daily maximum temperature, relative humidity (a) and precipitation (b) in California, USA from April to October 2024
图8
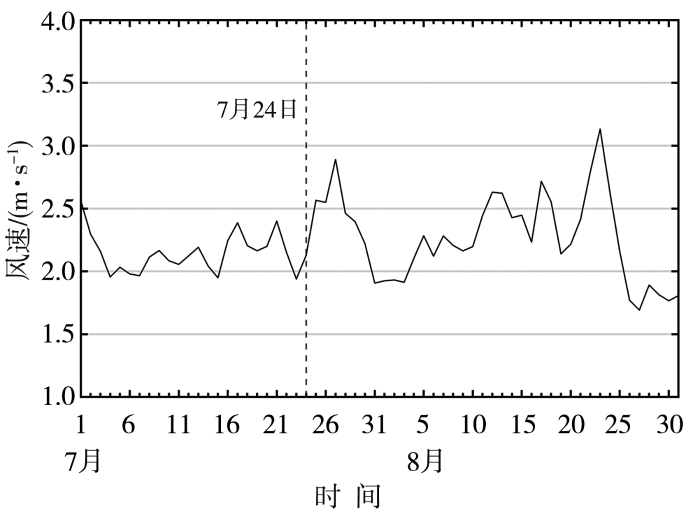
图8
2024年7—8月美国加州10 m风速逐日变化
Fig.8
Daily variations of 10 m wind speed in California, USA from July to August 2024.
2.5 山火对气溶胶光学厚度的影响
MODIS气溶胶光学厚度数据清晰表明了山火爆发前后加州北部大气环境的变化。山火爆发前2024年7月23日[图9(a)],美国加州北部受清洁大气条件主导,MODIS卫星观测,地表AOD值普遍低于0.3,局部低值区甚至小于0.15。值得注意的是,陆地AOD的第98%分位数约为0.8,超过该值即代表极端气溶胶事件,如森林火灾(Gumber et al., 2023)。7月24日山火爆发后,受极端高温(>40 ℃)和干燥条件(相对湿度<15%)驱动,火势迅速蔓延。7月31日[图9(b)],MODIS观测表明加州北部火场核心区(38°N—41°N,123°W—119°W)AOD值已突破2.0,局部峰值达3.8,较灾前增长超过25倍。较高的AOD值意味着大气能见度的急剧恶化,该区域经历了由高强度山火引发的极端气溶胶污染事件。
图9
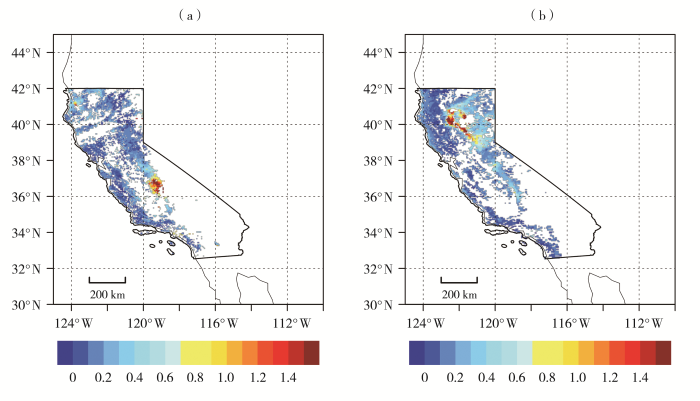
图9
2024年7月23日(a)、31日(b)加州山火爆发前后气溶胶光学厚度(AOD)变化
Fig.9
Changes in aerosol optical depth (AOD) before and after the outbreak of wildfire in California on 23 (a) and 31 (b) July, 2024
3 结论与讨论
本文基于ERA5再分析环流数据、海温监测、干旱监测、卫星遥感监测等数据,从大气环流异常、海温异常及其引发的高温、干旱异常,综合分析2024年7月24日美国加州山火发生的气象原因及其对环境的影响,主要得到以下结论。
1)大气环流异常是山火爆发的重要驱动因素。2024年7月,北美西海岸持续受副热带高压脊控制,500 hPa位势高度异常偏高(超过5 880 gpm),位势高度较气候态偏高40~80 gpm,温度场较气候态呈现显著正异常(偏高2~4 ℃),形成强烈的下沉辐散气流,抑制降水并加剧地表高温。同时,局地强风进一步助长火势蔓延。
2)太平洋海温异常通过遥相关机制造成环流异常,易引发加州地区高温、干旱事件发生。2024年1—4月,Niño 3.4区海温持续正异常,厄尔尼诺处于发展位相,导致北美西海岸高压脊增强,抑制冬季降水并延长干旱期。此外,热带东太平洋暖海温通过增强哈德莱环流,进一步强化加州地区的下沉气流,形成“高温-低湿-干旱”的耦合模式,增大了山火爆发风险。
3)2024年7月24日美国加州山火的爆发是极端气象条件异常的结果。持续的高温(日最高气温达32.1 ℃)、极低的湿度(日均低于50%)和长期干旱(DSCI激增至26.0)使植被处于高度易燃状态。副热带高压脊的稳定控制进一步抑制降水并加剧高温。山火爆发后强风(平均风速3 m·s-1)是火势迅速蔓延的关键驱动力。
4)前期干旱是山火爆发的根本前提,加州地区DSCI在“帕克大火”爆发前三周内从6.0陡增至26.0(每周增速6.7),植被可燃性剧增。厄尔尼诺抑制冬季降水导致的跨季节干旱积累对夏季火灾有重要贡献。
5)7月24日山火爆发后火势迅速蔓延,到7月31日加州北部火场核心区(38°N—41°N,123°W—119°W)AOD值已突破2.0,局部峰值达3.8,较灾前增长超过25倍。
在业务工作中将气象干旱数据与实时气象数据(风速、湿度、温度)、植被相关数据融合,可构建“干旱-气象”火险模型,能有效应对气候变化背景下极端干旱诱发山火的风险。本文针对影响美国加州一次山火过程的多气象因素耦合作用开展分析,由于单次个例分析的代表性有限,后续还需结合更多数据,对气候变化背景下山火的演变规律及气象因素的影响进行深入研究,以进一步提升研究结论的普适性与代表性。
参考文献
气温和空气相对湿度对森林地表细小死可燃物平衡含水率和时滞的影响
[J].
以落叶松(Larix gmelinii)叶片、白桦(Betula platyphylla)叶片、落叶松-白桦叶片混合物为例, 初步研究了气温和空气相对湿度对地表细小死可燃物平衡含水率和时滞的影响, 对这3种可燃物在不同气温、不同空气相对湿度条件下(共20个温湿度组合)失水过程中的含水率进行了测定。通过统计软件建立了相应条件下3种类型可燃物含水率时间动态方程, 并利用此方程估算了3种可燃物平衡含水率和时滞, 同时用估算值分别建立了3种可燃物的平衡含水率-气温模型、平衡含水率-湿度模型、时滞-气温模型、时滞-湿度模型等4种模型。并用已知的4个可燃物平衡含水率模型拟合了该研究得到的平衡含水率数据, 其中, 用Van Wanger模型得到的平均绝对误差和均方根误差均不超过0.01, 拟合效果最好; Nelson模型的拟合效果最差。对气温和空气相对湿度对3种可燃物平衡含水率和时滞的影响的研究结果表明: 气温和空气相对湿度对3种可燃物的平衡含水率和时滞有显著影响, 气温与平衡含水率和时滞呈负相关关系, 而空气相对湿度与二者均呈正相关关系。其中, 时滞-湿度模型高估了可燃物的时滞。该研究具有一定的局限性与不确定性, 在未来的工作中, 应选择在更宽的可燃物类型范围内, 结合更全面的影响因子进行研究。
2022年夏季长江流域重大干旱特征及其成因研究
[J].干旱是影响范围最广的自然灾害之一。2022年夏季发生在长江流域的异常高温干旱事件不仅强度大,而且持续时间长,是一次罕见的重大干旱事件,对我国的社会经济造成了十分严重的影响。鉴于这次事件的极端性,本文在客观分析此次事件演变特征的基础上,揭示大气环流和外强迫异常对此次高温干旱的可能影响。研究发现,气象干旱指数及土壤湿度监测结果一致表明本次旱情从6月开始出现,7月迅速发展,进入8月后范围进一步扩展、强度进一步加剧。与此同时,流域内整体气温偏高,部分地区高温日数超过40 d。此外,夏季整个流域的蒸散量距平是1960年以来的历史第二高值(仅次于2013年高温伏旱),进一步加剧了长江流域的水分亏缺程度。从环流特征来看,夏季西太平洋副热带高压异常偏强西伸、极涡面积偏小及强度偏弱、南亚高压偏强东移,共同导致长江流域的水汽输送条件偏弱、下沉气流盛行,使得整体条件不利于降水发生。而前期拉尼娜事件的持续、印度洋偶极子负位相的出现以及春季青藏高原西北部积雪负异常的持续,可能是导致今年夏季环流异常的主要外强迫因子。
2024年4—6月我国区域性高温干旱特征及其影响因子
[J].在全球气候变暖的严峻形势下,区域性高温干旱事件愈发频繁,对生态环境、粮食安全、经济发展和生命健康构成重大威胁。2024年4—6月,我国华北、西北及西南地区再度遭遇高温干旱侵袭,农业生产遭受明显损失。本研究综合多种数据资料剖析上述3个区域高温干旱事件的演变特征及成因。结果表明,西南地区干旱主要发生在4月,而华北和西北地区自4月起旱情显现、5—6月旱情逐渐加剧(强度增强、范围扩大)。伴随旱情加剧,区域最高气温异常范围明显扩展,西北地区高温日数创历史新高,5月最高气温达到峰值,较旱情最为严重的6月提前一个月;西南和华北地区高温接近历史极值。进一步分析表明,华北地区干旱主要受太平洋地区环流调控,而高温则主要受低纬度太平洋环流及西太平洋暖池影响;西北地区的干旱主要与西太平洋副热带高压及北半球极涡密切相关,高温则主要来自北大西洋的影响;西南地区高温干旱的成因更为复杂,但主要聚焦于北半球副热带高压和低纬度太平洋、印度洋。从大气环流和水汽输送的角度审视,华北和西北旱情的主导因素为大陆高压的发展和维持,而西南地区的干旱则受偏北的西太平洋副热带高压引导,致使来自印度大陆的干热气流控制这一区域,造成水汽辐散,进而引发高温干旱灾害。
Meteorological environments associated with California wildfires and their potential roles in wildfire changes during 1984-2017
[J].
Impacts of changing fire weather conditions on reconstructed trends in U.S. wildland fire activity from 1979 to 2014
[J].
DamageMap: A post-wildfire damaged buildings classifier
[J].
Summer moisture and wildfire risks across Canada
[J].The Fire Weather Index System has been in use across Canada for the past 30 years in the daily operations of fire management agencies. As part of this system, the Drought Code (DC) was developed to act as a daily index of water stored in the soil. A major obstacle to the completion of climate risk analyses on the DC is that lengthy series of daily temperature and precipitation are not available for large portions of the circumboreal forest. Here the authors present a methodological modification to the daily DC to allow its approximation using monthly data. This new Monthly Drought Code (MDC) still retains its ability to capture moisture trends in deep organic layers. On the basis of high-resolution temperature and precipitation data, an analysis of summer moisture availability across Canada over 1901–2002 is presented. The driest periods on record were from the 1920s to the early 1960s, with the driest years being 1955, 1958, and 1961. The wettest period was from the mid-1960s to the 1980s. For the century-long period, drying was statistically significant in northern Canada. Locations south of the Hudson Bay, in the eastern Maritimes, and in western Canada recorded a trend toward decreasing dryness. When analyzed over 1951–2002, trends could hardly be distinguished from the (multi) decadal variability. Annual values of a spatial average of all July MDC grid cells showed an excellent fit against fire statistics: 63% of the variance in the Canada-wide annual area burned from 1959 to 1999 was explained by summer moisture availability.
Climate change is increasing the likelihood of extreme autumn wildfire conditions across California
[J].California has experienced devastating autumn wildfires in recent years. These autumn wildfires have coincided with extreme fire weather conditions during periods of strong offshore winds coincident with unusually dry vegetation enabled by anomalously warm conditions and late onset of autumn precipitation. In this study, we quantify observed changes in the occurrence and magnitude of meteorological factors that enable extreme autumn wildfires in California, and use climate model simulations to ascertain whether these changes are attributable to human-caused climate change. We show that state-wide increases in autumn temperature (∼1 °C) and decreases in autumn precipitation (∼30%) over the past four decades have contributed to increases in aggregate fire weather indices (+20%). As a result, the observed frequency of autumn days with extreme (95th percentile) fire weather—which we show are preferentially associated with extreme autumn wildfires—has more than doubled in California since the early 1980s. We further find an increase in the climate model-estimated probability of these extreme autumn conditions since ∼1950, including a long-term trend toward increased same-season co-occurrence of extreme fire weather conditions in northern and southern California. Our climate model analyses suggest that continued climate change will further amplify the number of days with extreme fire weather by the end of this century, though a pathway consistent with the UN Paris commitments would substantially curb that increase. Given the acute societal impacts of extreme autumn wildfires in recent years, our findings have critical relevance for ongoing efforts to manage wildfire risks in California and other regions.
Assessment of severe aerosol events from NASA MODIS and VIIRS aerosol products for data assimilation and climate continuity
[J].. While the use and data assimilation (DA) of operational Moderate\nResolution Imaging Spectroradiometer (MODIS) aerosol data is commonplace,\nMODIS is scheduled to sunset in the next year. For data continuity, focus\nhas turned to the development of next-generation aerosol products and\nsensors such as those associated with the Visible Infrared Imaging\nRadiometer Suite (VIIRS) on Suomi NPOESS Preparation Project (S-NPP) and\nNOAA-20. Like MODIS algorithms, products from these sensors require their\nown set of extensive error characterization and correction exercises. This\nis particularly true in the context of monitoring significant aerosol events that tax an algorithm's ability to separate cloud from aerosol and account for multiple scattering related errors exacerbated by uncertainties in aerosol optical properties. To investigate the performance of polar-orbiting satellite algorithms to monitor and characterize significant events, a level 3 (L3) product has been developed using a consistent aggregation methodology for 4 years of observations (2016–2019) that is referred to as the SSEC/NRL L3 product. Included in this product are the AErosol RObotic NETwork (AERONET), MODIS Dark Target, Deep Blue, and Multi-Angle\nImplementation of Atmospheric Correction (MAIAC) algorithms. These MODIS\n“baseline algorithms” are compared to NASA's recently released NASA Deep\nBlue algorithm for use with VIIRS. Using this new dataset, the relative\nperformance of the algorithms for both land and ocean were investigated with a focus on the relative skill of detecting severe events and accuracy of the retrievals using AERONET. Maps of higher-percentile aerosol optical\ndepth (AOD) regions of the world by product identified those with the highest measured AODs and determined what is high by local standards. While patterns in AOD match across products and median to moderate AOD values match well, there are regionally correlated biases between products based on sampling, algorithm differences, and AOD range – in particular for higher AOD events. Most notable are differences in boreal biomass burning and Saharan dust. Significant percentile biases must be accounted for when data are used in trend studies, data assimilation, or inverse modeling. These biases vary by aerosol regime and are likely due to retrieval assumptions in lower boundary conditions and aerosol optical models.\n
MODIS 3 km and 10 km aerosol optical depth for China: Evaluation and comparison
[J].
Impact of wildfire-induced land cover modification on local meteorology: A sensitivity study of the 2003 wildfires in Portugal
[J].
Extended reconstructed sea surface temperature, version 5 (ERSSTv5): Upgrades, validations, and intercomparisons
[J].The monthly global 2° × 2° Extended Reconstructed Sea Surface Temperature (ERSST) has been revised and updated from version 4 to version 5. This update incorporates a new release of ICOADS release 3.0 (R3.0), a decade of near-surface data from Argo floats, and a new estimate of centennial sea ice from HadISST2. A number of choices in aspects of quality control, bias adjustment, and interpolation have been substantively revised. The resulting ERSST estimates have more realistic spatiotemporal variations, better representation of high-latitude SSTs, and ship SST biases are now calculated relative to more accurate buoy measurements, while the global long-term trend remains about the same. Progressive experiments have been undertaken to highlight the effects of each change in data source and analysis technique upon the final product. The reconstructed SST is systematically decreased by 0.077°C, as the reference data source is switched from ship SST in ERSSTv4 to modern buoy SST in ERSSTv5. Furthermore, high-latitude SSTs are decreased by 0.1°–0.2°C by using sea ice concentration from HadISST2 over HadISST1. Changes arising from remaining innovations are mostly important at small space and time scales, primarily having an impact where and when input observations are sparse. Cross validations and verifications with independent modern observations show that the updates incorporated in ERSSTv5 have improved the representation of spatial variability over the global oceans, the magnitude of El Niño and La Niña events, and the decadal nature of SST changes over 1930s–40s when observation instruments changed rapidly. Both long- (1900–2015) and short-term (2000–15) SST trends in ERSSTv5 remain significant as in ERSSTv4.
Climate-induced variations in global wildfire danger from 1979 to 2013
[J].Jolly, W. Matt; Freeborn, Patrick H. US Forest Serv, Rocky Mt Res Stn, Fire Sci Lab, Missoula, MT 59803 USA. Cochrane, Mark A.; Freeborn, Patrick H. S Dakota State Univ, GSCE, Brookings, SD 57007 USA. Holden, Zachary A. US Forest Serv Reg 1, Missoula, MT 59802 USA. Brown, Timothy J. Western Reg Climate Ctr, DRI, Reno, NV 89512 USA. Williamson, Grant J.; Bowman, David M. J. S. Univ Tasmania, Sch Biol Sci, Hobart, Tas 7001, Australia.
Estimating the impact of drought on agriculture using the U.S. drought monitor
[J].We estimate the impacts of drought, as defined by the U.S. Drought Monitor (USDM), on crop yields and farm income in the United States during the 2001–2013 time period. Our empirical strategy relies on panel data models with fixed effects that exploit spatial and temporal variability in drought conditions and agricultural outcomes at the county level. We find negative and statistically significant effects of drought on crop yields equal to reductions in the range of 0.1% to 1.2% for corn and soybean yields for each additional week of drought in dryland counties, and 0.1% to 0.5% in irrigated counties. Region‐specific results vary, with some regions experiencing no yield impacts from drought, while yield reductions as high as 8.0% are observed in dryland counties in the Midwest for every additional week of drought in the highest USDM severity category. Despite this impact on crop yields, we find that additional weeks of drought have little to no effect on measures of farm income. While precipitation and temperature explain most of the variability in crop yields, we find that the USDM captures additional negative impacts of drought on yields.
Increased drought severity tracks warming in the United States' largest river basin
[J].
The northern California wildfires of 8-9 October 2017: The role of a major downslope wind event
[J].A series of large wildfires began over the terrain north of San Francisco, California, during the evening of 8 October 2017 and spread across nearly 250,000 acres, including areas near the towns of Santa Rosa and Napa. These “Wine Country” wildfires were the most destructive in California history, with 44 deaths; the loss of 9,000 buildings; damage to approximately 21,000 structures; $10 billion of insured losses; and substantially greater total economic loss.
Wildfires, complexity, and highly optimized tolerance
[J].
ERA5-Land: A state-of-the-art global reanalysis dataset for land applications
[J].. Framed within the Copernicus Climate Change Service (C3S) of the European Commission,\nthe European Centre for Medium-Range Weather Forecasts (ECMWF) is producing an enhanced global dataset for the land component of the fifth generation of European ReAnalysis (ERA5), hereafter referred to as ERA5-Land. Once completed, the period covered will span from 1950 to the present, with continuous updates to support land monitoring applications. ERA5-Land describes the evolution of the water and energy cycles over land in a consistent manner over the production period, which, among others, could be used to analyse trends and anomalies.\nThis is achieved through global high-resolution numerical integrations of the ECMWF land surface model driven by the downscaled meteorological forcing from the ERA5 climate reanalysis, including an elevation correction for the thermodynamic near-surface state. ERA5-Land shares with ERA5\nmost of the parameterizations that guarantees the use of the state-of-the-art land surface modelling applied to numerical weather prediction (NWP) models.\nA main advantage of ERA5-Land compared to ERA5 and the older ERA-Interim is the horizontal resolution, which is enhanced globally to 9 km compared to 31 km (ERA5) or 80 km (ERA-Interim), whereas the temporal resolution\nis hourly as in ERA5. Evaluation against independent in situ observations\nand global model or satellite-based reference datasets shows the added value\nof ERA5-Land in the description of the hydrological cycle, in particular\nwith enhanced soil moisture and lake description, and an overall better agreement of\nriver discharge estimations with available observations. However, ERA5-Land snow depth fields present a mixed performance when compared to those of ERA5, depending on geographical location and altitude.\nThe description of the\nenergy cycle shows comparable results with ERA5. Nevertheless, ERA5-Land reduces the global averaged root mean square error of the skin temperature, taking as\nreference MODIS data, mainly due to the contribution of\ncoastal points where spatial resolution is important.\nSince January 2020, the ERA5-Land period available has extended from January 1981 to the near present, with a\n2- to 3-month delay with respect to real time. The segment prior to 1981 is in production, aiming for a release of the whole dataset in summer/autumn 2021.\nThe high spatial and temporal resolution of ERA5-Land, its extended period, and the consistency of the fields produced makes it a valuable dataset to support hydrological studies,\nto initialize NWP and climate models,\nand to support diverse applications dealing with water resource, land, and environmental management. The full ERA5-Land hourly (Muñoz-Sabater, 2019a) and monthly (Muñoz-Sabater, 2019b) averaged datasets presented in this paper are available through the C3S Climate Data Store at https://doi.org/10.24381/cds.e2161bac and https://doi.org/10.24381/cds.68d2bb30, respectively.\n
What are the most fire-dangerous atmospheric circulations in the Eastern-Mediterranean? Analysis of the synoptic wildfire climatology
[J].
Projections of wildfire risk and activities under 1.5 ℃ and 2.0 ℃ global warming scenarios
[J].Wildfires are important ecosystem processes that have a significant impact on terrestrial vegetation, environment, and climate. This study investigates how future wildfire risk and activities could change under 1.5 °C and 2.0 °C warming scenarios relative to pre-industrial levels using a modified McArthur Forest Fire Danger Index (FFDIn) and the CLM4.5-BGC land surface model. Sixteen Earth System Models (ESMs) from CMIP5 and CMIP6 were employed to supply the variables of climate change under low, middle, and high greenhouse emission scenarios in the 1.5 °C and 2.0 °C scenarios. The ensemble means from the FFDIn and results from the CLM4.5-BGC with multiple forcings show that the dry areas in the southwestern US, Brazilian Highlands, and Arabian islands are projected to face higher wildfire risk with larger burned areas and more carbon emissions under a warmer climate. The Congo Basin and part of the Amazon could have a lower wildfire risk with smaller burned areas and less carbon emissions. The absolute changes in the projected FFDIn are small, although large increases are observed in boreal areas, particularly in the winter and spring. Burned area and carbon emissions are projected to increase in general in the boreal area but decrease in northeastern Asia. Compared to the 1.5 °C scenario, the wildfire risk and burned area levels are projected to increase under the 2.0 °C scenario except in the western Amazon. However, fire carbon emissions are projected to decrease more in tropical areas under the 2.0 °C scenario. The different change directions in eastern North America and eastern China produced by the FFDIn and CLM4.5-BGC suggest the potential effect of non-meteorological elements on fire activities.
Climatology and meteorological evolution of major wildfire events over the northeast United States
[J].This study presents a spatial and temporal climatology of major wildfire events, defined as &gt;100 acres burned (&gt;40.47 ha, where 1 ha = 2.47 acre), in the northeast United States from 1999 to 2009 and the meteorological conditions associated with these events. The northeast United States is divided into two regions: region 1 is centered over the higher terrain of the northeast United States and region 2 is primarily over the coastal plain. About 59% of all wildfire events in these two regions occur in April and May, with ~76% in region 1 and ~53% in region 2. There is large interannual variability in wildfire frequency, with some years having 4–5 times more fire events than other years. The synoptic flow patterns associated with northeast United States wildfires are classified using the North American Regional Reanalysis. The most common synoptic pattern for region 1 is a surface high pressure system centered over the northern Appalachians, which occurred in approximately 46% of all events. For region 2, the prehigh anticyclone type extending from southeast Canada and the Great Lakes to the northeast United States is the most common pattern, occurring in about 46% of all events. A trajectory analysis highlights the influence of large-scale subsidence and decreasing relative humidity during the events, with the prehigh pattern showing the strongest subsidence and downslope drying in the lee of the Appalachians.
A mathematical model for predicting fire spread in wildland fuels
[R].
Is global warming causing more, larger wildfires?
[J].
Calibrating human attention as indicator: Monitoring #drought in the twittersphere
[J].State climatologists and other expert drought observers have speculated about the value of monitoring Twitter for #drought and related hashtags. This study statistically examines the relationships between the rate of tweeting using #drought and related hashtags, within states, accounting for drought status and news coverage of drought. We collected and geolocated tweets, 2017–18, and used regression analysis and a diversity statistic to explain expected and identify unexpected volumes of tweets. This provides a quantifiable means to detect state-weeks with a volume of tweets that exceeds the upper limit of the prediction interval. To filter out instances where a high volume of tweets is related to the activities of one person or very few people, a diversity statistic was used to eliminate anomalous state-weeks where the diversity statistic did not exceed the 75th percentile of the range for that state’s diversity statistic. Anomalous state-weeks in a few cases preceded the onset of drought but more often coincided with or lagged increases in drought. Tweets are both a means of sharing original experience and a means of discussing news and other recent events, and anomalous weeks occurred throughout the course of a drought, not just at the beginning. A sum-to-zero contrast coefficient for each state revealed a difference in the propensity of different states to tweet about drought, apparently reflecting recent and long-term experience in those states, and suggesting locales that would be most predisposed to drought policy innovation.
Vegetation and weather explain variation in crown damage within a large mixed-severity wildfire
[J].
Attribution of the Australian bushfire risk to anthropogenic climate change
[J].
Observed impacts of anthropogenic climate change on wildfire in California
[J].Recent fire seasons have fueled intense speculation regarding the effect of anthropogenic climate change on wildfire in western North America and especially in California. During 1972–2018, California experienced a fivefold increase in annual burned area, mainly due to more than an eightfold increase in summer forest‐fire extent. Increased summer forest‐fire area very likely occurred due to increased atmospheric aridity caused by warming. Since the early 1970s, warm‐season days warmed by approximately 1.4 °C as part of a centennial warming trend, significantly increasing the atmospheric vapor pressure deficit (VPD). These trends are consistent with anthropogenic trends simulated by climate models. The response of summer forest‐fire area to VPD is exponential, meaning that warming has grown increasingly impactful. Robust interannual relationships between VPD and summer forest‐fire area strongly suggest that nearly all of the increase in summer forest‐fire area during 1972–2018 was driven by increased VPD. Climate change effects on summer wildfire were less evident in nonforested lands. In fall, wind events and delayed onset of winter precipitation are the dominant promoters of wildfire. While these variables did not change much over the past century, background warming and consequent fuel drying is increasingly enhancing the potential for large fall wildfires. Among the many processes important to California's diverse fire regimes, warming‐driven fuel drying is the clearest link between anthropogenic climate change and increased California wildfire activity to date.

