北京市24 h变温对冠心病和脑梗死急诊人数的影响
1
2021
... 研究显示气温在气候康养指标中所占的权重最高,是目前气候康养指标构建的核心考量因子,其次为降水和日照(Blazejczyk,2001;Brandenburg and Arnberger,2001;Scott and McBoyle,2001).然而,大气污染是影响人体健康的重要危险因素(Song et al.,2022;Ziou et al.,2022).全球疾病负担(Global Burden of Disease,GBD)研究显示,空气污染是全球第四大死亡风险因素(GBD 2019 Diseases and Injuries Collaborators,2020).冬季气温寒冷,此时气温对健康的影响大于污染,尤其对于老年人及高血压等慢性病患者(GBD 2019 Diseases and Injuries Collaborators,2020;陈蕾等,2021;黄开龙等,2021;徐静等,2021).此外,大量研究表明气温和大气污染之间存在协同效应,增加心血管及呼吸系统疾病等发病的风险(Chen et al.,2017;Li et al.,2017;刘楚薇等,2020;Anenberg et al.,2020;Song et al.,2021).建议未来在构建气候康养指标的过程中,纳入简易可得的空气质量指数,探究气温和污染的协同效应,以提升指标的科学性和准确性. ...
1
2006
... 测量拟合及单传感器指数是早期常用仪器直接观测的结果来评定环境舒适度的产物,针对被动的代谢状态,是对热条件的绝对测量,包括卡他度(Kata thermometer)、湿球温度(Wet Bulb Temperature,WBT)等.卡他度指被加热到36.5 ℃时的卡他温度计的液球在单位时间、单位面积上所散发的热量,其综合考虑了气温、风、湿度、长波辐射4个因素的影响,可以反映温度、湿度和风速3者的综合散热效果,用来评价劳动条件的舒适程度(Hill et al.,1916;郭伏和钱省三,2006),被广泛应用于矿井作业、办公室舒适度测量、人体的热交换与平衡等领域,是最具影响力的仪器测定指标(闫业超等,2013;Hill and Hargood-Ash,1919);湿球温度(Wet Bulb Temperature,WBT)指湿空气的绝热饱和温度,综合表示了热环境的温度和湿度,是描述人体能量调节的相关变量,适用于温暖天气和热带高温影响及某些工业职业相关问题的研究(Haldane,1905; Dong et al.,2022). ...
辽宁避暑旅游气候条件分析和气象指数研究
1
2018
... Typical indicators of tourism climate indices
Tab.3 | 分类 | 指标名称 | 缩写 | 研究 | 地理与气象因子 | 人体代谢、服装热阻及其他 | 验证与否 |
| 综合 | 度假气候指数:城市 | HCI:Urban | Scott et al.,2016 | 温度、湿度、风、降水、云量 | — | 是 |
| 气候康养旅游指数 | TCI | Mieczkowski,1985 | 温度、湿度、风、降水、日照 | — | 是 |
| 气候旅游指数 | CIT | De Freitas et al.,2008 | 云量、风、降水 | — | 是 |
| 避暑 | 避暑旅游指数 | TSI | 吴普等,2014 | 气温、湿度、风、空气质量 | — | 否 |
| 避暑旅游气象指数 | MIST | 侯亚红等,2018 | 温度、湿度、风、降水、日照、空气质量 | — | 是 |
| 高原 | 旅游气候适宜性指数 | TCSI | Tang et al.,2012 | 温度、湿度、日照、太阳辐射、氧含量、大气压力 | — | 否 |
| 喀斯特洞穴康养功能指数 | IKCH | 贾真真等,2019 | 气温、湿度、风、空气质量、空气离子 | — | 是 |
| 海滨 | 海滩气候指数 | BCI | Morgan et al.,2000 | 降水、风、日照 | 感觉温度、沐浴温度 | 是 |
| 滨海旅游气候指数 | CTCI | Gao et al.,2022 | 温度、湿度、风、降水、日照、空气质量 | — | 是 |
| 森林 | 森林综合保健指数 | FCHI | Zhu et al.,2021 | 氧含量、空气质量 | — | 是 |
| 森林康养指数 | FHI | 郑自君等,2021 | 温度、湿度、空气质量、海拔 | — | 是 |
注: “—”表示“无”. ...
气象条件对深圳市罗湖区上呼吸道感染就诊人数的影响
1
2021
... 研究显示气温在气候康养指标中所占的权重最高,是目前气候康养指标构建的核心考量因子,其次为降水和日照(Blazejczyk,2001;Brandenburg and Arnberger,2001;Scott and McBoyle,2001).然而,大气污染是影响人体健康的重要危险因素(Song et al.,2022;Ziou et al.,2022).全球疾病负担(Global Burden of Disease,GBD)研究显示,空气污染是全球第四大死亡风险因素(GBD 2019 Diseases and Injuries Collaborators,2020).冬季气温寒冷,此时气温对健康的影响大于污染,尤其对于老年人及高血压等慢性病患者(GBD 2019 Diseases and Injuries Collaborators,2020;陈蕾等,2021;黄开龙等,2021;徐静等,2021).此外,大量研究表明气温和大气污染之间存在协同效应,增加心血管及呼吸系统疾病等发病的风险(Chen et al.,2017;Li et al.,2017;刘楚薇等,2020;Anenberg et al.,2020;Song et al.,2021).建议未来在构建气候康养指标的过程中,纳入简易可得的空气质量指数,探究气温和污染的协同效应,以提升指标的科学性和准确性. ...
喀斯特洞穴康养适宜性评价——以贵州红果树景区天缘洞为例
1
2019
... Typical indicators of tourism climate indices
Tab.3 | 分类 | 指标名称 | 缩写 | 研究 | 地理与气象因子 | 人体代谢、服装热阻及其他 | 验证与否 |
| 综合 | 度假气候指数:城市 | HCI:Urban | Scott et al.,2016 | 温度、湿度、风、降水、云量 | — | 是 |
| 气候康养旅游指数 | TCI | Mieczkowski,1985 | 温度、湿度、风、降水、日照 | — | 是 |
| 气候旅游指数 | CIT | De Freitas et al.,2008 | 云量、风、降水 | — | 是 |
| 避暑 | 避暑旅游指数 | TSI | 吴普等,2014 | 气温、湿度、风、空气质量 | — | 否 |
| 避暑旅游气象指数 | MIST | 侯亚红等,2018 | 温度、湿度、风、降水、日照、空气质量 | — | 是 |
| 高原 | 旅游气候适宜性指数 | TCSI | Tang et al.,2012 | 温度、湿度、日照、太阳辐射、氧含量、大气压力 | — | 否 |
| 喀斯特洞穴康养功能指数 | IKCH | 贾真真等,2019 | 气温、湿度、风、空气质量、空气离子 | — | 是 |
| 海滨 | 海滩气候指数 | BCI | Morgan et al.,2000 | 降水、风、日照 | 感觉温度、沐浴温度 | 是 |
| 滨海旅游气候指数 | CTCI | Gao et al.,2022 | 温度、湿度、风、降水、日照、空气质量 | — | 是 |
| 森林 | 森林综合保健指数 | FCHI | Zhu et al.,2021 | 氧含量、空气质量 | — | 是 |
| 森林康养指数 | FHI | 郑自君等,2021 | 温度、湿度、空气质量、海拔 | — | 是 |
注: “—”表示“无”. ...
气象因素与流感发病相关关系的Meta分析
1
2022
... 近年来全球范围内开展了关于气象因素健康影响的研究,探究了适宜气候条件下降低的疾病风险,发现低浓度的空气污染暴露、低湿度、风速和气压等气象因子与循环及呼吸系统疾病等存在正相关,而适宜的气温、湿度、风速和气压等气象条件可以降低疾病风险(Brauer et al.,2019;张莹等,2019;骆学勤等,2021;李欣和刘桃成,2022;Brauer et al.,2022).基于气温等环境暴露风险评估模型,揭示不同气候康养地的最适气温阈值,量化趋利康养效应,评估疾病风险是未来该领域研究的重点.未来需进一步开展气候康养效应风险评估研究,通过不同区域和人群暴露风险评估模型等的研发,分析气候康养地适宜气温、优良空气和舒适环境降低的疾病风险,量化气候康养降低的疾病风险,为气候康养产业的可持续发展提供理论支持. ...
候鸟式旅居气候康养探析
2
2021
... 人体舒适度是从气象角度评价不同气候条件下人体的舒适状态,根据机体与大气环境之间的热交换制定的生物气象指标(孙美淑和李山,2015).过去一百年中,国内外研发了大量的人体舒适度指标,足见量化人体热舒适环境问题的迫切性和重要性.气候康养是指将人体从有害的气候环境转移到气候条件适宜且利于开展康养的气候康养地,从被动“避害”到主动“趋利”,达到降低疾病风险、增进机体机能和提升健康水平的目的(刘明华,2003;中国气象局公共气象服务中心和中国旅游研究院战略所,2020;林颖仪等,2021).气候康养旅游指数(Tourism Climate Indices,TCIs)是与旅游相关的人体舒适度,旨在表征旅游目的地气候环境状态,综合计量旅行者气候幸福感(Mieczkowski,1985;De Freitas and Grigorieva,2015).国际社会曾多次强调气候与健康相关指标在气候康养产业发展中的重要性,早在2001年世界气象组织(World Meteorological Organization,WMO)气候学委员会的气候与健康工作组就提出将气候与健康相关指标的科学构建作为未来两年的首要工作(WHO,2001).气候康养旅游指数对提升气象部门的服务质量、辅助气候康养目的地决策和促进气候康养产业良性发展具有重要意义(吴昊旻等,2020;卢山等,2021). ...
... 中英文文献共检索1 852篇,发表于1979—2023年;英文文献共检索9 662篇,发表于1980—2023年.(1)关键词共现分析显示,英文研究主题以旅游满意度、竞争力、海滩、岛屿、生物多样性和气候适宜度等为主[图1(a)];中国学者对气候康养的关注程度较高,中文研究主题以人体舒适度、气候舒适度和康养旅游等为主[图1(b)].气候舒适度的内涵是客观反映气候的舒适程度,而人体舒适度的内涵是反映人体主观感受的舒适程度,气候康养旅游指数则是人体舒适度在康养旅游中的应用,反映康养旅游目的地人体热舒适程度.关键词共现分析显示英文研究中关注度较高的指数为通用热气候指数(Universal Thermal Climate Index,UTCI)和湿球温度(Wet Bulb Temperature,WBT),中文研究中关注度较高的指数为风效指数(Wind Effect Index,WEI)、温湿指数(Temperature Humidity Index,THI)和风寒指数(Wind Chill Index,WCI).(2)作者共现分析显示,英文研究作者以Rob Law(Han et al.,2021;Liao et al.,2022)、Jie Zhang(Nian et al.,2019;Liu et al.,2022)和Daniel Scott(Scott and McBoyle,2001;Rutty and Scott,2015;Scott et al.,2016)等人为主;中文研究作者以孙根年、马丽君、王式功和张京红等人在气候康养方向影响力大(马丽君等,2007;孙根年和马丽君,2007;王敏珍等,2012;卢山等,2021;林颖仪等,2021;孙根年,2022;张京红等,2022;张明洁等,2022).(3)发文量前十机构分析显示(表1),英文研究以中国科学院、乌克兰教育科学部、香港理工大学、中国科学院大学和美国佛罗里达州立大学发文量最多;中文研究以南京信息工程大学、陕西师范大学、华东师范大学、成都信息工程大学和同济大学发文量最多.此外,Daniel Scott所属的加拿大滑铁卢大学发表了41篇相关研究被引2 062次,被引量位于第六,也是该领域重要的研究机构. ...
我国臭氧污染时空分布及其成因研究进展
1
2020
... 研究显示气温在气候康养指标中所占的权重最高,是目前气候康养指标构建的核心考量因子,其次为降水和日照(Blazejczyk,2001;Brandenburg and Arnberger,2001;Scott and McBoyle,2001).然而,大气污染是影响人体健康的重要危险因素(Song et al.,2022;Ziou et al.,2022).全球疾病负担(Global Burden of Disease,GBD)研究显示,空气污染是全球第四大死亡风险因素(GBD 2019 Diseases and Injuries Collaborators,2020).冬季气温寒冷,此时气温对健康的影响大于污染,尤其对于老年人及高血压等慢性病患者(GBD 2019 Diseases and Injuries Collaborators,2020;陈蕾等,2021;黄开龙等,2021;徐静等,2021).此外,大量研究表明气温和大气污染之间存在协同效应,增加心血管及呼吸系统疾病等发病的风险(Chen et al.,2017;Li et al.,2017;刘楚薇等,2020;Anenberg et al.,2020;Song et al.,2021).建议未来在构建气候康养指标的过程中,纳入简易可得的空气质量指数,探究气温和污染的协同效应,以提升指标的科学性和准确性. ...
气候环境可用于人体康复治疗
2
2003
... 人体舒适度是从气象角度评价不同气候条件下人体的舒适状态,根据机体与大气环境之间的热交换制定的生物气象指标(孙美淑和李山,2015).过去一百年中,国内外研发了大量的人体舒适度指标,足见量化人体热舒适环境问题的迫切性和重要性.气候康养是指将人体从有害的气候环境转移到气候条件适宜且利于开展康养的气候康养地,从被动“避害”到主动“趋利”,达到降低疾病风险、增进机体机能和提升健康水平的目的(刘明华,2003;中国气象局公共气象服务中心和中国旅游研究院战略所,2020;林颖仪等,2021).气候康养旅游指数(Tourism Climate Indices,TCIs)是与旅游相关的人体舒适度,旨在表征旅游目的地气候环境状态,综合计量旅行者气候幸福感(Mieczkowski,1985;De Freitas and Grigorieva,2015).国际社会曾多次强调气候与健康相关指标在气候康养产业发展中的重要性,早在2001年世界气象组织(World Meteorological Organization,WMO)气候学委员会的气候与健康工作组就提出将气候与健康相关指标的科学构建作为未来两年的首要工作(WHO,2001).气候康养旅游指数对提升气象部门的服务质量、辅助气候康养目的地决策和促进气候康养产业良性发展具有重要意义(吴昊旻等,2020;卢山等,2021). ...
... 基于我国传统中医“天人合一,趋利避害”的养生准则,气候康养旅游可以帮助人群消除疲劳、加快康复,使身心趋于最佳状态(刘明华,2003;王乐和汪荣斌,2021).随着气候康养旅游的日益盛行,国内外学者构建了大量的气候康养指标(Mieczkowski,1985;Morgan et al.,2000;De Freitas et al.,2008;Tang et al.,2012;吴普,2014;Scott et al.,2016;Zhu et al.,2021).由于我国地域广阔,有多种气候类型的气候康养研究受到广泛关注,但存在以下问题需进一步探讨: ...
北京城市绿化夏季小气候条件对人体的适宜度
1
1984
... Typical indicators of human comfort
Tab.2 | 分类 | 指数名称 | 缩写 | 研究 | 地理与气象因子 | 人体代谢、服装热阻及其他 | 是否经过验证 |
| 测量拟合及单传感器指数 | 卡他度 | — | Hill et al.,1916 | 气温、风、湿度、长波辐射 | — | 否 |
| 空气温度 | Ta | Macpherson,1962 | 气温 | — | 否 |
| 湿球温度 | WBT | Haldane,1905 | 湿球温度、环境气压 | — | 否 |
| 代数或统计模型 | 风寒指数 | WCI | Siple and Passel,1945 | 气温、风 | — | 否 |
| 温湿指数 | THI | Thom,1959 | 气温、湿度 | — | 是 |
| 综合舒适度指标 | CCI | 陆鼎煌等,1984 | 气温、湿度、风 | — | 否 |
| 基于“黄金分割法”的人体舒适度指数 | — | 王式功等,2013 | 气温、风、湿度、海拔、纬度 | — | 是 |
| 代理热应力和热应变指数 | 生理效应指标 | Ep | Robinson et al.,1945 | 气温、湿度 | 服装、代谢率、心率、直肠温度、皮肤温度、出汗率 | 是 |
| 预计四小时排汗率 | P4SR | McArdle et al.,1947 | 气温、湿球温度、风 | 服装、代谢率、与适应者相关 | 是 |
| 有效温度 | ET | Houghten and Yaglou,1923 | 气温、湿球温度、风 | 服装 | 是 |
| 风效指数 | WEI | Terjung,1966 | 气温、风、太阳辐射 | — | 否 |
| 能量平衡应变和应力指数 | 皮肤温度能量平衡指数 | STEBIDEX | De Freitas,1985;De Freitas,1986;De Freitas,1987 | 气温、风、湿度、长波辐射、太阳辐射 | 服装、代谢率 | 是 |
| 热力感受比 | TAR | Ionides et al.,1945 | 气温、平均辐射温度、湿度 | 代谢率 | 是 |
| 通用热气候指数 | UTCI | Jendritzky et al.,2009 | 气温、湿度、风、太阳辐射、长波辐射 | 服装、代谢率 | 是 |
| 生理等效温度 | PET | Mayer and Höppe,1987 | 气温、平均辐射温度、湿度、风 | 服装、代谢率 | 是 |
| 特定用途指数 | 热适应预测效应 | PEHA | Givoni and Goldman,1973b | 气温、湿度 | 代谢率、直肠温度、心率 | 是 |
| 生物气候距离指数 | BDI | Mateeva and Filipov,2003 | 气温、湿度、风、太阳辐射、长波辐射 | 代谢率 | 否 |
注: “—”表示“无”. ...
云贵高原3个旅游城市气候舒适度及其康养效应研究
2
2021
... 人体舒适度是从气象角度评价不同气候条件下人体的舒适状态,根据机体与大气环境之间的热交换制定的生物气象指标(孙美淑和李山,2015).过去一百年中,国内外研发了大量的人体舒适度指标,足见量化人体热舒适环境问题的迫切性和重要性.气候康养是指将人体从有害的气候环境转移到气候条件适宜且利于开展康养的气候康养地,从被动“避害”到主动“趋利”,达到降低疾病风险、增进机体机能和提升健康水平的目的(刘明华,2003;中国气象局公共气象服务中心和中国旅游研究院战略所,2020;林颖仪等,2021).气候康养旅游指数(Tourism Climate Indices,TCIs)是与旅游相关的人体舒适度,旨在表征旅游目的地气候环境状态,综合计量旅行者气候幸福感(Mieczkowski,1985;De Freitas and Grigorieva,2015).国际社会曾多次强调气候与健康相关指标在气候康养产业发展中的重要性,早在2001年世界气象组织(World Meteorological Organization,WMO)气候学委员会的气候与健康工作组就提出将气候与健康相关指标的科学构建作为未来两年的首要工作(WHO,2001).气候康养旅游指数对提升气象部门的服务质量、辅助气候康养目的地决策和促进气候康养产业良性发展具有重要意义(吴昊旻等,2020;卢山等,2021). ...
... 中英文文献共检索1 852篇,发表于1979—2023年;英文文献共检索9 662篇,发表于1980—2023年.(1)关键词共现分析显示,英文研究主题以旅游满意度、竞争力、海滩、岛屿、生物多样性和气候适宜度等为主[图1(a)];中国学者对气候康养的关注程度较高,中文研究主题以人体舒适度、气候舒适度和康养旅游等为主[图1(b)].气候舒适度的内涵是客观反映气候的舒适程度,而人体舒适度的内涵是反映人体主观感受的舒适程度,气候康养旅游指数则是人体舒适度在康养旅游中的应用,反映康养旅游目的地人体热舒适程度.关键词共现分析显示英文研究中关注度较高的指数为通用热气候指数(Universal Thermal Climate Index,UTCI)和湿球温度(Wet Bulb Temperature,WBT),中文研究中关注度较高的指数为风效指数(Wind Effect Index,WEI)、温湿指数(Temperature Humidity Index,THI)和风寒指数(Wind Chill Index,WCI).(2)作者共现分析显示,英文研究作者以Rob Law(Han et al.,2021;Liao et al.,2022)、Jie Zhang(Nian et al.,2019;Liu et al.,2022)和Daniel Scott(Scott and McBoyle,2001;Rutty and Scott,2015;Scott et al.,2016)等人为主;中文研究作者以孙根年、马丽君、王式功和张京红等人在气候康养方向影响力大(马丽君等,2007;孙根年和马丽君,2007;王敏珍等,2012;卢山等,2021;林颖仪等,2021;孙根年,2022;张京红等,2022;张明洁等,2022).(3)发文量前十机构分析显示(表1),英文研究以中国科学院、乌克兰教育科学部、香港理工大学、中国科学院大学和美国佛罗里达州立大学发文量最多;中文研究以南京信息工程大学、陕西师范大学、华东师范大学、成都信息工程大学和同济大学发文量最多.此外,Daniel Scott所属的加拿大滑铁卢大学发表了41篇相关研究被引2 062次,被引量位于第六,也是该领域重要的研究机构. ...
气候因素对流感影响的系统评价
1
2021
... 近年来全球范围内开展了关于气象因素健康影响的研究,探究了适宜气候条件下降低的疾病风险,发现低浓度的空气污染暴露、低湿度、风速和气压等气象因子与循环及呼吸系统疾病等存在正相关,而适宜的气温、湿度、风速和气压等气象条件可以降低疾病风险(Brauer et al.,2019;张莹等,2019;骆学勤等,2021;李欣和刘桃成,2022;Brauer et al.,2022).基于气温等环境暴露风险评估模型,揭示不同气候康养地的最适气温阈值,量化趋利康养效应,评估疾病风险是未来该领域研究的重点.未来需进一步开展气候康养效应风险评估研究,通过不同区域和人群暴露风险评估模型等的研发,分析气候康养地适宜气温、优良空气和舒适环境降低的疾病风险,量化气候康养降低的疾病风险,为气候康养产业的可持续发展提供理论支持. ...
陕西省旅游气候舒适度评价
1
2007
... 中英文文献共检索1 852篇,发表于1979—2023年;英文文献共检索9 662篇,发表于1980—2023年.(1)关键词共现分析显示,英文研究主题以旅游满意度、竞争力、海滩、岛屿、生物多样性和气候适宜度等为主[图1(a)];中国学者对气候康养的关注程度较高,中文研究主题以人体舒适度、气候舒适度和康养旅游等为主[图1(b)].气候舒适度的内涵是客观反映气候的舒适程度,而人体舒适度的内涵是反映人体主观感受的舒适程度,气候康养旅游指数则是人体舒适度在康养旅游中的应用,反映康养旅游目的地人体热舒适程度.关键词共现分析显示英文研究中关注度较高的指数为通用热气候指数(Universal Thermal Climate Index,UTCI)和湿球温度(Wet Bulb Temperature,WBT),中文研究中关注度较高的指数为风效指数(Wind Effect Index,WEI)、温湿指数(Temperature Humidity Index,THI)和风寒指数(Wind Chill Index,WCI).(2)作者共现分析显示,英文研究作者以Rob Law(Han et al.,2021;Liao et al.,2022)、Jie Zhang(Nian et al.,2019;Liu et al.,2022)和Daniel Scott(Scott and McBoyle,2001;Rutty and Scott,2015;Scott et al.,2016)等人为主;中文研究作者以孙根年、马丽君、王式功和张京红等人在气候康养方向影响力大(马丽君等,2007;孙根年和马丽君,2007;王敏珍等,2012;卢山等,2021;林颖仪等,2021;孙根年,2022;张京红等,2022;张明洁等,2022).(3)发文量前十机构分析显示(表1),英文研究以中国科学院、乌克兰教育科学部、香港理工大学、中国科学院大学和美国佛罗里达州立大学发文量最多;中文研究以南京信息工程大学、陕西师范大学、华东师范大学、成都信息工程大学和同济大学发文量最多.此外,Daniel Scott所属的加拿大滑铁卢大学发表了41篇相关研究被引2 062次,被引量位于第六,也是该领域重要的研究机构. ...
危机事件与旅游业的恢复
1
2022
... 中英文文献共检索1 852篇,发表于1979—2023年;英文文献共检索9 662篇,发表于1980—2023年.(1)关键词共现分析显示,英文研究主题以旅游满意度、竞争力、海滩、岛屿、生物多样性和气候适宜度等为主[图1(a)];中国学者对气候康养的关注程度较高,中文研究主题以人体舒适度、气候舒适度和康养旅游等为主[图1(b)].气候舒适度的内涵是客观反映气候的舒适程度,而人体舒适度的内涵是反映人体主观感受的舒适程度,气候康养旅游指数则是人体舒适度在康养旅游中的应用,反映康养旅游目的地人体热舒适程度.关键词共现分析显示英文研究中关注度较高的指数为通用热气候指数(Universal Thermal Climate Index,UTCI)和湿球温度(Wet Bulb Temperature,WBT),中文研究中关注度较高的指数为风效指数(Wind Effect Index,WEI)、温湿指数(Temperature Humidity Index,THI)和风寒指数(Wind Chill Index,WCI).(2)作者共现分析显示,英文研究作者以Rob Law(Han et al.,2021;Liao et al.,2022)、Jie Zhang(Nian et al.,2019;Liu et al.,2022)和Daniel Scott(Scott and McBoyle,2001;Rutty and Scott,2015;Scott et al.,2016)等人为主;中文研究作者以孙根年、马丽君、王式功和张京红等人在气候康养方向影响力大(马丽君等,2007;孙根年和马丽君,2007;王敏珍等,2012;卢山等,2021;林颖仪等,2021;孙根年,2022;张京红等,2022;张明洁等,2022).(3)发文量前十机构分析显示(表1),英文研究以中国科学院、乌克兰教育科学部、香港理工大学、中国科学院大学和美国佛罗里达州立大学发文量最多;中文研究以南京信息工程大学、陕西师范大学、华东师范大学、成都信息工程大学和同济大学发文量最多.此外,Daniel Scott所属的加拿大滑铁卢大学发表了41篇相关研究被引2 062次,被引量位于第六,也是该领域重要的研究机构. ...
西安旅游气候舒适度与客流量年内变化相关性分析
1
2007
... 中英文文献共检索1 852篇,发表于1979—2023年;英文文献共检索9 662篇,发表于1980—2023年.(1)关键词共现分析显示,英文研究主题以旅游满意度、竞争力、海滩、岛屿、生物多样性和气候适宜度等为主[图1(a)];中国学者对气候康养的关注程度较高,中文研究主题以人体舒适度、气候舒适度和康养旅游等为主[图1(b)].气候舒适度的内涵是客观反映气候的舒适程度,而人体舒适度的内涵是反映人体主观感受的舒适程度,气候康养旅游指数则是人体舒适度在康养旅游中的应用,反映康养旅游目的地人体热舒适程度.关键词共现分析显示英文研究中关注度较高的指数为通用热气候指数(Universal Thermal Climate Index,UTCI)和湿球温度(Wet Bulb Temperature,WBT),中文研究中关注度较高的指数为风效指数(Wind Effect Index,WEI)、温湿指数(Temperature Humidity Index,THI)和风寒指数(Wind Chill Index,WCI).(2)作者共现分析显示,英文研究作者以Rob Law(Han et al.,2021;Liao et al.,2022)、Jie Zhang(Nian et al.,2019;Liu et al.,2022)和Daniel Scott(Scott and McBoyle,2001;Rutty and Scott,2015;Scott et al.,2016)等人为主;中文研究作者以孙根年、马丽君、王式功和张京红等人在气候康养方向影响力大(马丽君等,2007;孙根年和马丽君,2007;王敏珍等,2012;卢山等,2021;林颖仪等,2021;孙根年,2022;张京红等,2022;张明洁等,2022).(3)发文量前十机构分析显示(表1),英文研究以中国科学院、乌克兰教育科学部、香港理工大学、中国科学院大学和美国佛罗里达州立大学发文量最多;中文研究以南京信息工程大学、陕西师范大学、华东师范大学、成都信息工程大学和同济大学发文量最多.此外,Daniel Scott所属的加拿大滑铁卢大学发表了41篇相关研究被引2 062次,被引量位于第六,也是该领域重要的研究机构. ...
气候舒适度评价的经验模型:回顾与展望
4
2015
... 人体舒适度是从气象角度评价不同气候条件下人体的舒适状态,根据机体与大气环境之间的热交换制定的生物气象指标(孙美淑和李山,2015).过去一百年中,国内外研发了大量的人体舒适度指标,足见量化人体热舒适环境问题的迫切性和重要性.气候康养是指将人体从有害的气候环境转移到气候条件适宜且利于开展康养的气候康养地,从被动“避害”到主动“趋利”,达到降低疾病风险、增进机体机能和提升健康水平的目的(刘明华,2003;中国气象局公共气象服务中心和中国旅游研究院战略所,2020;林颖仪等,2021).气候康养旅游指数(Tourism Climate Indices,TCIs)是与旅游相关的人体舒适度,旨在表征旅游目的地气候环境状态,综合计量旅行者气候幸福感(Mieczkowski,1985;De Freitas and Grigorieva,2015).国际社会曾多次强调气候与健康相关指标在气候康养产业发展中的重要性,早在2001年世界气象组织(World Meteorological Organization,WMO)气候学委员会的气候与健康工作组就提出将气候与健康相关指标的科学构建作为未来两年的首要工作(WHO,2001).气候康养旅游指数对提升气象部门的服务质量、辅助气候康养目的地决策和促进气候康养产业良性发展具有重要意义(吴昊旻等,2020;卢山等,2021). ...
... 第一阶段,经验公式:20世纪初,学者使用仪器直接测量环境舒适度,如1905年Haldane提出的湿球温度(Wet-bulb thermometer)和1916年Hill提出的卡他度(Kata thermometer)(Haldane,1905;Hill and Hargood-Ash,1919).20世纪20年代开始出现的经验模型是以人类的主观感觉或生理反应为依据,以经验或统计学方法建立的人体舒适模型(Houghten and Yaglou,1923).经验模型包括热环境、冷环境以及普适性环境(闫业超等,2013;孙美淑和李山,2015).1923年Houghton和Yaglou提出了有效温度(Effective Temperature,ET)指数以评估热舒适度,开创了人体气候舒适度经验模型的先河(Houghten and Yaglou,1923).1957年Yaglou和Minard提出了湿球黑球温度指数(Wet Bulb Globe Temperature,WBGT)以预防军事训练中的热损伤事故,WBGT也成为了世界上应用最为广泛的经验热环境评价指数(Yaglou and Minard,1957;孙美淑和李山,2015).人体舒适度经验测度模型在“单设备测量”的基础上由“多要素建模”到“多指数组合”变化,并实现了从“单环境适用”到“环境普适”的演进(孙美淑和李山,2015). ...
... ;孙美淑和李山,2015).人体舒适度经验测度模型在“单设备测量”的基础上由“多要素建模”到“多指数组合”变化,并实现了从“单环境适用”到“环境普适”的演进(孙美淑和李山,2015). ...
... ).人体舒适度经验测度模型在“单设备测量”的基础上由“多要素建模”到“多指数组合”变化,并实现了从“单环境适用”到“环境普适”的演进(孙美淑和李山,2015). ...
1960-2018年四川宜宾气候舒适度变化特征研究
2
2022
... 代数或统计模型是基于经验或统计学方法构建的人体舒适度模型,针对主动或被动的代谢状态,也是对热条件的绝对测量.其典型指数如风寒指数(Wind Chill Index,WCI),是指皮肤温度为33 ℃时皮肤表面的冷却速率,综合考虑了气温和风两种因素,体现了人们在冬天对温度和风速的综合感受(Siple and Passel,1945;王耕等,2022);WCI作为可预知未来的“体感”的指标,一方面有助于及时采取预防风寒的措施,另一方面可以指导人们更加科学、合理地来安排出行、工作和起居.此外还有不适指数(Discomfort Index),用于描述夏季湿热天气对人体的影响,之后进一步修正更名为温湿指数(Temperature Humidity Index,THI),THI通过气温和相对湿度的组合,反映人体对周围环境的热量交换,从而反映在不同气温和相对湿度的组合下人体感到舒适的程度,是目前最常见的舒适度指标之一(Thom,1957;Thom,1959). ...
... 代理热应力和热应变指数是适用于热环境的人体舒适度经验模型,针对主动或被动的代谢状态,包括对热条件的绝对测量和相对测量.其典型指数如预计4 h排汗率(Predicted Four Hour Sweat Rate,P4SR),基于人体的排汗率,综合了气温、湿球温度、风、新陈代谢率及服装热阻等因素,可以很好地表示人体的热负荷状况,常用诺模图预测人体在特定环境下未来4 h的排汗量,单位时间排汗量越多时人体的热负荷越大(McArdle et al.,1947);风效指数(Wind Effect Index,WEI)主要反映人体对风、温度和日照的综合感受,即风速和气温对裸露人体热量散失的影响,综合考虑了气温、风、太阳辐射因素,既考虑了体表的散热,也考虑了太阳辐射后人体的增热,被广泛应用于气候舒适度的评价中(Terjung,1966;Havenith and Fiala,2015;王耕等,2022). ...
天人合一思想对中医养生观的影响
1
2021
... 基于我国传统中医“天人合一,趋利避害”的养生准则,气候康养旅游可以帮助人群消除疲劳、加快康复,使身心趋于最佳状态(刘明华,2003;王乐和汪荣斌,2021).随着气候康养旅游的日益盛行,国内外学者构建了大量的气候康养指标(Mieczkowski,1985;Morgan et al.,2000;De Freitas et al.,2008;Tang et al.,2012;吴普,2014;Scott et al.,2016;Zhu et al.,2021).由于我国地域广阔,有多种气候类型的气候康养研究受到广泛关注,但存在以下问题需进一步探讨: ...
1951—2008年中国主要城市风效指数的时空变化趋势
1
2012
... 中英文文献共检索1 852篇,发表于1979—2023年;英文文献共检索9 662篇,发表于1980—2023年.(1)关键词共现分析显示,英文研究主题以旅游满意度、竞争力、海滩、岛屿、生物多样性和气候适宜度等为主[图1(a)];中国学者对气候康养的关注程度较高,中文研究主题以人体舒适度、气候舒适度和康养旅游等为主[图1(b)].气候舒适度的内涵是客观反映气候的舒适程度,而人体舒适度的内涵是反映人体主观感受的舒适程度,气候康养旅游指数则是人体舒适度在康养旅游中的应用,反映康养旅游目的地人体热舒适程度.关键词共现分析显示英文研究中关注度较高的指数为通用热气候指数(Universal Thermal Climate Index,UTCI)和湿球温度(Wet Bulb Temperature,WBT),中文研究中关注度较高的指数为风效指数(Wind Effect Index,WEI)、温湿指数(Temperature Humidity Index,THI)和风寒指数(Wind Chill Index,WCI).(2)作者共现分析显示,英文研究作者以Rob Law(Han et al.,2021;Liao et al.,2022)、Jie Zhang(Nian et al.,2019;Liu et al.,2022)和Daniel Scott(Scott and McBoyle,2001;Rutty and Scott,2015;Scott et al.,2016)等人为主;中文研究作者以孙根年、马丽君、王式功和张京红等人在气候康养方向影响力大(马丽君等,2007;孙根年和马丽君,2007;王敏珍等,2012;卢山等,2021;林颖仪等,2021;孙根年,2022;张京红等,2022;张明洁等,2022).(3)发文量前十机构分析显示(表1),英文研究以中国科学院、乌克兰教育科学部、香港理工大学、中国科学院大学和美国佛罗里达州立大学发文量最多;中文研究以南京信息工程大学、陕西师范大学、华东师范大学、成都信息工程大学和同济大学发文量最多.此外,Daniel Scott所属的加拿大滑铁卢大学发表了41篇相关研究被引2 062次,被引量位于第六,也是该领域重要的研究机构. ...
1
2013
... Typical indicators of human comfort
Tab.2 | 分类 | 指数名称 | 缩写 | 研究 | 地理与气象因子 | 人体代谢、服装热阻及其他 | 是否经过验证 |
| 测量拟合及单传感器指数 | 卡他度 | — | Hill et al.,1916 | 气温、风、湿度、长波辐射 | — | 否 |
| 空气温度 | Ta | Macpherson,1962 | 气温 | — | 否 |
| 湿球温度 | WBT | Haldane,1905 | 湿球温度、环境气压 | — | 否 |
| 代数或统计模型 | 风寒指数 | WCI | Siple and Passel,1945 | 气温、风 | — | 否 |
| 温湿指数 | THI | Thom,1959 | 气温、湿度 | — | 是 |
| 综合舒适度指标 | CCI | 陆鼎煌等,1984 | 气温、湿度、风 | — | 否 |
| 基于“黄金分割法”的人体舒适度指数 | — | 王式功等,2013 | 气温、风、湿度、海拔、纬度 | — | 是 |
| 代理热应力和热应变指数 | 生理效应指标 | Ep | Robinson et al.,1945 | 气温、湿度 | 服装、代谢率、心率、直肠温度、皮肤温度、出汗率 | 是 |
| 预计四小时排汗率 | P4SR | McArdle et al.,1947 | 气温、湿球温度、风 | 服装、代谢率、与适应者相关 | 是 |
| 有效温度 | ET | Houghten and Yaglou,1923 | 气温、湿球温度、风 | 服装 | 是 |
| 风效指数 | WEI | Terjung,1966 | 气温、风、太阳辐射 | — | 否 |
| 能量平衡应变和应力指数 | 皮肤温度能量平衡指数 | STEBIDEX | De Freitas,1985;De Freitas,1986;De Freitas,1987 | 气温、风、湿度、长波辐射、太阳辐射 | 服装、代谢率 | 是 |
| 热力感受比 | TAR | Ionides et al.,1945 | 气温、平均辐射温度、湿度 | 代谢率 | 是 |
| 通用热气候指数 | UTCI | Jendritzky et al.,2009 | 气温、湿度、风、太阳辐射、长波辐射 | 服装、代谢率 | 是 |
| 生理等效温度 | PET | Mayer and Höppe,1987 | 气温、平均辐射温度、湿度、风 | 服装、代谢率 | 是 |
| 特定用途指数 | 热适应预测效应 | PEHA | Givoni and Goldman,1973b | 气温、湿度 | 代谢率、直肠温度、心率 | 是 |
| 生物气候距离指数 | BDI | Mateeva and Filipov,2003 | 气温、湿度、风、太阳辐射、长波辐射 | 代谢率 | 否 |
注: “—”表示“无”. ...
旅游气候舒适性评价: 模型优化与中国案例
1
2021
... 典型的综合性气候康养旅游指数如Mieczkowski(1985)构建的第一个气候康养旅游指数(Tourism Climate Index,TCI),是衡量游客气候福祉的综合指标,其综合考虑了温度、湿度、风、降水、日照等气象因子,被广泛应用于评估特定气候对观光和购物等一般旅游活动的适宜性;2008年De Freitas等(2008)构建了第二代气候旅游指数(Climate Index for Tourism,CIT),综合考虑了生理、心理和物理3个维度的影响,优化了大气环境参数组合,提升了数值精度,得到了较好的应用.国内有学者(张富现,2015;蔚丹丹等,2021)将TCI翻译为旅游气候指数,在中医传统康养理念的背景和指导下,本文将其翻译为气候康养旅游指数更为贴切. ...
浙江丽水市度假气候适宜度评价
1
2020
... 人体舒适度是从气象角度评价不同气候条件下人体的舒适状态,根据机体与大气环境之间的热交换制定的生物气象指标(孙美淑和李山,2015).过去一百年中,国内外研发了大量的人体舒适度指标,足见量化人体热舒适环境问题的迫切性和重要性.气候康养是指将人体从有害的气候环境转移到气候条件适宜且利于开展康养的气候康养地,从被动“避害”到主动“趋利”,达到降低疾病风险、增进机体机能和提升健康水平的目的(刘明华,2003;中国气象局公共气象服务中心和中国旅游研究院战略所,2020;林颖仪等,2021).气候康养旅游指数(Tourism Climate Indices,TCIs)是与旅游相关的人体舒适度,旨在表征旅游目的地气候环境状态,综合计量旅行者气候幸福感(Mieczkowski,1985;De Freitas and Grigorieva,2015).国际社会曾多次强调气候与健康相关指标在气候康养产业发展中的重要性,早在2001年世界气象组织(World Meteorological Organization,WMO)气候学委员会的气候与健康工作组就提出将气候与健康相关指标的科学构建作为未来两年的首要工作(WHO,2001).气候康养旅游指数对提升气象部门的服务质量、辅助气候康养目的地决策和促进气候康养产业良性发展具有重要意义(吴昊旻等,2020;卢山等,2021). ...
中国城市避暑旅游发展研究
2
2014
... 避暑旅游指数(Tourist Satisfaction Index,TSI)旨在评估旅游目的地发展避暑旅游的条件,综合考虑了气温、湿度、风和空气质量等气象因子,一方面广泛应用于协助游客选择避暑旅游目的地,另一方面也为目的地避暑旅游的发展与提升提供管理工具(吴普,2014;吴普等,2014).旅游气候适宜性指数(Tourism Climate Suitability Index,TCSI)用于评估高原地区旅游气候适应性,包含温度、湿度、日照、太阳辐射、氧含量和大气压力等气象因子,对气候条件复杂的旅游目的地具有重要的科学意义和实用指导价值(Tang et al.,2012).评估滨海地区气候康养条件的典型指数如海滩气候指数(Beach Climate Index,BCI)和滨海旅游气候指数(Coastal Tourism Climate Index,CTCI),包括降水、日照和风速等气象因子,有助于提高滨海旅游城市的吸引力和可持续发展(Morgan et al.,2000;Gao et al.,2022).森林综合保健指数(Forest Comprehensive Healthcare Index,FCHI)是评估森林康养效益的典型指数,包含氧含量、空气质量等因子,不仅可以为森林治疗的时间和目的地提供必要的选择依据,还可以为森林健康效益的综合评价提供理论依据,有助于今后对森林健康环境的深入研究(Zhu et al.,2021). ...
... 基于我国传统中医“天人合一,趋利避害”的养生准则,气候康养旅游可以帮助人群消除疲劳、加快康复,使身心趋于最佳状态(刘明华,2003;王乐和汪荣斌,2021).随着气候康养旅游的日益盛行,国内外学者构建了大量的气候康养指标(Mieczkowski,1985;Morgan et al.,2000;De Freitas et al.,2008;Tang et al.,2012;吴普,2014;Scott et al.,2016;Zhu et al.,2021).由于我国地域广阔,有多种气候类型的气候康养研究受到广泛关注,但存在以下问题需进一步探讨: ...
避暑旅游指数概念模型及评价指标体系构建
2
2014
... Typical indicators of tourism climate indices
Tab.3 | 分类 | 指标名称 | 缩写 | 研究 | 地理与气象因子 | 人体代谢、服装热阻及其他 | 验证与否 |
| 综合 | 度假气候指数:城市 | HCI:Urban | Scott et al.,2016 | 温度、湿度、风、降水、云量 | — | 是 |
| 气候康养旅游指数 | TCI | Mieczkowski,1985 | 温度、湿度、风、降水、日照 | — | 是 |
| 气候旅游指数 | CIT | De Freitas et al.,2008 | 云量、风、降水 | — | 是 |
| 避暑 | 避暑旅游指数 | TSI | 吴普等,2014 | 气温、湿度、风、空气质量 | — | 否 |
| 避暑旅游气象指数 | MIST | 侯亚红等,2018 | 温度、湿度、风、降水、日照、空气质量 | — | 是 |
| 高原 | 旅游气候适宜性指数 | TCSI | Tang et al.,2012 | 温度、湿度、日照、太阳辐射、氧含量、大气压力 | — | 否 |
| 喀斯特洞穴康养功能指数 | IKCH | 贾真真等,2019 | 气温、湿度、风、空气质量、空气离子 | — | 是 |
| 海滨 | 海滩气候指数 | BCI | Morgan et al.,2000 | 降水、风、日照 | 感觉温度、沐浴温度 | 是 |
| 滨海旅游气候指数 | CTCI | Gao et al.,2022 | 温度、湿度、风、降水、日照、空气质量 | — | 是 |
| 森林 | 森林综合保健指数 | FCHI | Zhu et al.,2021 | 氧含量、空气质量 | — | 是 |
| 森林康养指数 | FHI | 郑自君等,2021 | 温度、湿度、空气质量、海拔 | — | 是 |
注: “—”表示“无”. ...
... 避暑旅游指数(Tourist Satisfaction Index,TSI)旨在评估旅游目的地发展避暑旅游的条件,综合考虑了气温、湿度、风和空气质量等气象因子,一方面广泛应用于协助游客选择避暑旅游目的地,另一方面也为目的地避暑旅游的发展与提升提供管理工具(吴普,2014;吴普等,2014).旅游气候适宜性指数(Tourism Climate Suitability Index,TCSI)用于评估高原地区旅游气候适应性,包含温度、湿度、日照、太阳辐射、氧含量和大气压力等气象因子,对气候条件复杂的旅游目的地具有重要的科学意义和实用指导价值(Tang et al.,2012).评估滨海地区气候康养条件的典型指数如海滩气候指数(Beach Climate Index,BCI)和滨海旅游气候指数(Coastal Tourism Climate Index,CTCI),包括降水、日照和风速等气象因子,有助于提高滨海旅游城市的吸引力和可持续发展(Morgan et al.,2000;Gao et al.,2022).森林综合保健指数(Forest Comprehensive Healthcare Index,FCHI)是评估森林康养效益的典型指数,包含氧含量、空气质量等因子,不仅可以为森林治疗的时间和目的地提供必要的选择依据,还可以为森林健康效益的综合评价提供理论依据,有助于今后对森林健康环境的深入研究(Zhu et al.,2021). ...
气温对秦皇岛市儿童呼吸系统疾病的影响
1
2021
... 研究显示气温在气候康养指标中所占的权重最高,是目前气候康养指标构建的核心考量因子,其次为降水和日照(Blazejczyk,2001;Brandenburg and Arnberger,2001;Scott and McBoyle,2001).然而,大气污染是影响人体健康的重要危险因素(Song et al.,2022;Ziou et al.,2022).全球疾病负担(Global Burden of Disease,GBD)研究显示,空气污染是全球第四大死亡风险因素(GBD 2019 Diseases and Injuries Collaborators,2020).冬季气温寒冷,此时气温对健康的影响大于污染,尤其对于老年人及高血压等慢性病患者(GBD 2019 Diseases and Injuries Collaborators,2020;陈蕾等,2021;黄开龙等,2021;徐静等,2021).此外,大量研究表明气温和大气污染之间存在协同效应,增加心血管及呼吸系统疾病等发病的风险(Chen et al.,2017;Li et al.,2017;刘楚薇等,2020;Anenberg et al.,2020;Song et al.,2021).建议未来在构建气候康养指标的过程中,纳入简易可得的空气质量指数,探究气温和污染的协同效应,以提升指标的科学性和准确性. ...
国内外气候舒适度评价研究进展
2
2013
... 第一阶段,经验公式:20世纪初,学者使用仪器直接测量环境舒适度,如1905年Haldane提出的湿球温度(Wet-bulb thermometer)和1916年Hill提出的卡他度(Kata thermometer)(Haldane,1905;Hill and Hargood-Ash,1919).20世纪20年代开始出现的经验模型是以人类的主观感觉或生理反应为依据,以经验或统计学方法建立的人体舒适模型(Houghten and Yaglou,1923).经验模型包括热环境、冷环境以及普适性环境(闫业超等,2013;孙美淑和李山,2015).1923年Houghton和Yaglou提出了有效温度(Effective Temperature,ET)指数以评估热舒适度,开创了人体气候舒适度经验模型的先河(Houghten and Yaglou,1923).1957年Yaglou和Minard提出了湿球黑球温度指数(Wet Bulb Globe Temperature,WBGT)以预防军事训练中的热损伤事故,WBGT也成为了世界上应用最为广泛的经验热环境评价指数(Yaglou and Minard,1957;孙美淑和李山,2015).人体舒适度经验测度模型在“单设备测量”的基础上由“多要素建模”到“多指数组合”变化,并实现了从“单环境适用”到“环境普适”的演进(孙美淑和李山,2015). ...
... 测量拟合及单传感器指数是早期常用仪器直接观测的结果来评定环境舒适度的产物,针对被动的代谢状态,是对热条件的绝对测量,包括卡他度(Kata thermometer)、湿球温度(Wet Bulb Temperature,WBT)等.卡他度指被加热到36.5 ℃时的卡他温度计的液球在单位时间、单位面积上所散发的热量,其综合考虑了气温、风、湿度、长波辐射4个因素的影响,可以反映温度、湿度和风速3者的综合散热效果,用来评价劳动条件的舒适程度(Hill et al.,1916;郭伏和钱省三,2006),被广泛应用于矿井作业、办公室舒适度测量、人体的热交换与平衡等领域,是最具影响力的仪器测定指标(闫业超等,2013;Hill and Hargood-Ash,1919);湿球温度(Wet Bulb Temperature,WBT)指湿空气的绝热饱和温度,综合表示了热环境的温度和湿度,是描述人体能量调节的相关变量,适用于温暖天气和热带高温影响及某些工业职业相关问题的研究(Haldane,1905; Dong et al.,2022). ...
吉林省消夏旅游期气候条件及舒适度分析
1
2018
... 综上所述,人体舒适度指标主要由气温、风、湿度等气象因子和服装热阻及代谢率等构成,旨在反映人体对环境舒适度的感受.而气候康养旅游指数不仅涵盖了气象因子的温度因素(气温和湿度等)、物理因素(风和降水等)和审美因素(日照和云量等),还考虑了空气质量、氧含量等康养因素,旨在综合评估旅游活动的适宜性和旅行者气候康养的效果.由于康养地气候及地形特征的差异,其适宜的气候康养类型不同,避暑、海滨、森林和高原等多类型气候康养旅游指数逐渐诞生,指标因子构成也更加全面,使得气候康养旅游指数的科学性和实用性不断加强(杨雪艳等,2018). ...
贵州省黔西南州四季康养气候资源研究
1
2022
... 根据《气候康养地评价》团体标准(中国气象局公共气象服务中心和中国旅游研究院战略所,2020)典型康养气候分型,结合康养地的气候和地形特征,将气候康养旅游指数分为综合(如旅游气候指数等)、避暑(如避暑旅游指数)、高原(如旅游气候适宜性指数)、海滨(如海滩气候指数)和森林(如森林综合保健指数)等(于飞等,2022).为系统梳理国内外气候康养旅游指数,在以往研究中通过系统检索PubMed、Web of Science、Embase、中国知网和中国生物医学文献数据库,筛选纳入气候康养旅游指数共41个:其中综合性指标最多,有24个指数,占比58.5%,避暑指数7个(占比17.1%),海滨和高原指数均为4个(占比均为9.8%)、森林指数最少为2个(占比4.9%),表3列出不同气候康养指数类型的典型指数. ...
旅游气候舒适度数值评价指标体系研究
1
2015
... 典型的综合性气候康养旅游指数如Mieczkowski(1985)构建的第一个气候康养旅游指数(Tourism Climate Index,TCI),是衡量游客气候福祉的综合指标,其综合考虑了温度、湿度、风、降水、日照等气象因子,被广泛应用于评估特定气候对观光和购物等一般旅游活动的适宜性;2008年De Freitas等(2008)构建了第二代气候旅游指数(Climate Index for Tourism,CIT),综合考虑了生理、心理和物理3个维度的影响,优化了大气环境参数组合,提升了数值精度,得到了较好的应用.国内有学者(张富现,2015;蔚丹丹等,2021)将TCI翻译为旅游气候指数,在中医传统康养理念的背景和指导下,本文将其翻译为气候康养旅游指数更为贴切. ...
海南气候康养指数的构建及评估
1
2022
... 中英文文献共检索1 852篇,发表于1979—2023年;英文文献共检索9 662篇,发表于1980—2023年.(1)关键词共现分析显示,英文研究主题以旅游满意度、竞争力、海滩、岛屿、生物多样性和气候适宜度等为主[图1(a)];中国学者对气候康养的关注程度较高,中文研究主题以人体舒适度、气候舒适度和康养旅游等为主[图1(b)].气候舒适度的内涵是客观反映气候的舒适程度,而人体舒适度的内涵是反映人体主观感受的舒适程度,气候康养旅游指数则是人体舒适度在康养旅游中的应用,反映康养旅游目的地人体热舒适程度.关键词共现分析显示英文研究中关注度较高的指数为通用热气候指数(Universal Thermal Climate Index,UTCI)和湿球温度(Wet Bulb Temperature,WBT),中文研究中关注度较高的指数为风效指数(Wind Effect Index,WEI)、温湿指数(Temperature Humidity Index,THI)和风寒指数(Wind Chill Index,WCI).(2)作者共现分析显示,英文研究作者以Rob Law(Han et al.,2021;Liao et al.,2022)、Jie Zhang(Nian et al.,2019;Liu et al.,2022)和Daniel Scott(Scott and McBoyle,2001;Rutty and Scott,2015;Scott et al.,2016)等人为主;中文研究作者以孙根年、马丽君、王式功和张京红等人在气候康养方向影响力大(马丽君等,2007;孙根年和马丽君,2007;王敏珍等,2012;卢山等,2021;林颖仪等,2021;孙根年,2022;张京红等,2022;张明洁等,2022).(3)发文量前十机构分析显示(表1),英文研究以中国科学院、乌克兰教育科学部、香港理工大学、中国科学院大学和美国佛罗里达州立大学发文量最多;中文研究以南京信息工程大学、陕西师范大学、华东师范大学、成都信息工程大学和同济大学发文量最多.此外,Daniel Scott所属的加拿大滑铁卢大学发表了41篇相关研究被引2 062次,被引量位于第六,也是该领域重要的研究机构. ...
海南五指山市的气候特征及其康养资源分析
1
2022
... 中英文文献共检索1 852篇,发表于1979—2023年;英文文献共检索9 662篇,发表于1980—2023年.(1)关键词共现分析显示,英文研究主题以旅游满意度、竞争力、海滩、岛屿、生物多样性和气候适宜度等为主[图1(a)];中国学者对气候康养的关注程度较高,中文研究主题以人体舒适度、气候舒适度和康养旅游等为主[图1(b)].气候舒适度的内涵是客观反映气候的舒适程度,而人体舒适度的内涵是反映人体主观感受的舒适程度,气候康养旅游指数则是人体舒适度在康养旅游中的应用,反映康养旅游目的地人体热舒适程度.关键词共现分析显示英文研究中关注度较高的指数为通用热气候指数(Universal Thermal Climate Index,UTCI)和湿球温度(Wet Bulb Temperature,WBT),中文研究中关注度较高的指数为风效指数(Wind Effect Index,WEI)、温湿指数(Temperature Humidity Index,THI)和风寒指数(Wind Chill Index,WCI).(2)作者共现分析显示,英文研究作者以Rob Law(Han et al.,2021;Liao et al.,2022)、Jie Zhang(Nian et al.,2019;Liu et al.,2022)和Daniel Scott(Scott and McBoyle,2001;Rutty and Scott,2015;Scott et al.,2016)等人为主;中文研究作者以孙根年、马丽君、王式功和张京红等人在气候康养方向影响力大(马丽君等,2007;孙根年和马丽君,2007;王敏珍等,2012;卢山等,2021;林颖仪等,2021;孙根年,2022;张京红等,2022;张明洁等,2022).(3)发文量前十机构分析显示(表1),英文研究以中国科学院、乌克兰教育科学部、香港理工大学、中国科学院大学和美国佛罗里达州立大学发文量最多;中文研究以南京信息工程大学、陕西师范大学、华东师范大学、成都信息工程大学和同济大学发文量最多.此外,Daniel Scott所属的加拿大滑铁卢大学发表了41篇相关研究被引2 062次,被引量位于第六,也是该领域重要的研究机构. ...
成都市不同温度段对呼吸和心脑血管疾病死亡影响的归因风险评估
1
2019
... 近年来全球范围内开展了关于气象因素健康影响的研究,探究了适宜气候条件下降低的疾病风险,发现低浓度的空气污染暴露、低湿度、风速和气压等气象因子与循环及呼吸系统疾病等存在正相关,而适宜的气温、湿度、风速和气压等气象条件可以降低疾病风险(Brauer et al.,2019;张莹等,2019;骆学勤等,2021;李欣和刘桃成,2022;Brauer et al.,2022).基于气温等环境暴露风险评估模型,揭示不同气候康养地的最适气温阈值,量化趋利康养效应,评估疾病风险是未来该领域研究的重点.未来需进一步开展气候康养效应风险评估研究,通过不同区域和人群暴露风险评估模型等的研发,分析气候康养地适宜气温、优良空气和舒适环境降低的疾病风险,量化气候康养降低的疾病风险,为气候康养产业的可持续发展提供理论支持. ...
攀西地区森林康养指数综合分析
1
2021
... Typical indicators of tourism climate indices
Tab.3 | 分类 | 指标名称 | 缩写 | 研究 | 地理与气象因子 | 人体代谢、服装热阻及其他 | 验证与否 |
| 综合 | 度假气候指数:城市 | HCI:Urban | Scott et al.,2016 | 温度、湿度、风、降水、云量 | — | 是 |
| 气候康养旅游指数 | TCI | Mieczkowski,1985 | 温度、湿度、风、降水、日照 | — | 是 |
| 气候旅游指数 | CIT | De Freitas et al.,2008 | 云量、风、降水 | — | 是 |
| 避暑 | 避暑旅游指数 | TSI | 吴普等,2014 | 气温、湿度、风、空气质量 | — | 否 |
| 避暑旅游气象指数 | MIST | 侯亚红等,2018 | 温度、湿度、风、降水、日照、空气质量 | — | 是 |
| 高原 | 旅游气候适宜性指数 | TCSI | Tang et al.,2012 | 温度、湿度、日照、太阳辐射、氧含量、大气压力 | — | 否 |
| 喀斯特洞穴康养功能指数 | IKCH | 贾真真等,2019 | 气温、湿度、风、空气质量、空气离子 | — | 是 |
| 海滨 | 海滩气候指数 | BCI | Morgan et al.,2000 | 降水、风、日照 | 感觉温度、沐浴温度 | 是 |
| 滨海旅游气候指数 | CTCI | Gao et al.,2022 | 温度、湿度、风、降水、日照、空气质量 | — | 是 |
| 森林 | 森林综合保健指数 | FCHI | Zhu et al.,2021 | 氧含量、空气质量 | — | 是 |
| 森林康养指数 | FHI | 郑自君等,2021 | 温度、湿度、空气质量、海拔 | — | 是 |
注: “—”表示“无”. ...
1
2020
... 根据《气候康养地评价》团体标准(中国气象局公共气象服务中心和中国旅游研究院战略所,2020)典型康养气候分型,结合康养地的气候和地形特征,将气候康养旅游指数分为综合(如旅游气候指数等)、避暑(如避暑旅游指数)、高原(如旅游气候适宜性指数)、海滨(如海滩气候指数)和森林(如森林综合保健指数)等(于飞等,2022).为系统梳理国内外气候康养旅游指数,在以往研究中通过系统检索PubMed、Web of Science、Embase、中国知网和中国生物医学文献数据库,筛选纳入气候康养旅游指数共41个:其中综合性指标最多,有24个指数,占比58.5%,避暑指数7个(占比17.1%),海滨和高原指数均为4个(占比均为9.8%)、森林指数最少为2个(占比4.9%),表3列出不同气候康养指数类型的典型指数. ...
Synergistic health effects of air pollution, temperature, and pollen exposure: a systematic review of epidemiological evidence
1
2020
... 研究显示气温在气候康养指标中所占的权重最高,是目前气候康养指标构建的核心考量因子,其次为降水和日照(Blazejczyk,2001;Brandenburg and Arnberger,2001;Scott and McBoyle,2001).然而,大气污染是影响人体健康的重要危险因素(Song et al.,2022;Ziou et al.,2022).全球疾病负担(Global Burden of Disease,GBD)研究显示,空气污染是全球第四大死亡风险因素(GBD 2019 Diseases and Injuries Collaborators,2020).冬季气温寒冷,此时气温对健康的影响大于污染,尤其对于老年人及高血压等慢性病患者(GBD 2019 Diseases and Injuries Collaborators,2020;陈蕾等,2021;黄开龙等,2021;徐静等,2021).此外,大量研究表明气温和大气污染之间存在协同效应,增加心血管及呼吸系统疾病等发病的风险(Chen et al.,2017;Li et al.,2017;刘楚薇等,2020;Anenberg et al.,2020;Song et al.,2021).建议未来在构建气候康养指标的过程中,纳入简易可得的空气质量指数,探究气温和污染的协同效应,以提升指标的科学性和准确性. ...
An introduction to the universal thermal climate index (UTCI)
1
2013
... 能量平衡应变和应力指数基于人体与环境热交换理论,针对主动或被动的代谢状态,大部分是对热条件的绝对测量,如通用热气候指数(Universal Thermal Climate Index,UTCI),在国际生物气象学会(International Society of Biometeorology,ISB)和欧洲科技与技术发展合作行动(Cooperation in Science and Technology,COST)730号行动的倡议下,由多学科专家合作构建,是指引起与实际条件相同的模型响应的参考条件的空气温度(Air temperature,Ta)(Blazejczyk et al.,2013;Jendritzky et al.,2012),综合了气温、湿度、风、太阳辐射、长波辐射、服装、代谢率7个因素,被广泛应用于公共气象局、公共卫生服务、预防性规划和气候影响研究中,是当前考虑因素最全面、最具普适性的机理模型(Havenith and Fiala,2015). ...
Assessment of recreational potential of bioclimate based on the human heat balance
1
2001
... 研究显示气温在气候康养指标中所占的权重最高,是目前气候康养指标构建的核心考量因子,其次为降水和日照(Blazejczyk,2001;Brandenburg and Arnberger,2001;Scott and McBoyle,2001).然而,大气污染是影响人体健康的重要危险因素(Song et al.,2022;Ziou et al.,2022).全球疾病负担(Global Burden of Disease,GBD)研究显示,空气污染是全球第四大死亡风险因素(GBD 2019 Diseases and Injuries Collaborators,2020).冬季气温寒冷,此时气温对健康的影响大于污染,尤其对于老年人及高血压等慢性病患者(GBD 2019 Diseases and Injuries Collaborators,2020;陈蕾等,2021;黄开龙等,2021;徐静等,2021).此外,大量研究表明气温和大气污染之间存在协同效应,增加心血管及呼吸系统疾病等发病的风险(Chen et al.,2017;Li et al.,2017;刘楚薇等,2020;Anenberg et al.,2020;Song et al.,2021).建议未来在构建气候康养指标的过程中,纳入简易可得的空气质量指数,探究气温和污染的协同效应,以提升指标的科学性和准确性. ...
The influence of the weather upon recreation activities
1
2001
... 研究显示气温在气候康养指标中所占的权重最高,是目前气候康养指标构建的核心考量因子,其次为降水和日照(Blazejczyk,2001;Brandenburg and Arnberger,2001;Scott and McBoyle,2001).然而,大气污染是影响人体健康的重要危险因素(Song et al.,2022;Ziou et al.,2022).全球疾病负担(Global Burden of Disease,GBD)研究显示,空气污染是全球第四大死亡风险因素(GBD 2019 Diseases and Injuries Collaborators,2020).冬季气温寒冷,此时气温对健康的影响大于污染,尤其对于老年人及高血压等慢性病患者(GBD 2019 Diseases and Injuries Collaborators,2020;陈蕾等,2021;黄开龙等,2021;徐静等,2021).此外,大量研究表明气温和大气污染之间存在协同效应,增加心血管及呼吸系统疾病等发病的风险(Chen et al.,2017;Li et al.,2017;刘楚薇等,2020;Anenberg et al.,2020;Song et al.,2021).建议未来在构建气候康养指标的过程中,纳入简易可得的空气质量指数,探究气温和污染的协同效应,以提升指标的科学性和准确性. ...
Mortality-air pollution associations in low exposure environments (MAPLE): phase 2
1
2022
... 近年来全球范围内开展了关于气象因素健康影响的研究,探究了适宜气候条件下降低的疾病风险,发现低浓度的空气污染暴露、低湿度、风速和气压等气象因子与循环及呼吸系统疾病等存在正相关,而适宜的气温、湿度、风速和气压等气象条件可以降低疾病风险(Brauer et al.,2019;张莹等,2019;骆学勤等,2021;李欣和刘桃成,2022;Brauer et al.,2022).基于气温等环境暴露风险评估模型,揭示不同气候康养地的最适气温阈值,量化趋利康养效应,评估疾病风险是未来该领域研究的重点.未来需进一步开展气候康养效应风险评估研究,通过不同区域和人群暴露风险评估模型等的研发,分析气候康养地适宜气温、优良空气和舒适环境降低的疾病风险,量化气候康养降低的疾病风险,为气候康养产业的可持续发展提供理论支持. ...
Mortality-air pollution associations in low-exposure environments (MAPLE): phase 1
1
2019
... 近年来全球范围内开展了关于气象因素健康影响的研究,探究了适宜气候条件下降低的疾病风险,发现低浓度的空气污染暴露、低湿度、风速和气压等气象因子与循环及呼吸系统疾病等存在正相关,而适宜的气温、湿度、风速和气压等气象条件可以降低疾病风险(Brauer et al.,2019;张莹等,2019;骆学勤等,2021;李欣和刘桃成,2022;Brauer et al.,2022).基于气温等环境暴露风险评估模型,揭示不同气候康养地的最适气温阈值,量化趋利康养效应,评估疾病风险是未来该领域研究的重点.未来需进一步开展气候康养效应风险评估研究,通过不同区域和人群暴露风险评估模型等的研发,分析气候康养地适宜气温、优良空气和舒适环境降低的疾病风险,量化气候康养降低的疾病风险,为气候康养产业的可持续发展提供理论支持. ...
Does temperature modify the effect of PM10 on mortality? A systematic review and meta-analysis
1
2017
... 研究显示气温在气候康养指标中所占的权重最高,是目前气候康养指标构建的核心考量因子,其次为降水和日照(Blazejczyk,2001;Brandenburg and Arnberger,2001;Scott and McBoyle,2001).然而,大气污染是影响人体健康的重要危险因素(Song et al.,2022;Ziou et al.,2022).全球疾病负担(Global Burden of Disease,GBD)研究显示,空气污染是全球第四大死亡风险因素(GBD 2019 Diseases and Injuries Collaborators,2020).冬季气温寒冷,此时气温对健康的影响大于污染,尤其对于老年人及高血压等慢性病患者(GBD 2019 Diseases and Injuries Collaborators,2020;陈蕾等,2021;黄开龙等,2021;徐静等,2021).此外,大量研究表明气温和大气污染之间存在协同效应,增加心血管及呼吸系统疾病等发病的风险(Chen et al.,2017;Li et al.,2017;刘楚薇等,2020;Anenberg et al.,2020;Song et al.,2021).建议未来在构建气候康养指标的过程中,纳入简易可得的空气质量指数,探究气温和污染的协同效应,以提升指标的科学性和准确性. ...
Assessment of human bioclimate based on thermal response
1
1985
... Typical indicators of human comfort
Tab.2 | 分类 | 指数名称 | 缩写 | 研究 | 地理与气象因子 | 人体代谢、服装热阻及其他 | 是否经过验证 |
| 测量拟合及单传感器指数 | 卡他度 | — | Hill et al.,1916 | 气温、风、湿度、长波辐射 | — | 否 |
| 空气温度 | Ta | Macpherson,1962 | 气温 | — | 否 |
| 湿球温度 | WBT | Haldane,1905 | 湿球温度、环境气压 | — | 否 |
| 代数或统计模型 | 风寒指数 | WCI | Siple and Passel,1945 | 气温、风 | — | 否 |
| 温湿指数 | THI | Thom,1959 | 气温、湿度 | — | 是 |
| 综合舒适度指标 | CCI | 陆鼎煌等,1984 | 气温、湿度、风 | — | 否 |
| 基于“黄金分割法”的人体舒适度指数 | — | 王式功等,2013 | 气温、风、湿度、海拔、纬度 | — | 是 |
| 代理热应力和热应变指数 | 生理效应指标 | Ep | Robinson et al.,1945 | 气温、湿度 | 服装、代谢率、心率、直肠温度、皮肤温度、出汗率 | 是 |
| 预计四小时排汗率 | P4SR | McArdle et al.,1947 | 气温、湿球温度、风 | 服装、代谢率、与适应者相关 | 是 |
| 有效温度 | ET | Houghten and Yaglou,1923 | 气温、湿球温度、风 | 服装 | 是 |
| 风效指数 | WEI | Terjung,1966 | 气温、风、太阳辐射 | — | 否 |
| 能量平衡应变和应力指数 | 皮肤温度能量平衡指数 | STEBIDEX | De Freitas,1985;De Freitas,1986;De Freitas,1987 | 气温、风、湿度、长波辐射、太阳辐射 | 服装、代谢率 | 是 |
| 热力感受比 | TAR | Ionides et al.,1945 | 气温、平均辐射温度、湿度 | 代谢率 | 是 |
| 通用热气候指数 | UTCI | Jendritzky et al.,2009 | 气温、湿度、风、太阳辐射、长波辐射 | 服装、代谢率 | 是 |
| 生理等效温度 | PET | Mayer and Höppe,1987 | 气温、平均辐射温度、湿度、风 | 服装、代谢率 | 是 |
| 特定用途指数 | 热适应预测效应 | PEHA | Givoni and Goldman,1973b | 气温、湿度 | 代谢率、直肠温度、心率 | 是 |
| 生物气候距离指数 | BDI | Mateeva and Filipov,2003 | 气温、湿度、风、太阳辐射、长波辐射 | 代谢率 | 否 |
注: “—”表示“无”. ...
Human thermal climates of New Zealand
1
1986
... Typical indicators of human comfort
Tab.2 | 分类 | 指数名称 | 缩写 | 研究 | 地理与气象因子 | 人体代谢、服装热阻及其他 | 是否经过验证 |
| 测量拟合及单传感器指数 | 卡他度 | — | Hill et al.,1916 | 气温、风、湿度、长波辐射 | — | 否 |
| 空气温度 | Ta | Macpherson,1962 | 气温 | — | 否 |
| 湿球温度 | WBT | Haldane,1905 | 湿球温度、环境气压 | — | 否 |
| 代数或统计模型 | 风寒指数 | WCI | Siple and Passel,1945 | 气温、风 | — | 否 |
| 温湿指数 | THI | Thom,1959 | 气温、湿度 | — | 是 |
| 综合舒适度指标 | CCI | 陆鼎煌等,1984 | 气温、湿度、风 | — | 否 |
| 基于“黄金分割法”的人体舒适度指数 | — | 王式功等,2013 | 气温、风、湿度、海拔、纬度 | — | 是 |
| 代理热应力和热应变指数 | 生理效应指标 | Ep | Robinson et al.,1945 | 气温、湿度 | 服装、代谢率、心率、直肠温度、皮肤温度、出汗率 | 是 |
| 预计四小时排汗率 | P4SR | McArdle et al.,1947 | 气温、湿球温度、风 | 服装、代谢率、与适应者相关 | 是 |
| 有效温度 | ET | Houghten and Yaglou,1923 | 气温、湿球温度、风 | 服装 | 是 |
| 风效指数 | WEI | Terjung,1966 | 气温、风、太阳辐射 | — | 否 |
| 能量平衡应变和应力指数 | 皮肤温度能量平衡指数 | STEBIDEX | De Freitas,1985;De Freitas,1986;De Freitas,1987 | 气温、风、湿度、长波辐射、太阳辐射 | 服装、代谢率 | 是 |
| 热力感受比 | TAR | Ionides et al.,1945 | 气温、平均辐射温度、湿度 | 代谢率 | 是 |
| 通用热气候指数 | UTCI | Jendritzky et al.,2009 | 气温、湿度、风、太阳辐射、长波辐射 | 服装、代谢率 | 是 |
| 生理等效温度 | PET | Mayer and Höppe,1987 | 气温、平均辐射温度、湿度、风 | 服装、代谢率 | 是 |
| 特定用途指数 | 热适应预测效应 | PEHA | Givoni and Goldman,1973b | 气温、湿度 | 代谢率、直肠温度、心率 | 是 |
| 生物气候距离指数 | BDI | Mateeva and Filipov,2003 | 气温、湿度、风、太阳辐射、长波辐射 | 代谢率 | 否 |
注: “—”表示“无”. ...
Bioclimates of heat and cold stress in New Zealand
1
1987
... Typical indicators of human comfort
Tab.2 | 分类 | 指数名称 | 缩写 | 研究 | 地理与气象因子 | 人体代谢、服装热阻及其他 | 是否经过验证 |
| 测量拟合及单传感器指数 | 卡他度 | — | Hill et al.,1916 | 气温、风、湿度、长波辐射 | — | 否 |
| 空气温度 | Ta | Macpherson,1962 | 气温 | — | 否 |
| 湿球温度 | WBT | Haldane,1905 | 湿球温度、环境气压 | — | 否 |
| 代数或统计模型 | 风寒指数 | WCI | Siple and Passel,1945 | 气温、风 | — | 否 |
| 温湿指数 | THI | Thom,1959 | 气温、湿度 | — | 是 |
| 综合舒适度指标 | CCI | 陆鼎煌等,1984 | 气温、湿度、风 | — | 否 |
| 基于“黄金分割法”的人体舒适度指数 | — | 王式功等,2013 | 气温、风、湿度、海拔、纬度 | — | 是 |
| 代理热应力和热应变指数 | 生理效应指标 | Ep | Robinson et al.,1945 | 气温、湿度 | 服装、代谢率、心率、直肠温度、皮肤温度、出汗率 | 是 |
| 预计四小时排汗率 | P4SR | McArdle et al.,1947 | 气温、湿球温度、风 | 服装、代谢率、与适应者相关 | 是 |
| 有效温度 | ET | Houghten and Yaglou,1923 | 气温、湿球温度、风 | 服装 | 是 |
| 风效指数 | WEI | Terjung,1966 | 气温、风、太阳辐射 | — | 否 |
| 能量平衡应变和应力指数 | 皮肤温度能量平衡指数 | STEBIDEX | De Freitas,1985;De Freitas,1986;De Freitas,1987 | 气温、风、湿度、长波辐射、太阳辐射 | 服装、代谢率 | 是 |
| 热力感受比 | TAR | Ionides et al.,1945 | 气温、平均辐射温度、湿度 | 代谢率 | 是 |
| 通用热气候指数 | UTCI | Jendritzky et al.,2009 | 气温、湿度、风、太阳辐射、长波辐射 | 服装、代谢率 | 是 |
| 生理等效温度 | PET | Mayer and Höppe,1987 | 气温、平均辐射温度、湿度、风 | 服装、代谢率 | 是 |
| 特定用途指数 | 热适应预测效应 | PEHA | Givoni and Goldman,1973b | 气温、湿度 | 代谢率、直肠温度、心率 | 是 |
| 生物气候距离指数 | BDI | Mateeva and Filipov,2003 | 气温、湿度、风、太阳辐射、长波辐射 | 代谢率 | 否 |
注: “—”表示“无”. ...
A comprehensive catalogue and classification of human thermal climate indices
3
2015
... 人体舒适度是从气象角度评价不同气候条件下人体的舒适状态,根据机体与大气环境之间的热交换制定的生物气象指标(孙美淑和李山,2015).过去一百年中,国内外研发了大量的人体舒适度指标,足见量化人体热舒适环境问题的迫切性和重要性.气候康养是指将人体从有害的气候环境转移到气候条件适宜且利于开展康养的气候康养地,从被动“避害”到主动“趋利”,达到降低疾病风险、增进机体机能和提升健康水平的目的(刘明华,2003;中国气象局公共气象服务中心和中国旅游研究院战略所,2020;林颖仪等,2021).气候康养旅游指数(Tourism Climate Indices,TCIs)是与旅游相关的人体舒适度,旨在表征旅游目的地气候环境状态,综合计量旅行者气候幸福感(Mieczkowski,1985;De Freitas and Grigorieva,2015).国际社会曾多次强调气候与健康相关指标在气候康养产业发展中的重要性,早在2001年世界气象组织(World Meteorological Organization,WMO)气候学委员会的气候与健康工作组就提出将气候与健康相关指标的科学构建作为未来两年的首要工作(WHO,2001).气候康养旅游指数对提升气象部门的服务质量、辅助气候康养目的地决策和促进气候康养产业良性发展具有重要意义(吴昊旻等,2020;卢山等,2021). ...
... 有研究(De Freitas and Grigorieva,2015;De Freitas and Grigorieva,2017)对人体舒适度指标进行系统分析,将160多个人体舒适度指标分成8类,并对其因子构成进行整理,然而该研究未纳入旅游相关的气候康养旅游指数.为促进气候康养旅游指数的构建及应用,系统整理气候康养旅游指数的历史演进及因子构成十分必要.但目前尚无研究系统梳理、对比分析国内外气候康养旅游指数和人体舒适度的内涵和历史演进,因此本文检索中外文数据库,对气候康养旅游指数相关研究现状进行可视化分析,然后基于典型指数的发表时间、研发方法和应用情况,阐释气候康养旅游指数和人体舒适度的内涵,介绍气候康养旅游指数和人体舒适度的演进,探讨气候康养旅游指数研究存在的问题和对策,以期为今后气候康养旅游指数研究提供参考,促进气候康养产业良性发展. ...
... De Freitas and Grigorieva(2015)提出了人体舒适度指标的分类方法,并系统梳理了人体舒适度指标,截至2016年全球共计165种人体舒适度指标被相继提出(De Freitas and Grigorieva,2017),包括测量拟合指数(11个,占比6.7%)、单传感器指数(6个,占比3.6%)、代数或统计模型(37个,占比22.4%)、代理热应变指数(14个,占比8.5%)、代理热应力指数(16个,占比9.7%)、能量平衡应变指数(28个,占比17.0%)、能量平衡应力指数(42个,占比25.5%)和特定用途指数(11个,占比6.7%),表2列出不同人体舒适度指数类型的典型指数(表2). ...
A comparison and appraisal of a comprehensive range of human thermal climate indices
2
2017
... 有研究(De Freitas and Grigorieva,2015;De Freitas and Grigorieva,2017)对人体舒适度指标进行系统分析,将160多个人体舒适度指标分成8类,并对其因子构成进行整理,然而该研究未纳入旅游相关的气候康养旅游指数.为促进气候康养旅游指数的构建及应用,系统整理气候康养旅游指数的历史演进及因子构成十分必要.但目前尚无研究系统梳理、对比分析国内外气候康养旅游指数和人体舒适度的内涵和历史演进,因此本文检索中外文数据库,对气候康养旅游指数相关研究现状进行可视化分析,然后基于典型指数的发表时间、研发方法和应用情况,阐释气候康养旅游指数和人体舒适度的内涵,介绍气候康养旅游指数和人体舒适度的演进,探讨气候康养旅游指数研究存在的问题和对策,以期为今后气候康养旅游指数研究提供参考,促进气候康养产业良性发展. ...
... De Freitas and Grigorieva(2015)提出了人体舒适度指标的分类方法,并系统梳理了人体舒适度指标,截至2016年全球共计165种人体舒适度指标被相继提出(De Freitas and Grigorieva,2017),包括测量拟合指数(11个,占比6.7%)、单传感器指数(6个,占比3.6%)、代数或统计模型(37个,占比22.4%)、代理热应变指数(14个,占比8.5%)、代理热应力指数(16个,占比9.7%)、能量平衡应变指数(28个,占比17.0%)、能量平衡应力指数(42个,占比25.5%)和特定用途指数(11个,占比6.7%),表2列出不同人体舒适度指数类型的典型指数(表2). ...
A second generation climate index for tourism (CIT): specification and verification
2
2008
... 典型的综合性气候康养旅游指数如Mieczkowski(1985)构建的第一个气候康养旅游指数(Tourism Climate Index,TCI),是衡量游客气候福祉的综合指标,其综合考虑了温度、湿度、风、降水、日照等气象因子,被广泛应用于评估特定气候对观光和购物等一般旅游活动的适宜性;2008年De Freitas等(2008)构建了第二代气候旅游指数(Climate Index for Tourism,CIT),综合考虑了生理、心理和物理3个维度的影响,优化了大气环境参数组合,提升了数值精度,得到了较好的应用.国内有学者(张富现,2015;蔚丹丹等,2021)将TCI翻译为旅游气候指数,在中医传统康养理念的背景和指导下,本文将其翻译为气候康养旅游指数更为贴切. ...
... 基于我国传统中医“天人合一,趋利避害”的养生准则,气候康养旅游可以帮助人群消除疲劳、加快康复,使身心趋于最佳状态(刘明华,2003;王乐和汪荣斌,2021).随着气候康养旅游的日益盛行,国内外学者构建了大量的气候康养指标(Mieczkowski,1985;Morgan et al.,2000;De Freitas et al.,2008;Tang et al.,2012;吴普,2014;Scott et al.,2016;Zhu et al.,2021).由于我国地域广阔,有多种气候类型的气候康养研究受到广泛关注,但存在以下问题需进一步探讨: ...
GSDM-WBT: global station-based daily maximum wet-bulb temperature data for 1981-2020
1
2022
... 测量拟合及单传感器指数是早期常用仪器直接观测的结果来评定环境舒适度的产物,针对被动的代谢状态,是对热条件的绝对测量,包括卡他度(Kata thermometer)、湿球温度(Wet Bulb Temperature,WBT)等.卡他度指被加热到36.5 ℃时的卡他温度计的液球在单位时间、单位面积上所散发的热量,其综合考虑了气温、风、湿度、长波辐射4个因素的影响,可以反映温度、湿度和风速3者的综合散热效果,用来评价劳动条件的舒适程度(Hill et al.,1916;郭伏和钱省三,2006),被广泛应用于矿井作业、办公室舒适度测量、人体的热交换与平衡等领域,是最具影响力的仪器测定指标(闫业超等,2013;Hill and Hargood-Ash,1919);湿球温度(Wet Bulb Temperature,WBT)指湿空气的绝热饱和温度,综合表示了热环境的温度和湿度,是描述人体能量调节的相关变量,适用于温暖天气和热带高温影响及某些工业职业相关问题的研究(Haldane,1905; Dong et al.,2022). ...
1
1970
... 第二阶段,机理模型:合理的人体舒适度模型必须以人体热交换机制为基础,综合考虑环境因素、人体代谢、呼吸散热及服装热阻等因素的综合影响.20世纪70年代,丹麦学者Fanger发表了热舒适方程,提出了预测平均投票(Predicted Mean Vote,PMV)以反映对同一环境大多数人的热舒适度,至今仍被广泛使用(Fanger,1970;Höppe,1997).1987年Mayer和Höppe基于慕尼黑人体热量平衡模型(Munich Energy Balance Model for Individuals,MEMI)推导出生理等效温度(Physiological Equivalent Temperature,PET),综合考虑了各种参数对舒适度的影响(Höppe,1984;Mayer and Höppe,1987).然而,机理模型时代阶段仍存在对人体舒适度的复杂性认识不足的问题,导致对这一复杂系统的学科关系和表述较为单一. ...
The coastal tourism climate index (CTCI): development, validation, and application for Chinese coastal cities
2
2022
... Typical indicators of tourism climate indices
Tab.3 | 分类 | 指标名称 | 缩写 | 研究 | 地理与气象因子 | 人体代谢、服装热阻及其他 | 验证与否 |
| 综合 | 度假气候指数:城市 | HCI:Urban | Scott et al.,2016 | 温度、湿度、风、降水、云量 | — | 是 |
| 气候康养旅游指数 | TCI | Mieczkowski,1985 | 温度、湿度、风、降水、日照 | — | 是 |
| 气候旅游指数 | CIT | De Freitas et al.,2008 | 云量、风、降水 | — | 是 |
| 避暑 | 避暑旅游指数 | TSI | 吴普等,2014 | 气温、湿度、风、空气质量 | — | 否 |
| 避暑旅游气象指数 | MIST | 侯亚红等,2018 | 温度、湿度、风、降水、日照、空气质量 | — | 是 |
| 高原 | 旅游气候适宜性指数 | TCSI | Tang et al.,2012 | 温度、湿度、日照、太阳辐射、氧含量、大气压力 | — | 否 |
| 喀斯特洞穴康养功能指数 | IKCH | 贾真真等,2019 | 气温、湿度、风、空气质量、空气离子 | — | 是 |
| 海滨 | 海滩气候指数 | BCI | Morgan et al.,2000 | 降水、风、日照 | 感觉温度、沐浴温度 | 是 |
| 滨海旅游气候指数 | CTCI | Gao et al.,2022 | 温度、湿度、风、降水、日照、空气质量 | — | 是 |
| 森林 | 森林综合保健指数 | FCHI | Zhu et al.,2021 | 氧含量、空气质量 | — | 是 |
| 森林康养指数 | FHI | 郑自君等,2021 | 温度、湿度、空气质量、海拔 | — | 是 |
注: “—”表示“无”. ...
... 避暑旅游指数(Tourist Satisfaction Index,TSI)旨在评估旅游目的地发展避暑旅游的条件,综合考虑了气温、湿度、风和空气质量等气象因子,一方面广泛应用于协助游客选择避暑旅游目的地,另一方面也为目的地避暑旅游的发展与提升提供管理工具(吴普,2014;吴普等,2014).旅游气候适宜性指数(Tourism Climate Suitability Index,TCSI)用于评估高原地区旅游气候适应性,包含温度、湿度、日照、太阳辐射、氧含量和大气压力等气象因子,对气候条件复杂的旅游目的地具有重要的科学意义和实用指导价值(Tang et al.,2012).评估滨海地区气候康养条件的典型指数如海滩气候指数(Beach Climate Index,BCI)和滨海旅游气候指数(Coastal Tourism Climate Index,CTCI),包括降水、日照和风速等气象因子,有助于提高滨海旅游城市的吸引力和可持续发展(Morgan et al.,2000;Gao et al.,2022).森林综合保健指数(Forest Comprehensive Healthcare Index,FCHI)是评估森林康养效益的典型指数,包含氧含量、空气质量等因子,不仅可以为森林治疗的时间和目的地提供必要的选择依据,还可以为森林健康效益的综合评价提供理论依据,有助于今后对森林健康环境的深入研究(Zhu et al.,2021). ...
Diseases and Injuries Collaborators, 2020. Global burden of 369 diseases and injuries in 204 countries and territories, 1990-2019: a systematic analysis for the Global Burden of Disease Study 2019
3
2019
... 研究显示气温在气候康养指标中所占的权重最高,是目前气候康养指标构建的核心考量因子,其次为降水和日照(Blazejczyk,2001;Brandenburg and Arnberger,2001;Scott and McBoyle,2001).然而,大气污染是影响人体健康的重要危险因素(Song et al.,2022;Ziou et al.,2022).全球疾病负担(Global Burden of Disease,GBD)研究显示,空气污染是全球第四大死亡风险因素(GBD 2019 Diseases and Injuries Collaborators,2020).冬季气温寒冷,此时气温对健康的影响大于污染,尤其对于老年人及高血压等慢性病患者(GBD 2019 Diseases and Injuries Collaborators,2020;陈蕾等,2021;黄开龙等,2021;徐静等,2021).此外,大量研究表明气温和大气污染之间存在协同效应,增加心血管及呼吸系统疾病等发病的风险(Chen et al.,2017;Li et al.,2017;刘楚薇等,2020;Anenberg et al.,2020;Song et al.,2021).建议未来在构建气候康养指标的过程中,纳入简易可得的空气质量指数,探究气温和污染的协同效应,以提升指标的科学性和准确性. ...
... Diseases and Injuries Collaborators,2020).冬季气温寒冷,此时气温对健康的影响大于污染,尤其对于老年人及高血压等慢性病患者(GBD 2019 Diseases and Injuries Collaborators,2020;陈蕾等,2021;黄开龙等,2021;徐静等,2021).此外,大量研究表明气温和大气污染之间存在协同效应,增加心血管及呼吸系统疾病等发病的风险(Chen et al.,2017;Li et al.,2017;刘楚薇等,2020;Anenberg et al.,2020;Song et al.,2021).建议未来在构建气候康养指标的过程中,纳入简易可得的空气质量指数,探究气温和污染的协同效应,以提升指标的科学性和准确性. ...
... ).冬季气温寒冷,此时气温对健康的影响大于污染,尤其对于老年人及高血压等慢性病患者(GBD 2019 Diseases and Injuries Collaborators,2020;陈蕾等,2021;黄开龙等,2021;徐静等,2021).此外,大量研究表明气温和大气污染之间存在协同效应,增加心血管及呼吸系统疾病等发病的风险(Chen et al.,2017;Li et al.,2017;刘楚薇等,2020;Anenberg et al.,2020;Song et al.,2021).建议未来在构建气候康养指标的过程中,纳入简易可得的空气质量指数,探究气温和污染的协同效应,以提升指标的科学性和准确性. ...
Predicting effects of heat acclimatization on heart rate and rectal temperature
1
1973a
... 此外还有一些特定用途指数,如热适应的预测效应(Predicted effects of heat acclimatization,PEHA),是描述心率和直肠温度变化的一般模型,其综合了气温、湿度、代谢率、直肠温度和心率5个因素来表达直肠温度和心率的变化,反映在高温下工作时间与热适应的关联,适用于任何温度和湿度组合(Givoni and Goldman,1973a). ...
Predicting heart rate response to work, environment, and clothing
1
1973b
... Typical indicators of human comfort
Tab.2 | 分类 | 指数名称 | 缩写 | 研究 | 地理与气象因子 | 人体代谢、服装热阻及其他 | 是否经过验证 |
| 测量拟合及单传感器指数 | 卡他度 | — | Hill et al.,1916 | 气温、风、湿度、长波辐射 | — | 否 |
| 空气温度 | Ta | Macpherson,1962 | 气温 | — | 否 |
| 湿球温度 | WBT | Haldane,1905 | 湿球温度、环境气压 | — | 否 |
| 代数或统计模型 | 风寒指数 | WCI | Siple and Passel,1945 | 气温、风 | — | 否 |
| 温湿指数 | THI | Thom,1959 | 气温、湿度 | — | 是 |
| 综合舒适度指标 | CCI | 陆鼎煌等,1984 | 气温、湿度、风 | — | 否 |
| 基于“黄金分割法”的人体舒适度指数 | — | 王式功等,2013 | 气温、风、湿度、海拔、纬度 | — | 是 |
| 代理热应力和热应变指数 | 生理效应指标 | Ep | Robinson et al.,1945 | 气温、湿度 | 服装、代谢率、心率、直肠温度、皮肤温度、出汗率 | 是 |
| 预计四小时排汗率 | P4SR | McArdle et al.,1947 | 气温、湿球温度、风 | 服装、代谢率、与适应者相关 | 是 |
| 有效温度 | ET | Houghten and Yaglou,1923 | 气温、湿球温度、风 | 服装 | 是 |
| 风效指数 | WEI | Terjung,1966 | 气温、风、太阳辐射 | — | 否 |
| 能量平衡应变和应力指数 | 皮肤温度能量平衡指数 | STEBIDEX | De Freitas,1985;De Freitas,1986;De Freitas,1987 | 气温、风、湿度、长波辐射、太阳辐射 | 服装、代谢率 | 是 |
| 热力感受比 | TAR | Ionides et al.,1945 | 气温、平均辐射温度、湿度 | 代谢率 | 是 |
| 通用热气候指数 | UTCI | Jendritzky et al.,2009 | 气温、湿度、风、太阳辐射、长波辐射 | 服装、代谢率 | 是 |
| 生理等效温度 | PET | Mayer and Höppe,1987 | 气温、平均辐射温度、湿度、风 | 服装、代谢率 | 是 |
| 特定用途指数 | 热适应预测效应 | PEHA | Givoni and Goldman,1973b | 气温、湿度 | 代谢率、直肠温度、心率 | 是 |
| 生物气候距离指数 | BDI | Mateeva and Filipov,2003 | 气温、湿度、风、太阳辐射、长波辐射 | 代谢率 | 否 |
注: “—”表示“无”. ...
The influence of high air temperatures: No.1
3
1905
... 第一阶段,经验公式:20世纪初,学者使用仪器直接测量环境舒适度,如1905年Haldane提出的湿球温度(Wet-bulb thermometer)和1916年Hill提出的卡他度(Kata thermometer)(Haldane,1905;Hill and Hargood-Ash,1919).20世纪20年代开始出现的经验模型是以人类的主观感觉或生理反应为依据,以经验或统计学方法建立的人体舒适模型(Houghten and Yaglou,1923).经验模型包括热环境、冷环境以及普适性环境(闫业超等,2013;孙美淑和李山,2015).1923年Houghton和Yaglou提出了有效温度(Effective Temperature,ET)指数以评估热舒适度,开创了人体气候舒适度经验模型的先河(Houghten and Yaglou,1923).1957年Yaglou和Minard提出了湿球黑球温度指数(Wet Bulb Globe Temperature,WBGT)以预防军事训练中的热损伤事故,WBGT也成为了世界上应用最为广泛的经验热环境评价指数(Yaglou and Minard,1957;孙美淑和李山,2015).人体舒适度经验测度模型在“单设备测量”的基础上由“多要素建模”到“多指数组合”变化,并实现了从“单环境适用”到“环境普适”的演进(孙美淑和李山,2015). ...
... Typical indicators of human comfort
Tab.2 | 分类 | 指数名称 | 缩写 | 研究 | 地理与气象因子 | 人体代谢、服装热阻及其他 | 是否经过验证 |
| 测量拟合及单传感器指数 | 卡他度 | — | Hill et al.,1916 | 气温、风、湿度、长波辐射 | — | 否 |
| 空气温度 | Ta | Macpherson,1962 | 气温 | — | 否 |
| 湿球温度 | WBT | Haldane,1905 | 湿球温度、环境气压 | — | 否 |
| 代数或统计模型 | 风寒指数 | WCI | Siple and Passel,1945 | 气温、风 | — | 否 |
| 温湿指数 | THI | Thom,1959 | 气温、湿度 | — | 是 |
| 综合舒适度指标 | CCI | 陆鼎煌等,1984 | 气温、湿度、风 | — | 否 |
| 基于“黄金分割法”的人体舒适度指数 | — | 王式功等,2013 | 气温、风、湿度、海拔、纬度 | — | 是 |
| 代理热应力和热应变指数 | 生理效应指标 | Ep | Robinson et al.,1945 | 气温、湿度 | 服装、代谢率、心率、直肠温度、皮肤温度、出汗率 | 是 |
| 预计四小时排汗率 | P4SR | McArdle et al.,1947 | 气温、湿球温度、风 | 服装、代谢率、与适应者相关 | 是 |
| 有效温度 | ET | Houghten and Yaglou,1923 | 气温、湿球温度、风 | 服装 | 是 |
| 风效指数 | WEI | Terjung,1966 | 气温、风、太阳辐射 | — | 否 |
| 能量平衡应变和应力指数 | 皮肤温度能量平衡指数 | STEBIDEX | De Freitas,1985;De Freitas,1986;De Freitas,1987 | 气温、风、湿度、长波辐射、太阳辐射 | 服装、代谢率 | 是 |
| 热力感受比 | TAR | Ionides et al.,1945 | 气温、平均辐射温度、湿度 | 代谢率 | 是 |
| 通用热气候指数 | UTCI | Jendritzky et al.,2009 | 气温、湿度、风、太阳辐射、长波辐射 | 服装、代谢率 | 是 |
| 生理等效温度 | PET | Mayer and Höppe,1987 | 气温、平均辐射温度、湿度、风 | 服装、代谢率 | 是 |
| 特定用途指数 | 热适应预测效应 | PEHA | Givoni and Goldman,1973b | 气温、湿度 | 代谢率、直肠温度、心率 | 是 |
| 生物气候距离指数 | BDI | Mateeva and Filipov,2003 | 气温、湿度、风、太阳辐射、长波辐射 | 代谢率 | 否 |
注: “—”表示“无”. ...
... 测量拟合及单传感器指数是早期常用仪器直接观测的结果来评定环境舒适度的产物,针对被动的代谢状态,是对热条件的绝对测量,包括卡他度(Kata thermometer)、湿球温度(Wet Bulb Temperature,WBT)等.卡他度指被加热到36.5 ℃时的卡他温度计的液球在单位时间、单位面积上所散发的热量,其综合考虑了气温、风、湿度、长波辐射4个因素的影响,可以反映温度、湿度和风速3者的综合散热效果,用来评价劳动条件的舒适程度(Hill et al.,1916;郭伏和钱省三,2006),被广泛应用于矿井作业、办公室舒适度测量、人体的热交换与平衡等领域,是最具影响力的仪器测定指标(闫业超等,2013;Hill and Hargood-Ash,1919);湿球温度(Wet Bulb Temperature,WBT)指湿空气的绝热饱和温度,综合表示了热环境的温度和湿度,是描述人体能量调节的相关变量,适用于温暖天气和热带高温影响及某些工业职业相关问题的研究(Haldane,1905; Dong et al.,2022). ...
A review of frameworks for developing environmental health indicators for climate change and health
3
2011
... 指标构建框架可以针对一个主题,提供一种系统的方法,展示环境和人类健康的联系以科学构建环境健康指标.一个稳健的框架需要有清晰的概念及范围,兼具灵活性、平衡性和实用性(Hambling et al.,2011).气候康养指标的构建应基于指标构建框架,利用循证医学的方法,提升指标的科学性和适用性.Hambling等(2011)系统检索和评价了环境健康领域的指标构建框架,纳入的指标构建框架包括1990年经济合作与发展组织(the Organization for Economic Co-operation and Development,OECD)构建的压力-状态-响应(The Pressure-State-Response,PSR)框架、1997年联合国可持续发展委员会(the United Nations Commission on Sustainable Development,CSD)通过的驱动力-状态-响应(Driving force-State-Response,DSR)框架和1997世界卫生组织(World Health Organization,WHO)构建的驱动力-压力-状态-暴露-影响-行动(Driving Force-Pressure-State-Exposure-Effect-Action,DPSEEA)框架等(OECD,1993;Mortensen,1997),结果显示DPSEEA为最优框架(WHO,2001;Hambling et al.,2011).然而,现有的人体舒适度及气候康养旅游指数在构建时未遵循系统结构化的框架,未来研究进行指标构建时应基于环境健康领域的指标构建框架,有助于更好地评估气候与人类健康之间的关系. ...
... ).气候康养指标的构建应基于指标构建框架,利用循证医学的方法,提升指标的科学性和适用性.Hambling等(2011)系统检索和评价了环境健康领域的指标构建框架,纳入的指标构建框架包括1990年经济合作与发展组织(the Organization for Economic Co-operation and Development,OECD)构建的压力-状态-响应(The Pressure-State-Response,PSR)框架、1997年联合国可持续发展委员会(the United Nations Commission on Sustainable Development,CSD)通过的驱动力-状态-响应(Driving force-State-Response,DSR)框架和1997世界卫生组织(World Health Organization,WHO)构建的驱动力-压力-状态-暴露-影响-行动(Driving Force-Pressure-State-Exposure-Effect-Action,DPSEEA)框架等(OECD,1993;Mortensen,1997),结果显示DPSEEA为最优框架(WHO,2001;Hambling et al.,2011).然而,现有的人体舒适度及气候康养旅游指数在构建时未遵循系统结构化的框架,未来研究进行指标构建时应基于环境健康领域的指标构建框架,有助于更好地评估气候与人类健康之间的关系. ...
... ;Hambling et al.,2011).然而,现有的人体舒适度及气候康养旅游指数在构建时未遵循系统结构化的框架,未来研究进行指标构建时应基于环境健康领域的指标构建框架,有助于更好地评估气候与人类健康之间的关系. ...
Service quality in tourism public health: trust, satisfaction, and loyalty
1
2021
... 中英文文献共检索1 852篇,发表于1979—2023年;英文文献共检索9 662篇,发表于1980—2023年.(1)关键词共现分析显示,英文研究主题以旅游满意度、竞争力、海滩、岛屿、生物多样性和气候适宜度等为主[图1(a)];中国学者对气候康养的关注程度较高,中文研究主题以人体舒适度、气候舒适度和康养旅游等为主[图1(b)].气候舒适度的内涵是客观反映气候的舒适程度,而人体舒适度的内涵是反映人体主观感受的舒适程度,气候康养旅游指数则是人体舒适度在康养旅游中的应用,反映康养旅游目的地人体热舒适程度.关键词共现分析显示英文研究中关注度较高的指数为通用热气候指数(Universal Thermal Climate Index,UTCI)和湿球温度(Wet Bulb Temperature,WBT),中文研究中关注度较高的指数为风效指数(Wind Effect Index,WEI)、温湿指数(Temperature Humidity Index,THI)和风寒指数(Wind Chill Index,WCI).(2)作者共现分析显示,英文研究作者以Rob Law(Han et al.,2021;Liao et al.,2022)、Jie Zhang(Nian et al.,2019;Liu et al.,2022)和Daniel Scott(Scott and McBoyle,2001;Rutty and Scott,2015;Scott et al.,2016)等人为主;中文研究作者以孙根年、马丽君、王式功和张京红等人在气候康养方向影响力大(马丽君等,2007;孙根年和马丽君,2007;王敏珍等,2012;卢山等,2021;林颖仪等,2021;孙根年,2022;张京红等,2022;张明洁等,2022).(3)发文量前十机构分析显示(表1),英文研究以中国科学院、乌克兰教育科学部、香港理工大学、中国科学院大学和美国佛罗里达州立大学发文量最多;中文研究以南京信息工程大学、陕西师范大学、华东师范大学、成都信息工程大学和同济大学发文量最多.此外,Daniel Scott所属的加拿大滑铁卢大学发表了41篇相关研究被引2 062次,被引量位于第六,也是该领域重要的研究机构. ...
Thermal indices and thermophysiological modeling for heat stress
2
2015
... 代理热应力和热应变指数是适用于热环境的人体舒适度经验模型,针对主动或被动的代谢状态,包括对热条件的绝对测量和相对测量.其典型指数如预计4 h排汗率(Predicted Four Hour Sweat Rate,P4SR),基于人体的排汗率,综合了气温、湿球温度、风、新陈代谢率及服装热阻等因素,可以很好地表示人体的热负荷状况,常用诺模图预测人体在特定环境下未来4 h的排汗量,单位时间排汗量越多时人体的热负荷越大(McArdle et al.,1947);风效指数(Wind Effect Index,WEI)主要反映人体对风、温度和日照的综合感受,即风速和气温对裸露人体热量散失的影响,综合考虑了气温、风、太阳辐射因素,既考虑了体表的散热,也考虑了太阳辐射后人体的增热,被广泛应用于气候舒适度的评价中(Terjung,1966;Havenith and Fiala,2015;王耕等,2022). ...
... 能量平衡应变和应力指数基于人体与环境热交换理论,针对主动或被动的代谢状态,大部分是对热条件的绝对测量,如通用热气候指数(Universal Thermal Climate Index,UTCI),在国际生物气象学会(International Society of Biometeorology,ISB)和欧洲科技与技术发展合作行动(Cooperation in Science and Technology,COST)730号行动的倡议下,由多学科专家合作构建,是指引起与实际条件相同的模型响应的参考条件的空气温度(Air temperature,Ta)(Blazejczyk et al.,2013;Jendritzky et al.,2012),综合了气温、湿度、风、太阳辐射、长波辐射、服装、代谢率7个因素,被广泛应用于公共气象局、公共卫生服务、预防性规划和气候影响研究中,是当前考虑因素最全面、最具普适性的机理模型(Havenith and Fiala,2015). ...
The measurement of the rate of heat-loss at body temperature by convection, radiation, and evaporation
2
1916
... Typical indicators of human comfort
Tab.2 | 分类 | 指数名称 | 缩写 | 研究 | 地理与气象因子 | 人体代谢、服装热阻及其他 | 是否经过验证 |
| 测量拟合及单传感器指数 | 卡他度 | — | Hill et al.,1916 | 气温、风、湿度、长波辐射 | — | 否 |
| 空气温度 | Ta | Macpherson,1962 | 气温 | — | 否 |
| 湿球温度 | WBT | Haldane,1905 | 湿球温度、环境气压 | — | 否 |
| 代数或统计模型 | 风寒指数 | WCI | Siple and Passel,1945 | 气温、风 | — | 否 |
| 温湿指数 | THI | Thom,1959 | 气温、湿度 | — | 是 |
| 综合舒适度指标 | CCI | 陆鼎煌等,1984 | 气温、湿度、风 | — | 否 |
| 基于“黄金分割法”的人体舒适度指数 | — | 王式功等,2013 | 气温、风、湿度、海拔、纬度 | — | 是 |
| 代理热应力和热应变指数 | 生理效应指标 | Ep | Robinson et al.,1945 | 气温、湿度 | 服装、代谢率、心率、直肠温度、皮肤温度、出汗率 | 是 |
| 预计四小时排汗率 | P4SR | McArdle et al.,1947 | 气温、湿球温度、风 | 服装、代谢率、与适应者相关 | 是 |
| 有效温度 | ET | Houghten and Yaglou,1923 | 气温、湿球温度、风 | 服装 | 是 |
| 风效指数 | WEI | Terjung,1966 | 气温、风、太阳辐射 | — | 否 |
| 能量平衡应变和应力指数 | 皮肤温度能量平衡指数 | STEBIDEX | De Freitas,1985;De Freitas,1986;De Freitas,1987 | 气温、风、湿度、长波辐射、太阳辐射 | 服装、代谢率 | 是 |
| 热力感受比 | TAR | Ionides et al.,1945 | 气温、平均辐射温度、湿度 | 代谢率 | 是 |
| 通用热气候指数 | UTCI | Jendritzky et al.,2009 | 气温、湿度、风、太阳辐射、长波辐射 | 服装、代谢率 | 是 |
| 生理等效温度 | PET | Mayer and Höppe,1987 | 气温、平均辐射温度、湿度、风 | 服装、代谢率 | 是 |
| 特定用途指数 | 热适应预测效应 | PEHA | Givoni and Goldman,1973b | 气温、湿度 | 代谢率、直肠温度、心率 | 是 |
| 生物气候距离指数 | BDI | Mateeva and Filipov,2003 | 气温、湿度、风、太阳辐射、长波辐射 | 代谢率 | 否 |
注: “—”表示“无”. ...
... 测量拟合及单传感器指数是早期常用仪器直接观测的结果来评定环境舒适度的产物,针对被动的代谢状态,是对热条件的绝对测量,包括卡他度(Kata thermometer)、湿球温度(Wet Bulb Temperature,WBT)等.卡他度指被加热到36.5 ℃时的卡他温度计的液球在单位时间、单位面积上所散发的热量,其综合考虑了气温、风、湿度、长波辐射4个因素的影响,可以反映温度、湿度和风速3者的综合散热效果,用来评价劳动条件的舒适程度(Hill et al.,1916;郭伏和钱省三,2006),被广泛应用于矿井作业、办公室舒适度测量、人体的热交换与平衡等领域,是最具影响力的仪器测定指标(闫业超等,2013;Hill and Hargood-Ash,1919);湿球温度(Wet Bulb Temperature,WBT)指湿空气的绝热饱和温度,综合表示了热环境的温度和湿度,是描述人体能量调节的相关变量,适用于温暖天气和热带高温影响及某些工业职业相关问题的研究(Haldane,1905; Dong et al.,2022). ...
On the cooling and evaporative powers of the atmosphere, as determined by the kata-thermometer
2
1919
... 第一阶段,经验公式:20世纪初,学者使用仪器直接测量环境舒适度,如1905年Haldane提出的湿球温度(Wet-bulb thermometer)和1916年Hill提出的卡他度(Kata thermometer)(Haldane,1905;Hill and Hargood-Ash,1919).20世纪20年代开始出现的经验模型是以人类的主观感觉或生理反应为依据,以经验或统计学方法建立的人体舒适模型(Houghten and Yaglou,1923).经验模型包括热环境、冷环境以及普适性环境(闫业超等,2013;孙美淑和李山,2015).1923年Houghton和Yaglou提出了有效温度(Effective Temperature,ET)指数以评估热舒适度,开创了人体气候舒适度经验模型的先河(Houghten and Yaglou,1923).1957年Yaglou和Minard提出了湿球黑球温度指数(Wet Bulb Globe Temperature,WBGT)以预防军事训练中的热损伤事故,WBGT也成为了世界上应用最为广泛的经验热环境评价指数(Yaglou and Minard,1957;孙美淑和李山,2015).人体舒适度经验测度模型在“单设备测量”的基础上由“多要素建模”到“多指数组合”变化,并实现了从“单环境适用”到“环境普适”的演进(孙美淑和李山,2015). ...
... 测量拟合及单传感器指数是早期常用仪器直接观测的结果来评定环境舒适度的产物,针对被动的代谢状态,是对热条件的绝对测量,包括卡他度(Kata thermometer)、湿球温度(Wet Bulb Temperature,WBT)等.卡他度指被加热到36.5 ℃时的卡他温度计的液球在单位时间、单位面积上所散发的热量,其综合考虑了气温、风、湿度、长波辐射4个因素的影响,可以反映温度、湿度和风速3者的综合散热效果,用来评价劳动条件的舒适程度(Hill et al.,1916;郭伏和钱省三,2006),被广泛应用于矿井作业、办公室舒适度测量、人体的热交换与平衡等领域,是最具影响力的仪器测定指标(闫业超等,2013;Hill and Hargood-Ash,1919);湿球温度(Wet Bulb Temperature,WBT)指湿空气的绝热饱和温度,综合表示了热环境的温度和湿度,是描述人体能量调节的相关变量,适用于温暖天气和热带高温影响及某些工业职业相关问题的研究(Haldane,1905; Dong et al.,2022). ...
1
1984
... 第二阶段,机理模型:合理的人体舒适度模型必须以人体热交换机制为基础,综合考虑环境因素、人体代谢、呼吸散热及服装热阻等因素的综合影响.20世纪70年代,丹麦学者Fanger发表了热舒适方程,提出了预测平均投票(Predicted Mean Vote,PMV)以反映对同一环境大多数人的热舒适度,至今仍被广泛使用(Fanger,1970;Höppe,1997).1987年Mayer和Höppe基于慕尼黑人体热量平衡模型(Munich Energy Balance Model for Individuals,MEMI)推导出生理等效温度(Physiological Equivalent Temperature,PET),综合考虑了各种参数对舒适度的影响(Höppe,1984;Mayer and Höppe,1987).然而,机理模型时代阶段仍存在对人体舒适度的复杂性认识不足的问题,导致对这一复杂系统的学科关系和表述较为单一. ...
Aspects of human biometeorology in past, present and future
1
1997
... 第二阶段,机理模型:合理的人体舒适度模型必须以人体热交换机制为基础,综合考虑环境因素、人体代谢、呼吸散热及服装热阻等因素的综合影响.20世纪70年代,丹麦学者Fanger发表了热舒适方程,提出了预测平均投票(Predicted Mean Vote,PMV)以反映对同一环境大多数人的热舒适度,至今仍被广泛使用(Fanger,1970;Höppe,1997).1987年Mayer和Höppe基于慕尼黑人体热量平衡模型(Munich Energy Balance Model for Individuals,MEMI)推导出生理等效温度(Physiological Equivalent Temperature,PET),综合考虑了各种参数对舒适度的影响(Höppe,1984;Mayer and Höppe,1987).然而,机理模型时代阶段仍存在对人体舒适度的复杂性认识不足的问题,导致对这一复杂系统的学科关系和表述较为单一. ...
Determining lines of equal comfort
3
1923
... 第一阶段,经验公式:20世纪初,学者使用仪器直接测量环境舒适度,如1905年Haldane提出的湿球温度(Wet-bulb thermometer)和1916年Hill提出的卡他度(Kata thermometer)(Haldane,1905;Hill and Hargood-Ash,1919).20世纪20年代开始出现的经验模型是以人类的主观感觉或生理反应为依据,以经验或统计学方法建立的人体舒适模型(Houghten and Yaglou,1923).经验模型包括热环境、冷环境以及普适性环境(闫业超等,2013;孙美淑和李山,2015).1923年Houghton和Yaglou提出了有效温度(Effective Temperature,ET)指数以评估热舒适度,开创了人体气候舒适度经验模型的先河(Houghten and Yaglou,1923).1957年Yaglou和Minard提出了湿球黑球温度指数(Wet Bulb Globe Temperature,WBGT)以预防军事训练中的热损伤事故,WBGT也成为了世界上应用最为广泛的经验热环境评价指数(Yaglou and Minard,1957;孙美淑和李山,2015).人体舒适度经验测度模型在“单设备测量”的基础上由“多要素建模”到“多指数组合”变化,并实现了从“单环境适用”到“环境普适”的演进(孙美淑和李山,2015). ...
... ).1923年Houghton和Yaglou提出了有效温度(Effective Temperature,ET)指数以评估热舒适度,开创了人体气候舒适度经验模型的先河(Houghten and Yaglou,1923).1957年Yaglou和Minard提出了湿球黑球温度指数(Wet Bulb Globe Temperature,WBGT)以预防军事训练中的热损伤事故,WBGT也成为了世界上应用最为广泛的经验热环境评价指数(Yaglou and Minard,1957;孙美淑和李山,2015).人体舒适度经验测度模型在“单设备测量”的基础上由“多要素建模”到“多指数组合”变化,并实现了从“单环境适用”到“环境普适”的演进(孙美淑和李山,2015). ...
... Typical indicators of human comfort
Tab.2 | 分类 | 指数名称 | 缩写 | 研究 | 地理与气象因子 | 人体代谢、服装热阻及其他 | 是否经过验证 |
| 测量拟合及单传感器指数 | 卡他度 | — | Hill et al.,1916 | 气温、风、湿度、长波辐射 | — | 否 |
| 空气温度 | Ta | Macpherson,1962 | 气温 | — | 否 |
| 湿球温度 | WBT | Haldane,1905 | 湿球温度、环境气压 | — | 否 |
| 代数或统计模型 | 风寒指数 | WCI | Siple and Passel,1945 | 气温、风 | — | 否 |
| 温湿指数 | THI | Thom,1959 | 气温、湿度 | — | 是 |
| 综合舒适度指标 | CCI | 陆鼎煌等,1984 | 气温、湿度、风 | — | 否 |
| 基于“黄金分割法”的人体舒适度指数 | — | 王式功等,2013 | 气温、风、湿度、海拔、纬度 | — | 是 |
| 代理热应力和热应变指数 | 生理效应指标 | Ep | Robinson et al.,1945 | 气温、湿度 | 服装、代谢率、心率、直肠温度、皮肤温度、出汗率 | 是 |
| 预计四小时排汗率 | P4SR | McArdle et al.,1947 | 气温、湿球温度、风 | 服装、代谢率、与适应者相关 | 是 |
| 有效温度 | ET | Houghten and Yaglou,1923 | 气温、湿球温度、风 | 服装 | 是 |
| 风效指数 | WEI | Terjung,1966 | 气温、风、太阳辐射 | — | 否 |
| 能量平衡应变和应力指数 | 皮肤温度能量平衡指数 | STEBIDEX | De Freitas,1985;De Freitas,1986;De Freitas,1987 | 气温、风、湿度、长波辐射、太阳辐射 | 服装、代谢率 | 是 |
| 热力感受比 | TAR | Ionides et al.,1945 | 气温、平均辐射温度、湿度 | 代谢率 | 是 |
| 通用热气候指数 | UTCI | Jendritzky et al.,2009 | 气温、湿度、风、太阳辐射、长波辐射 | 服装、代谢率 | 是 |
| 生理等效温度 | PET | Mayer and Höppe,1987 | 气温、平均辐射温度、湿度、风 | 服装、代谢率 | 是 |
| 特定用途指数 | 热适应预测效应 | PEHA | Givoni and Goldman,1973b | 气温、湿度 | 代谢率、直肠温度、心率 | 是 |
| 生物气候距离指数 | BDI | Mateeva and Filipov,2003 | 气温、湿度、风、太阳辐射、长波辐射 | 代谢率 | 否 |
注: “—”表示“无”. ...
The thermal acceptance ratio: report from climatology and environmental protection section
1
1945
... Typical indicators of human comfort
Tab.2 | 分类 | 指数名称 | 缩写 | 研究 | 地理与气象因子 | 人体代谢、服装热阻及其他 | 是否经过验证 |
| 测量拟合及单传感器指数 | 卡他度 | — | Hill et al.,1916 | 气温、风、湿度、长波辐射 | — | 否 |
| 空气温度 | Ta | Macpherson,1962 | 气温 | — | 否 |
| 湿球温度 | WBT | Haldane,1905 | 湿球温度、环境气压 | — | 否 |
| 代数或统计模型 | 风寒指数 | WCI | Siple and Passel,1945 | 气温、风 | — | 否 |
| 温湿指数 | THI | Thom,1959 | 气温、湿度 | — | 是 |
| 综合舒适度指标 | CCI | 陆鼎煌等,1984 | 气温、湿度、风 | — | 否 |
| 基于“黄金分割法”的人体舒适度指数 | — | 王式功等,2013 | 气温、风、湿度、海拔、纬度 | — | 是 |
| 代理热应力和热应变指数 | 生理效应指标 | Ep | Robinson et al.,1945 | 气温、湿度 | 服装、代谢率、心率、直肠温度、皮肤温度、出汗率 | 是 |
| 预计四小时排汗率 | P4SR | McArdle et al.,1947 | 气温、湿球温度、风 | 服装、代谢率、与适应者相关 | 是 |
| 有效温度 | ET | Houghten and Yaglou,1923 | 气温、湿球温度、风 | 服装 | 是 |
| 风效指数 | WEI | Terjung,1966 | 气温、风、太阳辐射 | — | 否 |
| 能量平衡应变和应力指数 | 皮肤温度能量平衡指数 | STEBIDEX | De Freitas,1985;De Freitas,1986;De Freitas,1987 | 气温、风、湿度、长波辐射、太阳辐射 | 服装、代谢率 | 是 |
| 热力感受比 | TAR | Ionides et al.,1945 | 气温、平均辐射温度、湿度 | 代谢率 | 是 |
| 通用热气候指数 | UTCI | Jendritzky et al.,2009 | 气温、湿度、风、太阳辐射、长波辐射 | 服装、代谢率 | 是 |
| 生理等效温度 | PET | Mayer and Höppe,1987 | 气温、平均辐射温度、湿度、风 | 服装、代谢率 | 是 |
| 特定用途指数 | 热适应预测效应 | PEHA | Givoni and Goldman,1973b | 气温、湿度 | 代谢率、直肠温度、心率 | 是 |
| 生物气候距离指数 | BDI | Mateeva and Filipov,2003 | 气温、湿度、风、太阳辐射、长波辐射 | 代谢率 | 否 |
注: “—”表示“无”. ...
UTCI—why another thermal index?
2
2012
... 第三阶段,学科交叉:进入21世纪,以通用热气候指数(Universal Thermal Climate Index,UTCI)为代表的指标研发反映出学界对人体舒适度系统性和国际化认识的日益提升,为气候康养等跨学科指标的研发提供了条件(Jendritzky et al.,2012).Mieczkowski(1985)研发了第一个气候康养旅游指数TCI,是目前应用最为广泛的旅游气候舒适性评价模型.随着避暑、海滨、森林和高原等多类型气候康养旅游指数的诞生,人体舒适度研究呈现从单一研究到多元发展的趋势,以往单一分析气候或旅游的研究壁垒正逐渐被打破,为气候康养行业的方法学创新和学科交叉奠定了基础. ...
... 能量平衡应变和应力指数基于人体与环境热交换理论,针对主动或被动的代谢状态,大部分是对热条件的绝对测量,如通用热气候指数(Universal Thermal Climate Index,UTCI),在国际生物气象学会(International Society of Biometeorology,ISB)和欧洲科技与技术发展合作行动(Cooperation in Science and Technology,COST)730号行动的倡议下,由多学科专家合作构建,是指引起与实际条件相同的模型响应的参考条件的空气温度(Air temperature,Ta)(Blazejczyk et al.,2013;Jendritzky et al.,2012),综合了气温、湿度、风、太阳辐射、长波辐射、服装、代谢率7个因素,被广泛应用于公共气象局、公共卫生服务、预防性规划和气候影响研究中,是当前考虑因素最全面、最具普适性的机理模型(Havenith and Fiala,2015). ...
Towards a universal thermal climate index UTCI for assessing the thermal environment of the human being: final evaluation report
1
2009
... Typical indicators of human comfort
Tab.2 | 分类 | 指数名称 | 缩写 | 研究 | 地理与气象因子 | 人体代谢、服装热阻及其他 | 是否经过验证 |
| 测量拟合及单传感器指数 | 卡他度 | — | Hill et al.,1916 | 气温、风、湿度、长波辐射 | — | 否 |
| 空气温度 | Ta | Macpherson,1962 | 气温 | — | 否 |
| 湿球温度 | WBT | Haldane,1905 | 湿球温度、环境气压 | — | 否 |
| 代数或统计模型 | 风寒指数 | WCI | Siple and Passel,1945 | 气温、风 | — | 否 |
| 温湿指数 | THI | Thom,1959 | 气温、湿度 | — | 是 |
| 综合舒适度指标 | CCI | 陆鼎煌等,1984 | 气温、湿度、风 | — | 否 |
| 基于“黄金分割法”的人体舒适度指数 | — | 王式功等,2013 | 气温、风、湿度、海拔、纬度 | — | 是 |
| 代理热应力和热应变指数 | 生理效应指标 | Ep | Robinson et al.,1945 | 气温、湿度 | 服装、代谢率、心率、直肠温度、皮肤温度、出汗率 | 是 |
| 预计四小时排汗率 | P4SR | McArdle et al.,1947 | 气温、湿球温度、风 | 服装、代谢率、与适应者相关 | 是 |
| 有效温度 | ET | Houghten and Yaglou,1923 | 气温、湿球温度、风 | 服装 | 是 |
| 风效指数 | WEI | Terjung,1966 | 气温、风、太阳辐射 | — | 否 |
| 能量平衡应变和应力指数 | 皮肤温度能量平衡指数 | STEBIDEX | De Freitas,1985;De Freitas,1986;De Freitas,1987 | 气温、风、湿度、长波辐射、太阳辐射 | 服装、代谢率 | 是 |
| 热力感受比 | TAR | Ionides et al.,1945 | 气温、平均辐射温度、湿度 | 代谢率 | 是 |
| 通用热气候指数 | UTCI | Jendritzky et al.,2009 | 气温、湿度、风、太阳辐射、长波辐射 | 服装、代谢率 | 是 |
| 生理等效温度 | PET | Mayer and Höppe,1987 | 气温、平均辐射温度、湿度、风 | 服装、代谢率 | 是 |
| 特定用途指数 | 热适应预测效应 | PEHA | Givoni and Goldman,1973b | 气温、湿度 | 代谢率、直肠温度、心率 | 是 |
| 生物气候距离指数 | BDI | Mateeva and Filipov,2003 | 气温、湿度、风、太阳辐射、长波辐射 | 代谢率 | 否 |
注: “—”表示“无”. ...
Modification of the effects of air pollutants on mortality by temperature: a systematic review and meta-analysis
1
2017
... 研究显示气温在气候康养指标中所占的权重最高,是目前气候康养指标构建的核心考量因子,其次为降水和日照(Blazejczyk,2001;Brandenburg and Arnberger,2001;Scott and McBoyle,2001).然而,大气污染是影响人体健康的重要危险因素(Song et al.,2022;Ziou et al.,2022).全球疾病负担(Global Burden of Disease,GBD)研究显示,空气污染是全球第四大死亡风险因素(GBD 2019 Diseases and Injuries Collaborators,2020).冬季气温寒冷,此时气温对健康的影响大于污染,尤其对于老年人及高血压等慢性病患者(GBD 2019 Diseases and Injuries Collaborators,2020;陈蕾等,2021;黄开龙等,2021;徐静等,2021).此外,大量研究表明气温和大气污染之间存在协同效应,增加心血管及呼吸系统疾病等发病的风险(Chen et al.,2017;Li et al.,2017;刘楚薇等,2020;Anenberg et al.,2020;Song et al.,2021).建议未来在构建气候康养指标的过程中,纳入简易可得的空气质量指数,探究气温和污染的协同效应,以提升指标的科学性和准确性. ...
Dimensions of the health benefits of wellness tourism: a review
1
2022
... 中英文文献共检索1 852篇,发表于1979—2023年;英文文献共检索9 662篇,发表于1980—2023年.(1)关键词共现分析显示,英文研究主题以旅游满意度、竞争力、海滩、岛屿、生物多样性和气候适宜度等为主[图1(a)];中国学者对气候康养的关注程度较高,中文研究主题以人体舒适度、气候舒适度和康养旅游等为主[图1(b)].气候舒适度的内涵是客观反映气候的舒适程度,而人体舒适度的内涵是反映人体主观感受的舒适程度,气候康养旅游指数则是人体舒适度在康养旅游中的应用,反映康养旅游目的地人体热舒适程度.关键词共现分析显示英文研究中关注度较高的指数为通用热气候指数(Universal Thermal Climate Index,UTCI)和湿球温度(Wet Bulb Temperature,WBT),中文研究中关注度较高的指数为风效指数(Wind Effect Index,WEI)、温湿指数(Temperature Humidity Index,THI)和风寒指数(Wind Chill Index,WCI).(2)作者共现分析显示,英文研究作者以Rob Law(Han et al.,2021;Liao et al.,2022)、Jie Zhang(Nian et al.,2019;Liu et al.,2022)和Daniel Scott(Scott and McBoyle,2001;Rutty and Scott,2015;Scott et al.,2016)等人为主;中文研究作者以孙根年、马丽君、王式功和张京红等人在气候康养方向影响力大(马丽君等,2007;孙根年和马丽君,2007;王敏珍等,2012;卢山等,2021;林颖仪等,2021;孙根年,2022;张京红等,2022;张明洁等,2022).(3)发文量前十机构分析显示(表1),英文研究以中国科学院、乌克兰教育科学部、香港理工大学、中国科学院大学和美国佛罗里达州立大学发文量最多;中文研究以南京信息工程大学、陕西师范大学、华东师范大学、成都信息工程大学和同济大学发文量最多.此外,Daniel Scott所属的加拿大滑铁卢大学发表了41篇相关研究被引2 062次,被引量位于第六,也是该领域重要的研究机构. ...
More information, greater appreciation: the correlation between background information and aesthetic judgment of tourist crafts
1
2022
... 中英文文献共检索1 852篇,发表于1979—2023年;英文文献共检索9 662篇,发表于1980—2023年.(1)关键词共现分析显示,英文研究主题以旅游满意度、竞争力、海滩、岛屿、生物多样性和气候适宜度等为主[图1(a)];中国学者对气候康养的关注程度较高,中文研究主题以人体舒适度、气候舒适度和康养旅游等为主[图1(b)].气候舒适度的内涵是客观反映气候的舒适程度,而人体舒适度的内涵是反映人体主观感受的舒适程度,气候康养旅游指数则是人体舒适度在康养旅游中的应用,反映康养旅游目的地人体热舒适程度.关键词共现分析显示英文研究中关注度较高的指数为通用热气候指数(Universal Thermal Climate Index,UTCI)和湿球温度(Wet Bulb Temperature,WBT),中文研究中关注度较高的指数为风效指数(Wind Effect Index,WEI)、温湿指数(Temperature Humidity Index,THI)和风寒指数(Wind Chill Index,WCI).(2)作者共现分析显示,英文研究作者以Rob Law(Han et al.,2021;Liao et al.,2022)、Jie Zhang(Nian et al.,2019;Liu et al.,2022)和Daniel Scott(Scott and McBoyle,2001;Rutty and Scott,2015;Scott et al.,2016)等人为主;中文研究作者以孙根年、马丽君、王式功和张京红等人在气候康养方向影响力大(马丽君等,2007;孙根年和马丽君,2007;王敏珍等,2012;卢山等,2021;林颖仪等,2021;孙根年,2022;张京红等,2022;张明洁等,2022).(3)发文量前十机构分析显示(表1),英文研究以中国科学院、乌克兰教育科学部、香港理工大学、中国科学院大学和美国佛罗里达州立大学发文量最多;中文研究以南京信息工程大学、陕西师范大学、华东师范大学、成都信息工程大学和同济大学发文量最多.此外,Daniel Scott所属的加拿大滑铁卢大学发表了41篇相关研究被引2 062次,被引量位于第六,也是该领域重要的研究机构. ...
The assessment of the thermal environment. a review
1
1962
... Typical indicators of human comfort
Tab.2 | 分类 | 指数名称 | 缩写 | 研究 | 地理与气象因子 | 人体代谢、服装热阻及其他 | 是否经过验证 |
| 测量拟合及单传感器指数 | 卡他度 | — | Hill et al.,1916 | 气温、风、湿度、长波辐射 | — | 否 |
| 空气温度 | Ta | Macpherson,1962 | 气温 | — | 否 |
| 湿球温度 | WBT | Haldane,1905 | 湿球温度、环境气压 | — | 否 |
| 代数或统计模型 | 风寒指数 | WCI | Siple and Passel,1945 | 气温、风 | — | 否 |
| 温湿指数 | THI | Thom,1959 | 气温、湿度 | — | 是 |
| 综合舒适度指标 | CCI | 陆鼎煌等,1984 | 气温、湿度、风 | — | 否 |
| 基于“黄金分割法”的人体舒适度指数 | — | 王式功等,2013 | 气温、风、湿度、海拔、纬度 | — | 是 |
| 代理热应力和热应变指数 | 生理效应指标 | Ep | Robinson et al.,1945 | 气温、湿度 | 服装、代谢率、心率、直肠温度、皮肤温度、出汗率 | 是 |
| 预计四小时排汗率 | P4SR | McArdle et al.,1947 | 气温、湿球温度、风 | 服装、代谢率、与适应者相关 | 是 |
| 有效温度 | ET | Houghten and Yaglou,1923 | 气温、湿球温度、风 | 服装 | 是 |
| 风效指数 | WEI | Terjung,1966 | 气温、风、太阳辐射 | — | 否 |
| 能量平衡应变和应力指数 | 皮肤温度能量平衡指数 | STEBIDEX | De Freitas,1985;De Freitas,1986;De Freitas,1987 | 气温、风、湿度、长波辐射、太阳辐射 | 服装、代谢率 | 是 |
| 热力感受比 | TAR | Ionides et al.,1945 | 气温、平均辐射温度、湿度 | 代谢率 | 是 |
| 通用热气候指数 | UTCI | Jendritzky et al.,2009 | 气温、湿度、风、太阳辐射、长波辐射 | 服装、代谢率 | 是 |
| 生理等效温度 | PET | Mayer and Höppe,1987 | 气温、平均辐射温度、湿度、风 | 服装、代谢率 | 是 |
| 特定用途指数 | 热适应预测效应 | PEHA | Givoni and Goldman,1973b | 气温、湿度 | 代谢率、直肠温度、心率 | 是 |
| 生物气候距离指数 | BDI | Mateeva and Filipov,2003 | 气温、湿度、风、太阳辐射、长波辐射 | 代谢率 | 否 |
注: “—”表示“无”. ...
Bioclimatic distance index in the Rila-and-Rhodopy area of Bulgaria
1
2003
... Typical indicators of human comfort
Tab.2 | 分类 | 指数名称 | 缩写 | 研究 | 地理与气象因子 | 人体代谢、服装热阻及其他 | 是否经过验证 |
| 测量拟合及单传感器指数 | 卡他度 | — | Hill et al.,1916 | 气温、风、湿度、长波辐射 | — | 否 |
| 空气温度 | Ta | Macpherson,1962 | 气温 | — | 否 |
| 湿球温度 | WBT | Haldane,1905 | 湿球温度、环境气压 | — | 否 |
| 代数或统计模型 | 风寒指数 | WCI | Siple and Passel,1945 | 气温、风 | — | 否 |
| 温湿指数 | THI | Thom,1959 | 气温、湿度 | — | 是 |
| 综合舒适度指标 | CCI | 陆鼎煌等,1984 | 气温、湿度、风 | — | 否 |
| 基于“黄金分割法”的人体舒适度指数 | — | 王式功等,2013 | 气温、风、湿度、海拔、纬度 | — | 是 |
| 代理热应力和热应变指数 | 生理效应指标 | Ep | Robinson et al.,1945 | 气温、湿度 | 服装、代谢率、心率、直肠温度、皮肤温度、出汗率 | 是 |
| 预计四小时排汗率 | P4SR | McArdle et al.,1947 | 气温、湿球温度、风 | 服装、代谢率、与适应者相关 | 是 |
| 有效温度 | ET | Houghten and Yaglou,1923 | 气温、湿球温度、风 | 服装 | 是 |
| 风效指数 | WEI | Terjung,1966 | 气温、风、太阳辐射 | — | 否 |
| 能量平衡应变和应力指数 | 皮肤温度能量平衡指数 | STEBIDEX | De Freitas,1985;De Freitas,1986;De Freitas,1987 | 气温、风、湿度、长波辐射、太阳辐射 | 服装、代谢率 | 是 |
| 热力感受比 | TAR | Ionides et al.,1945 | 气温、平均辐射温度、湿度 | 代谢率 | 是 |
| 通用热气候指数 | UTCI | Jendritzky et al.,2009 | 气温、湿度、风、太阳辐射、长波辐射 | 服装、代谢率 | 是 |
| 生理等效温度 | PET | Mayer and Höppe,1987 | 气温、平均辐射温度、湿度、风 | 服装、代谢率 | 是 |
| 特定用途指数 | 热适应预测效应 | PEHA | Givoni and Goldman,1973b | 气温、湿度 | 代谢率、直肠温度、心率 | 是 |
| 生物气候距离指数 | BDI | Mateeva and Filipov,2003 | 气温、湿度、风、太阳辐射、长波辐射 | 代谢率 | 否 |
注: “—”表示“无”. ...
Thermal comfort of man in different urban environments
1
1987
... 第二阶段,机理模型:合理的人体舒适度模型必须以人体热交换机制为基础,综合考虑环境因素、人体代谢、呼吸散热及服装热阻等因素的综合影响.20世纪70年代,丹麦学者Fanger发表了热舒适方程,提出了预测平均投票(Predicted Mean Vote,PMV)以反映对同一环境大多数人的热舒适度,至今仍被广泛使用(Fanger,1970;Höppe,1997).1987年Mayer和Höppe基于慕尼黑人体热量平衡模型(Munich Energy Balance Model for Individuals,MEMI)推导出生理等效温度(Physiological Equivalent Temperature,PET),综合考虑了各种参数对舒适度的影响(Höppe,1984;Mayer and Höppe,1987).然而,机理模型时代阶段仍存在对人体舒适度的复杂性认识不足的问题,导致对这一复杂系统的学科关系和表述较为单一. ...
The prediction of the physiological effects of warm and hot environments
2
1947
... Typical indicators of human comfort
Tab.2 | 分类 | 指数名称 | 缩写 | 研究 | 地理与气象因子 | 人体代谢、服装热阻及其他 | 是否经过验证 |
| 测量拟合及单传感器指数 | 卡他度 | — | Hill et al.,1916 | 气温、风、湿度、长波辐射 | — | 否 |
| 空气温度 | Ta | Macpherson,1962 | 气温 | — | 否 |
| 湿球温度 | WBT | Haldane,1905 | 湿球温度、环境气压 | — | 否 |
| 代数或统计模型 | 风寒指数 | WCI | Siple and Passel,1945 | 气温、风 | — | 否 |
| 温湿指数 | THI | Thom,1959 | 气温、湿度 | — | 是 |
| 综合舒适度指标 | CCI | 陆鼎煌等,1984 | 气温、湿度、风 | — | 否 |
| 基于“黄金分割法”的人体舒适度指数 | — | 王式功等,2013 | 气温、风、湿度、海拔、纬度 | — | 是 |
| 代理热应力和热应变指数 | 生理效应指标 | Ep | Robinson et al.,1945 | 气温、湿度 | 服装、代谢率、心率、直肠温度、皮肤温度、出汗率 | 是 |
| 预计四小时排汗率 | P4SR | McArdle et al.,1947 | 气温、湿球温度、风 | 服装、代谢率、与适应者相关 | 是 |
| 有效温度 | ET | Houghten and Yaglou,1923 | 气温、湿球温度、风 | 服装 | 是 |
| 风效指数 | WEI | Terjung,1966 | 气温、风、太阳辐射 | — | 否 |
| 能量平衡应变和应力指数 | 皮肤温度能量平衡指数 | STEBIDEX | De Freitas,1985;De Freitas,1986;De Freitas,1987 | 气温、风、湿度、长波辐射、太阳辐射 | 服装、代谢率 | 是 |
| 热力感受比 | TAR | Ionides et al.,1945 | 气温、平均辐射温度、湿度 | 代谢率 | 是 |
| 通用热气候指数 | UTCI | Jendritzky et al.,2009 | 气温、湿度、风、太阳辐射、长波辐射 | 服装、代谢率 | 是 |
| 生理等效温度 | PET | Mayer and Höppe,1987 | 气温、平均辐射温度、湿度、风 | 服装、代谢率 | 是 |
| 特定用途指数 | 热适应预测效应 | PEHA | Givoni and Goldman,1973b | 气温、湿度 | 代谢率、直肠温度、心率 | 是 |
| 生物气候距离指数 | BDI | Mateeva and Filipov,2003 | 气温、湿度、风、太阳辐射、长波辐射 | 代谢率 | 否 |
注: “—”表示“无”. ...
... 代理热应力和热应变指数是适用于热环境的人体舒适度经验模型,针对主动或被动的代谢状态,包括对热条件的绝对测量和相对测量.其典型指数如预计4 h排汗率(Predicted Four Hour Sweat Rate,P4SR),基于人体的排汗率,综合了气温、湿球温度、风、新陈代谢率及服装热阻等因素,可以很好地表示人体的热负荷状况,常用诺模图预测人体在特定环境下未来4 h的排汗量,单位时间排汗量越多时人体的热负荷越大(McArdle et al.,1947);风效指数(Wind Effect Index,WEI)主要反映人体对风、温度和日照的综合感受,即风速和气温对裸露人体热量散失的影响,综合考虑了气温、风、太阳辐射因素,既考虑了体表的散热,也考虑了太阳辐射后人体的增热,被广泛应用于气候舒适度的评价中(Terjung,1966;Havenith and Fiala,2015;王耕等,2022). ...
The tourism climatic index: a method of evaluating world climates for tourism
5
1985
... 人体舒适度是从气象角度评价不同气候条件下人体的舒适状态,根据机体与大气环境之间的热交换制定的生物气象指标(孙美淑和李山,2015).过去一百年中,国内外研发了大量的人体舒适度指标,足见量化人体热舒适环境问题的迫切性和重要性.气候康养是指将人体从有害的气候环境转移到气候条件适宜且利于开展康养的气候康养地,从被动“避害”到主动“趋利”,达到降低疾病风险、增进机体机能和提升健康水平的目的(刘明华,2003;中国气象局公共气象服务中心和中国旅游研究院战略所,2020;林颖仪等,2021).气候康养旅游指数(Tourism Climate Indices,TCIs)是与旅游相关的人体舒适度,旨在表征旅游目的地气候环境状态,综合计量旅行者气候幸福感(Mieczkowski,1985;De Freitas and Grigorieva,2015).国际社会曾多次强调气候与健康相关指标在气候康养产业发展中的重要性,早在2001年世界气象组织(World Meteorological Organization,WMO)气候学委员会的气候与健康工作组就提出将气候与健康相关指标的科学构建作为未来两年的首要工作(WHO,2001).气候康养旅游指数对提升气象部门的服务质量、辅助气候康养目的地决策和促进气候康养产业良性发展具有重要意义(吴昊旻等,2020;卢山等,2021). ...
... 第三阶段,学科交叉:进入21世纪,以通用热气候指数(Universal Thermal Climate Index,UTCI)为代表的指标研发反映出学界对人体舒适度系统性和国际化认识的日益提升,为气候康养等跨学科指标的研发提供了条件(Jendritzky et al.,2012).Mieczkowski(1985)研发了第一个气候康养旅游指数TCI,是目前应用最为广泛的旅游气候舒适性评价模型.随着避暑、海滨、森林和高原等多类型气候康养旅游指数的诞生,人体舒适度研究呈现从单一研究到多元发展的趋势,以往单一分析气候或旅游的研究壁垒正逐渐被打破,为气候康养行业的方法学创新和学科交叉奠定了基础. ...
... Typical indicators of tourism climate indices
Tab.3 | 分类 | 指标名称 | 缩写 | 研究 | 地理与气象因子 | 人体代谢、服装热阻及其他 | 验证与否 |
| 综合 | 度假气候指数:城市 | HCI:Urban | Scott et al.,2016 | 温度、湿度、风、降水、云量 | — | 是 |
| 气候康养旅游指数 | TCI | Mieczkowski,1985 | 温度、湿度、风、降水、日照 | — | 是 |
| 气候旅游指数 | CIT | De Freitas et al.,2008 | 云量、风、降水 | — | 是 |
| 避暑 | 避暑旅游指数 | TSI | 吴普等,2014 | 气温、湿度、风、空气质量 | — | 否 |
| 避暑旅游气象指数 | MIST | 侯亚红等,2018 | 温度、湿度、风、降水、日照、空气质量 | — | 是 |
| 高原 | 旅游气候适宜性指数 | TCSI | Tang et al.,2012 | 温度、湿度、日照、太阳辐射、氧含量、大气压力 | — | 否 |
| 喀斯特洞穴康养功能指数 | IKCH | 贾真真等,2019 | 气温、湿度、风、空气质量、空气离子 | — | 是 |
| 海滨 | 海滩气候指数 | BCI | Morgan et al.,2000 | 降水、风、日照 | 感觉温度、沐浴温度 | 是 |
| 滨海旅游气候指数 | CTCI | Gao et al.,2022 | 温度、湿度、风、降水、日照、空气质量 | — | 是 |
| 森林 | 森林综合保健指数 | FCHI | Zhu et al.,2021 | 氧含量、空气质量 | — | 是 |
| 森林康养指数 | FHI | 郑自君等,2021 | 温度、湿度、空气质量、海拔 | — | 是 |
注: “—”表示“无”. ...
... 典型的综合性气候康养旅游指数如Mieczkowski(1985)构建的第一个气候康养旅游指数(Tourism Climate Index,TCI),是衡量游客气候福祉的综合指标,其综合考虑了温度、湿度、风、降水、日照等气象因子,被广泛应用于评估特定气候对观光和购物等一般旅游活动的适宜性;2008年De Freitas等(2008)构建了第二代气候旅游指数(Climate Index for Tourism,CIT),综合考虑了生理、心理和物理3个维度的影响,优化了大气环境参数组合,提升了数值精度,得到了较好的应用.国内有学者(张富现,2015;蔚丹丹等,2021)将TCI翻译为旅游气候指数,在中医传统康养理念的背景和指导下,本文将其翻译为气候康养旅游指数更为贴切. ...
... 基于我国传统中医“天人合一,趋利避害”的养生准则,气候康养旅游可以帮助人群消除疲劳、加快康复,使身心趋于最佳状态(刘明华,2003;王乐和汪荣斌,2021).随着气候康养旅游的日益盛行,国内外学者构建了大量的气候康养指标(Mieczkowski,1985;Morgan et al.,2000;De Freitas et al.,2008;Tang et al.,2012;吴普,2014;Scott et al.,2016;Zhu et al.,2021).由于我国地域广阔,有多种气候类型的气候康养研究受到广泛关注,但存在以下问题需进一步探讨: ...
An improved user-based beach climate index
3
2000
... Typical indicators of tourism climate indices
Tab.3 | 分类 | 指标名称 | 缩写 | 研究 | 地理与气象因子 | 人体代谢、服装热阻及其他 | 验证与否 |
| 综合 | 度假气候指数:城市 | HCI:Urban | Scott et al.,2016 | 温度、湿度、风、降水、云量 | — | 是 |
| 气候康养旅游指数 | TCI | Mieczkowski,1985 | 温度、湿度、风、降水、日照 | — | 是 |
| 气候旅游指数 | CIT | De Freitas et al.,2008 | 云量、风、降水 | — | 是 |
| 避暑 | 避暑旅游指数 | TSI | 吴普等,2014 | 气温、湿度、风、空气质量 | — | 否 |
| 避暑旅游气象指数 | MIST | 侯亚红等,2018 | 温度、湿度、风、降水、日照、空气质量 | — | 是 |
| 高原 | 旅游气候适宜性指数 | TCSI | Tang et al.,2012 | 温度、湿度、日照、太阳辐射、氧含量、大气压力 | — | 否 |
| 喀斯特洞穴康养功能指数 | IKCH | 贾真真等,2019 | 气温、湿度、风、空气质量、空气离子 | — | 是 |
| 海滨 | 海滩气候指数 | BCI | Morgan et al.,2000 | 降水、风、日照 | 感觉温度、沐浴温度 | 是 |
| 滨海旅游气候指数 | CTCI | Gao et al.,2022 | 温度、湿度、风、降水、日照、空气质量 | — | 是 |
| 森林 | 森林综合保健指数 | FCHI | Zhu et al.,2021 | 氧含量、空气质量 | — | 是 |
| 森林康养指数 | FHI | 郑自君等,2021 | 温度、湿度、空气质量、海拔 | — | 是 |
注: “—”表示“无”. ...
... 避暑旅游指数(Tourist Satisfaction Index,TSI)旨在评估旅游目的地发展避暑旅游的条件,综合考虑了气温、湿度、风和空气质量等气象因子,一方面广泛应用于协助游客选择避暑旅游目的地,另一方面也为目的地避暑旅游的发展与提升提供管理工具(吴普,2014;吴普等,2014).旅游气候适宜性指数(Tourism Climate Suitability Index,TCSI)用于评估高原地区旅游气候适应性,包含温度、湿度、日照、太阳辐射、氧含量和大气压力等气象因子,对气候条件复杂的旅游目的地具有重要的科学意义和实用指导价值(Tang et al.,2012).评估滨海地区气候康养条件的典型指数如海滩气候指数(Beach Climate Index,BCI)和滨海旅游气候指数(Coastal Tourism Climate Index,CTCI),包括降水、日照和风速等气象因子,有助于提高滨海旅游城市的吸引力和可持续发展(Morgan et al.,2000;Gao et al.,2022).森林综合保健指数(Forest Comprehensive Healthcare Index,FCHI)是评估森林康养效益的典型指数,包含氧含量、空气质量等因子,不仅可以为森林治疗的时间和目的地提供必要的选择依据,还可以为森林健康效益的综合评价提供理论依据,有助于今后对森林健康环境的深入研究(Zhu et al.,2021). ...
... 基于我国传统中医“天人合一,趋利避害”的养生准则,气候康养旅游可以帮助人群消除疲劳、加快康复,使身心趋于最佳状态(刘明华,2003;王乐和汪荣斌,2021).随着气候康养旅游的日益盛行,国内外学者构建了大量的气候康养指标(Mieczkowski,1985;Morgan et al.,2000;De Freitas et al.,2008;Tang et al.,2012;吴普,2014;Scott et al.,2016;Zhu et al.,2021).由于我国地域广阔,有多种气候类型的气候康养研究受到广泛关注,但存在以下问题需进一步探讨: ...
1
1997
... 指标构建框架可以针对一个主题,提供一种系统的方法,展示环境和人类健康的联系以科学构建环境健康指标.一个稳健的框架需要有清晰的概念及范围,兼具灵活性、平衡性和实用性(Hambling et al.,2011).气候康养指标的构建应基于指标构建框架,利用循证医学的方法,提升指标的科学性和适用性.Hambling等(2011)系统检索和评价了环境健康领域的指标构建框架,纳入的指标构建框架包括1990年经济合作与发展组织(the Organization for Economic Co-operation and Development,OECD)构建的压力-状态-响应(The Pressure-State-Response,PSR)框架、1997年联合国可持续发展委员会(the United Nations Commission on Sustainable Development,CSD)通过的驱动力-状态-响应(Driving force-State-Response,DSR)框架和1997世界卫生组织(World Health Organization,WHO)构建的驱动力-压力-状态-暴露-影响-行动(Driving Force-Pressure-State-Exposure-Effect-Action,DPSEEA)框架等(OECD,1993;Mortensen,1997),结果显示DPSEEA为最优框架(WHO,2001;Hambling et al.,2011).然而,现有的人体舒适度及气候康养旅游指数在构建时未遵循系统结构化的框架,未来研究进行指标构建时应基于环境健康领域的指标构建框架,有助于更好地评估气候与人类健康之间的关系. ...
Two sides of a coin: a crisis response perspective on tourist community participation in a post-disaster environment
1
2019
... 中英文文献共检索1 852篇,发表于1979—2023年;英文文献共检索9 662篇,发表于1980—2023年.(1)关键词共现分析显示,英文研究主题以旅游满意度、竞争力、海滩、岛屿、生物多样性和气候适宜度等为主[图1(a)];中国学者对气候康养的关注程度较高,中文研究主题以人体舒适度、气候舒适度和康养旅游等为主[图1(b)].气候舒适度的内涵是客观反映气候的舒适程度,而人体舒适度的内涵是反映人体主观感受的舒适程度,气候康养旅游指数则是人体舒适度在康养旅游中的应用,反映康养旅游目的地人体热舒适程度.关键词共现分析显示英文研究中关注度较高的指数为通用热气候指数(Universal Thermal Climate Index,UTCI)和湿球温度(Wet Bulb Temperature,WBT),中文研究中关注度较高的指数为风效指数(Wind Effect Index,WEI)、温湿指数(Temperature Humidity Index,THI)和风寒指数(Wind Chill Index,WCI).(2)作者共现分析显示,英文研究作者以Rob Law(Han et al.,2021;Liao et al.,2022)、Jie Zhang(Nian et al.,2019;Liu et al.,2022)和Daniel Scott(Scott and McBoyle,2001;Rutty and Scott,2015;Scott et al.,2016)等人为主;中文研究作者以孙根年、马丽君、王式功和张京红等人在气候康养方向影响力大(马丽君等,2007;孙根年和马丽君,2007;王敏珍等,2012;卢山等,2021;林颖仪等,2021;孙根年,2022;张京红等,2022;张明洁等,2022).(3)发文量前十机构分析显示(表1),英文研究以中国科学院、乌克兰教育科学部、香港理工大学、中国科学院大学和美国佛罗里达州立大学发文量最多;中文研究以南京信息工程大学、陕西师范大学、华东师范大学、成都信息工程大学和同济大学发文量最多.此外,Daniel Scott所属的加拿大滑铁卢大学发表了41篇相关研究被引2 062次,被引量位于第六,也是该领域重要的研究机构. ...
OECD core set of indicators for environmental performance reviews: a synthesis report by the Group on the State of the Environment
1
1993
... 指标构建框架可以针对一个主题,提供一种系统的方法,展示环境和人类健康的联系以科学构建环境健康指标.一个稳健的框架需要有清晰的概念及范围,兼具灵活性、平衡性和实用性(Hambling et al.,2011).气候康养指标的构建应基于指标构建框架,利用循证医学的方法,提升指标的科学性和适用性.Hambling等(2011)系统检索和评价了环境健康领域的指标构建框架,纳入的指标构建框架包括1990年经济合作与发展组织(the Organization for Economic Co-operation and Development,OECD)构建的压力-状态-响应(The Pressure-State-Response,PSR)框架、1997年联合国可持续发展委员会(the United Nations Commission on Sustainable Development,CSD)通过的驱动力-状态-响应(Driving force-State-Response,DSR)框架和1997世界卫生组织(World Health Organization,WHO)构建的驱动力-压力-状态-暴露-影响-行动(Driving Force-Pressure-State-Exposure-Effect-Action,DPSEEA)框架等(OECD,1993;Mortensen,1997),结果显示DPSEEA为最优框架(WHO,2001;Hambling et al.,2011).然而,现有的人体舒适度及气候康养旅游指数在构建时未遵循系统结构化的框架,未来研究进行指标构建时应基于环境健康领域的指标构建框架,有助于更好地评估气候与人类健康之间的关系. ...
Physiologically equivalent condition of air temperature and humidity
1
1945
... Typical indicators of human comfort
Tab.2 | 分类 | 指数名称 | 缩写 | 研究 | 地理与气象因子 | 人体代谢、服装热阻及其他 | 是否经过验证 |
| 测量拟合及单传感器指数 | 卡他度 | — | Hill et al.,1916 | 气温、风、湿度、长波辐射 | — | 否 |
| 空气温度 | Ta | Macpherson,1962 | 气温 | — | 否 |
| 湿球温度 | WBT | Haldane,1905 | 湿球温度、环境气压 | — | 否 |
| 代数或统计模型 | 风寒指数 | WCI | Siple and Passel,1945 | 气温、风 | — | 否 |
| 温湿指数 | THI | Thom,1959 | 气温、湿度 | — | 是 |
| 综合舒适度指标 | CCI | 陆鼎煌等,1984 | 气温、湿度、风 | — | 否 |
| 基于“黄金分割法”的人体舒适度指数 | — | 王式功等,2013 | 气温、风、湿度、海拔、纬度 | — | 是 |
| 代理热应力和热应变指数 | 生理效应指标 | Ep | Robinson et al.,1945 | 气温、湿度 | 服装、代谢率、心率、直肠温度、皮肤温度、出汗率 | 是 |
| 预计四小时排汗率 | P4SR | McArdle et al.,1947 | 气温、湿球温度、风 | 服装、代谢率、与适应者相关 | 是 |
| 有效温度 | ET | Houghten and Yaglou,1923 | 气温、湿球温度、风 | 服装 | 是 |
| 风效指数 | WEI | Terjung,1966 | 气温、风、太阳辐射 | — | 否 |
| 能量平衡应变和应力指数 | 皮肤温度能量平衡指数 | STEBIDEX | De Freitas,1985;De Freitas,1986;De Freitas,1987 | 气温、风、湿度、长波辐射、太阳辐射 | 服装、代谢率 | 是 |
| 热力感受比 | TAR | Ionides et al.,1945 | 气温、平均辐射温度、湿度 | 代谢率 | 是 |
| 通用热气候指数 | UTCI | Jendritzky et al.,2009 | 气温、湿度、风、太阳辐射、长波辐射 | 服装、代谢率 | 是 |
| 生理等效温度 | PET | Mayer and Höppe,1987 | 气温、平均辐射温度、湿度、风 | 服装、代谢率 | 是 |
| 特定用途指数 | 热适应预测效应 | PEHA | Givoni and Goldman,1973b | 气温、湿度 | 代谢率、直肠温度、心率 | 是 |
| 生物气候距离指数 | BDI | Mateeva and Filipov,2003 | 气温、湿度、风、太阳辐射、长波辐射 | 代谢率 | 否 |
注: “—”表示“无”. ...
Bioclimatic comfort and the thermal perceptions and preferences of beach tourists
1
2015
... 中英文文献共检索1 852篇,发表于1979—2023年;英文文献共检索9 662篇,发表于1980—2023年.(1)关键词共现分析显示,英文研究主题以旅游满意度、竞争力、海滩、岛屿、生物多样性和气候适宜度等为主[图1(a)];中国学者对气候康养的关注程度较高,中文研究主题以人体舒适度、气候舒适度和康养旅游等为主[图1(b)].气候舒适度的内涵是客观反映气候的舒适程度,而人体舒适度的内涵是反映人体主观感受的舒适程度,气候康养旅游指数则是人体舒适度在康养旅游中的应用,反映康养旅游目的地人体热舒适程度.关键词共现分析显示英文研究中关注度较高的指数为通用热气候指数(Universal Thermal Climate Index,UTCI)和湿球温度(Wet Bulb Temperature,WBT),中文研究中关注度较高的指数为风效指数(Wind Effect Index,WEI)、温湿指数(Temperature Humidity Index,THI)和风寒指数(Wind Chill Index,WCI).(2)作者共现分析显示,英文研究作者以Rob Law(Han et al.,2021;Liao et al.,2022)、Jie Zhang(Nian et al.,2019;Liu et al.,2022)和Daniel Scott(Scott and McBoyle,2001;Rutty and Scott,2015;Scott et al.,2016)等人为主;中文研究作者以孙根年、马丽君、王式功和张京红等人在气候康养方向影响力大(马丽君等,2007;孙根年和马丽君,2007;王敏珍等,2012;卢山等,2021;林颖仪等,2021;孙根年,2022;张京红等,2022;张明洁等,2022).(3)发文量前十机构分析显示(表1),英文研究以中国科学院、乌克兰教育科学部、香港理工大学、中国科学院大学和美国佛罗里达州立大学发文量最多;中文研究以南京信息工程大学、陕西师范大学、华东师范大学、成都信息工程大学和同济大学发文量最多.此外,Daniel Scott所属的加拿大滑铁卢大学发表了41篇相关研究被引2 062次,被引量位于第六,也是该领域重要的研究机构. ...
Using a 'tourism climate index' to examine the implications of climate change for climate as a tourism resource
2
2001
... 中英文文献共检索1 852篇,发表于1979—2023年;英文文献共检索9 662篇,发表于1980—2023年.(1)关键词共现分析显示,英文研究主题以旅游满意度、竞争力、海滩、岛屿、生物多样性和气候适宜度等为主[图1(a)];中国学者对气候康养的关注程度较高,中文研究主题以人体舒适度、气候舒适度和康养旅游等为主[图1(b)].气候舒适度的内涵是客观反映气候的舒适程度,而人体舒适度的内涵是反映人体主观感受的舒适程度,气候康养旅游指数则是人体舒适度在康养旅游中的应用,反映康养旅游目的地人体热舒适程度.关键词共现分析显示英文研究中关注度较高的指数为通用热气候指数(Universal Thermal Climate Index,UTCI)和湿球温度(Wet Bulb Temperature,WBT),中文研究中关注度较高的指数为风效指数(Wind Effect Index,WEI)、温湿指数(Temperature Humidity Index,THI)和风寒指数(Wind Chill Index,WCI).(2)作者共现分析显示,英文研究作者以Rob Law(Han et al.,2021;Liao et al.,2022)、Jie Zhang(Nian et al.,2019;Liu et al.,2022)和Daniel Scott(Scott and McBoyle,2001;Rutty and Scott,2015;Scott et al.,2016)等人为主;中文研究作者以孙根年、马丽君、王式功和张京红等人在气候康养方向影响力大(马丽君等,2007;孙根年和马丽君,2007;王敏珍等,2012;卢山等,2021;林颖仪等,2021;孙根年,2022;张京红等,2022;张明洁等,2022).(3)发文量前十机构分析显示(表1),英文研究以中国科学院、乌克兰教育科学部、香港理工大学、中国科学院大学和美国佛罗里达州立大学发文量最多;中文研究以南京信息工程大学、陕西师范大学、华东师范大学、成都信息工程大学和同济大学发文量最多.此外,Daniel Scott所属的加拿大滑铁卢大学发表了41篇相关研究被引2 062次,被引量位于第六,也是该领域重要的研究机构. ...
... 研究显示气温在气候康养指标中所占的权重最高,是目前气候康养指标构建的核心考量因子,其次为降水和日照(Blazejczyk,2001;Brandenburg and Arnberger,2001;Scott and McBoyle,2001).然而,大气污染是影响人体健康的重要危险因素(Song et al.,2022;Ziou et al.,2022).全球疾病负担(Global Burden of Disease,GBD)研究显示,空气污染是全球第四大死亡风险因素(GBD 2019 Diseases and Injuries Collaborators,2020).冬季气温寒冷,此时气温对健康的影响大于污染,尤其对于老年人及高血压等慢性病患者(GBD 2019 Diseases and Injuries Collaborators,2020;陈蕾等,2021;黄开龙等,2021;徐静等,2021).此外,大量研究表明气温和大气污染之间存在协同效应,增加心血管及呼吸系统疾病等发病的风险(Chen et al.,2017;Li et al.,2017;刘楚薇等,2020;Anenberg et al.,2020;Song et al.,2021).建议未来在构建气候康养指标的过程中,纳入简易可得的空气质量指数,探究气温和污染的协同效应,以提升指标的科学性和准确性. ...
An inter-comparison of the holiday climate index (HCI) and the tourism climate index (TCI) in Europe
3
2016
... 中英文文献共检索1 852篇,发表于1979—2023年;英文文献共检索9 662篇,发表于1980—2023年.(1)关键词共现分析显示,英文研究主题以旅游满意度、竞争力、海滩、岛屿、生物多样性和气候适宜度等为主[图1(a)];中国学者对气候康养的关注程度较高,中文研究主题以人体舒适度、气候舒适度和康养旅游等为主[图1(b)].气候舒适度的内涵是客观反映气候的舒适程度,而人体舒适度的内涵是反映人体主观感受的舒适程度,气候康养旅游指数则是人体舒适度在康养旅游中的应用,反映康养旅游目的地人体热舒适程度.关键词共现分析显示英文研究中关注度较高的指数为通用热气候指数(Universal Thermal Climate Index,UTCI)和湿球温度(Wet Bulb Temperature,WBT),中文研究中关注度较高的指数为风效指数(Wind Effect Index,WEI)、温湿指数(Temperature Humidity Index,THI)和风寒指数(Wind Chill Index,WCI).(2)作者共现分析显示,英文研究作者以Rob Law(Han et al.,2021;Liao et al.,2022)、Jie Zhang(Nian et al.,2019;Liu et al.,2022)和Daniel Scott(Scott and McBoyle,2001;Rutty and Scott,2015;Scott et al.,2016)等人为主;中文研究作者以孙根年、马丽君、王式功和张京红等人在气候康养方向影响力大(马丽君等,2007;孙根年和马丽君,2007;王敏珍等,2012;卢山等,2021;林颖仪等,2021;孙根年,2022;张京红等,2022;张明洁等,2022).(3)发文量前十机构分析显示(表1),英文研究以中国科学院、乌克兰教育科学部、香港理工大学、中国科学院大学和美国佛罗里达州立大学发文量最多;中文研究以南京信息工程大学、陕西师范大学、华东师范大学、成都信息工程大学和同济大学发文量最多.此外,Daniel Scott所属的加拿大滑铁卢大学发表了41篇相关研究被引2 062次,被引量位于第六,也是该领域重要的研究机构. ...
... Typical indicators of tourism climate indices
Tab.3 | 分类 | 指标名称 | 缩写 | 研究 | 地理与气象因子 | 人体代谢、服装热阻及其他 | 验证与否 |
| 综合 | 度假气候指数:城市 | HCI:Urban | Scott et al.,2016 | 温度、湿度、风、降水、云量 | — | 是 |
| 气候康养旅游指数 | TCI | Mieczkowski,1985 | 温度、湿度、风、降水、日照 | — | 是 |
| 气候旅游指数 | CIT | De Freitas et al.,2008 | 云量、风、降水 | — | 是 |
| 避暑 | 避暑旅游指数 | TSI | 吴普等,2014 | 气温、湿度、风、空气质量 | — | 否 |
| 避暑旅游气象指数 | MIST | 侯亚红等,2018 | 温度、湿度、风、降水、日照、空气质量 | — | 是 |
| 高原 | 旅游气候适宜性指数 | TCSI | Tang et al.,2012 | 温度、湿度、日照、太阳辐射、氧含量、大气压力 | — | 否 |
| 喀斯特洞穴康养功能指数 | IKCH | 贾真真等,2019 | 气温、湿度、风、空气质量、空气离子 | — | 是 |
| 海滨 | 海滩气候指数 | BCI | Morgan et al.,2000 | 降水、风、日照 | 感觉温度、沐浴温度 | 是 |
| 滨海旅游气候指数 | CTCI | Gao et al.,2022 | 温度、湿度、风、降水、日照、空气质量 | — | 是 |
| 森林 | 森林综合保健指数 | FCHI | Zhu et al.,2021 | 氧含量、空气质量 | — | 是 |
| 森林康养指数 | FHI | 郑自君等,2021 | 温度、湿度、空气质量、海拔 | — | 是 |
注: “—”表示“无”. ...
... 基于我国传统中医“天人合一,趋利避害”的养生准则,气候康养旅游可以帮助人群消除疲劳、加快康复,使身心趋于最佳状态(刘明华,2003;王乐和汪荣斌,2021).随着气候康养旅游的日益盛行,国内外学者构建了大量的气候康养指标(Mieczkowski,1985;Morgan et al.,2000;De Freitas et al.,2008;Tang et al.,2012;吴普,2014;Scott et al.,2016;Zhu et al.,2021).由于我国地域广阔,有多种气候类型的气候康养研究受到广泛关注,但存在以下问题需进一步探讨: ...
Measurements of dry atmospheric cooling in subfreezing temperatures
2
1945
... Typical indicators of human comfort
Tab.2 | 分类 | 指数名称 | 缩写 | 研究 | 地理与气象因子 | 人体代谢、服装热阻及其他 | 是否经过验证 |
| 测量拟合及单传感器指数 | 卡他度 | — | Hill et al.,1916 | 气温、风、湿度、长波辐射 | — | 否 |
| 空气温度 | Ta | Macpherson,1962 | 气温 | — | 否 |
| 湿球温度 | WBT | Haldane,1905 | 湿球温度、环境气压 | — | 否 |
| 代数或统计模型 | 风寒指数 | WCI | Siple and Passel,1945 | 气温、风 | — | 否 |
| 温湿指数 | THI | Thom,1959 | 气温、湿度 | — | 是 |
| 综合舒适度指标 | CCI | 陆鼎煌等,1984 | 气温、湿度、风 | — | 否 |
| 基于“黄金分割法”的人体舒适度指数 | — | 王式功等,2013 | 气温、风、湿度、海拔、纬度 | — | 是 |
| 代理热应力和热应变指数 | 生理效应指标 | Ep | Robinson et al.,1945 | 气温、湿度 | 服装、代谢率、心率、直肠温度、皮肤温度、出汗率 | 是 |
| 预计四小时排汗率 | P4SR | McArdle et al.,1947 | 气温、湿球温度、风 | 服装、代谢率、与适应者相关 | 是 |
| 有效温度 | ET | Houghten and Yaglou,1923 | 气温、湿球温度、风 | 服装 | 是 |
| 风效指数 | WEI | Terjung,1966 | 气温、风、太阳辐射 | — | 否 |
| 能量平衡应变和应力指数 | 皮肤温度能量平衡指数 | STEBIDEX | De Freitas,1985;De Freitas,1986;De Freitas,1987 | 气温、风、湿度、长波辐射、太阳辐射 | 服装、代谢率 | 是 |
| 热力感受比 | TAR | Ionides et al.,1945 | 气温、平均辐射温度、湿度 | 代谢率 | 是 |
| 通用热气候指数 | UTCI | Jendritzky et al.,2009 | 气温、湿度、风、太阳辐射、长波辐射 | 服装、代谢率 | 是 |
| 生理等效温度 | PET | Mayer and Höppe,1987 | 气温、平均辐射温度、湿度、风 | 服装、代谢率 | 是 |
| 特定用途指数 | 热适应预测效应 | PEHA | Givoni and Goldman,1973b | 气温、湿度 | 代谢率、直肠温度、心率 | 是 |
| 生物气候距离指数 | BDI | Mateeva and Filipov,2003 | 气温、湿度、风、太阳辐射、长波辐射 | 代谢率 | 否 |
注: “—”表示“无”. ...
... 代数或统计模型是基于经验或统计学方法构建的人体舒适度模型,针对主动或被动的代谢状态,也是对热条件的绝对测量.其典型指数如风寒指数(Wind Chill Index,WCI),是指皮肤温度为33 ℃时皮肤表面的冷却速率,综合考虑了气温和风两种因素,体现了人们在冬天对温度和风速的综合感受(Siple and Passel,1945;王耕等,2022);WCI作为可预知未来的“体感”的指标,一方面有助于及时采取预防风寒的措施,另一方面可以指导人们更加科学、合理地来安排出行、工作和起居.此外还有不适指数(Discomfort Index),用于描述夏季湿热天气对人体的影响,之后进一步修正更名为温湿指数(Temperature Humidity Index,THI),THI通过气温和相对湿度的组合,反映人体对周围环境的热量交换,从而反映在不同气温和相对湿度的组合下人体感到舒适的程度,是目前最常见的舒适度指标之一(Thom,1957;Thom,1959). ...
Is short-term and long-term exposure to black carbon associated with cardiovascular and respiratory diseases? A systematic review and meta-analysis based on evidence reliability
1
2022
... 研究显示气温在气候康养指标中所占的权重最高,是目前气候康养指标构建的核心考量因子,其次为降水和日照(Blazejczyk,2001;Brandenburg and Arnberger,2001;Scott and McBoyle,2001).然而,大气污染是影响人体健康的重要危险因素(Song et al.,2022;Ziou et al.,2022).全球疾病负担(Global Burden of Disease,GBD)研究显示,空气污染是全球第四大死亡风险因素(GBD 2019 Diseases and Injuries Collaborators,2020).冬季气温寒冷,此时气温对健康的影响大于污染,尤其对于老年人及高血压等慢性病患者(GBD 2019 Diseases and Injuries Collaborators,2020;陈蕾等,2021;黄开龙等,2021;徐静等,2021).此外,大量研究表明气温和大气污染之间存在协同效应,增加心血管及呼吸系统疾病等发病的风险(Chen et al.,2017;Li et al.,2017;刘楚薇等,2020;Anenberg et al.,2020;Song et al.,2021).建议未来在构建气候康养指标的过程中,纳入简易可得的空气质量指数,探究气温和污染的协同效应,以提升指标的科学性和准确性. ...
The impact of main air pollutants on respiratory emergency department visits and the modification effects of temperature in Beijing, China
1
2021
... 研究显示气温在气候康养指标中所占的权重最高,是目前气候康养指标构建的核心考量因子,其次为降水和日照(Blazejczyk,2001;Brandenburg and Arnberger,2001;Scott and McBoyle,2001).然而,大气污染是影响人体健康的重要危险因素(Song et al.,2022;Ziou et al.,2022).全球疾病负担(Global Burden of Disease,GBD)研究显示,空气污染是全球第四大死亡风险因素(GBD 2019 Diseases and Injuries Collaborators,2020).冬季气温寒冷,此时气温对健康的影响大于污染,尤其对于老年人及高血压等慢性病患者(GBD 2019 Diseases and Injuries Collaborators,2020;陈蕾等,2021;黄开龙等,2021;徐静等,2021).此外,大量研究表明气温和大气污染之间存在协同效应,增加心血管及呼吸系统疾病等发病的风险(Chen et al.,2017;Li et al.,2017;刘楚薇等,2020;Anenberg et al.,2020;Song et al.,2021).建议未来在构建气候康养指标的过程中,纳入简易可得的空气质量指数,探究气温和污染的协同效应,以提升指标的科学性和准确性. ...
A comprehensive evaluation of tourism climate suitability in Qinghai Province, China
3
2012
... Typical indicators of tourism climate indices
Tab.3 | 分类 | 指标名称 | 缩写 | 研究 | 地理与气象因子 | 人体代谢、服装热阻及其他 | 验证与否 |
| 综合 | 度假气候指数:城市 | HCI:Urban | Scott et al.,2016 | 温度、湿度、风、降水、云量 | — | 是 |
| 气候康养旅游指数 | TCI | Mieczkowski,1985 | 温度、湿度、风、降水、日照 | — | 是 |
| 气候旅游指数 | CIT | De Freitas et al.,2008 | 云量、风、降水 | — | 是 |
| 避暑 | 避暑旅游指数 | TSI | 吴普等,2014 | 气温、湿度、风、空气质量 | — | 否 |
| 避暑旅游气象指数 | MIST | 侯亚红等,2018 | 温度、湿度、风、降水、日照、空气质量 | — | 是 |
| 高原 | 旅游气候适宜性指数 | TCSI | Tang et al.,2012 | 温度、湿度、日照、太阳辐射、氧含量、大气压力 | — | 否 |
| 喀斯特洞穴康养功能指数 | IKCH | 贾真真等,2019 | 气温、湿度、风、空气质量、空气离子 | — | 是 |
| 海滨 | 海滩气候指数 | BCI | Morgan et al.,2000 | 降水、风、日照 | 感觉温度、沐浴温度 | 是 |
| 滨海旅游气候指数 | CTCI | Gao et al.,2022 | 温度、湿度、风、降水、日照、空气质量 | — | 是 |
| 森林 | 森林综合保健指数 | FCHI | Zhu et al.,2021 | 氧含量、空气质量 | — | 是 |
| 森林康养指数 | FHI | 郑自君等,2021 | 温度、湿度、空气质量、海拔 | — | 是 |
注: “—”表示“无”. ...
... 避暑旅游指数(Tourist Satisfaction Index,TSI)旨在评估旅游目的地发展避暑旅游的条件,综合考虑了气温、湿度、风和空气质量等气象因子,一方面广泛应用于协助游客选择避暑旅游目的地,另一方面也为目的地避暑旅游的发展与提升提供管理工具(吴普,2014;吴普等,2014).旅游气候适宜性指数(Tourism Climate Suitability Index,TCSI)用于评估高原地区旅游气候适应性,包含温度、湿度、日照、太阳辐射、氧含量和大气压力等气象因子,对气候条件复杂的旅游目的地具有重要的科学意义和实用指导价值(Tang et al.,2012).评估滨海地区气候康养条件的典型指数如海滩气候指数(Beach Climate Index,BCI)和滨海旅游气候指数(Coastal Tourism Climate Index,CTCI),包括降水、日照和风速等气象因子,有助于提高滨海旅游城市的吸引力和可持续发展(Morgan et al.,2000;Gao et al.,2022).森林综合保健指数(Forest Comprehensive Healthcare Index,FCHI)是评估森林康养效益的典型指数,包含氧含量、空气质量等因子,不仅可以为森林治疗的时间和目的地提供必要的选择依据,还可以为森林健康效益的综合评价提供理论依据,有助于今后对森林健康环境的深入研究(Zhu et al.,2021). ...
... 基于我国传统中医“天人合一,趋利避害”的养生准则,气候康养旅游可以帮助人群消除疲劳、加快康复,使身心趋于最佳状态(刘明华,2003;王乐和汪荣斌,2021).随着气候康养旅游的日益盛行,国内外学者构建了大量的气候康养指标(Mieczkowski,1985;Morgan et al.,2000;De Freitas et al.,2008;Tang et al.,2012;吴普,2014;Scott et al.,2016;Zhu et al.,2021).由于我国地域广阔,有多种气候类型的气候康养研究受到广泛关注,但存在以下问题需进一步探讨: ...
Physiologic climates of the conterminous United States: a bioclimatic classification based on man
2
1966
... Typical indicators of human comfort
Tab.2 | 分类 | 指数名称 | 缩写 | 研究 | 地理与气象因子 | 人体代谢、服装热阻及其他 | 是否经过验证 |
| 测量拟合及单传感器指数 | 卡他度 | — | Hill et al.,1916 | 气温、风、湿度、长波辐射 | — | 否 |
| 空气温度 | Ta | Macpherson,1962 | 气温 | — | 否 |
| 湿球温度 | WBT | Haldane,1905 | 湿球温度、环境气压 | — | 否 |
| 代数或统计模型 | 风寒指数 | WCI | Siple and Passel,1945 | 气温、风 | — | 否 |
| 温湿指数 | THI | Thom,1959 | 气温、湿度 | — | 是 |
| 综合舒适度指标 | CCI | 陆鼎煌等,1984 | 气温、湿度、风 | — | 否 |
| 基于“黄金分割法”的人体舒适度指数 | — | 王式功等,2013 | 气温、风、湿度、海拔、纬度 | — | 是 |
| 代理热应力和热应变指数 | 生理效应指标 | Ep | Robinson et al.,1945 | 气温、湿度 | 服装、代谢率、心率、直肠温度、皮肤温度、出汗率 | 是 |
| 预计四小时排汗率 | P4SR | McArdle et al.,1947 | 气温、湿球温度、风 | 服装、代谢率、与适应者相关 | 是 |
| 有效温度 | ET | Houghten and Yaglou,1923 | 气温、湿球温度、风 | 服装 | 是 |
| 风效指数 | WEI | Terjung,1966 | 气温、风、太阳辐射 | — | 否 |
| 能量平衡应变和应力指数 | 皮肤温度能量平衡指数 | STEBIDEX | De Freitas,1985;De Freitas,1986;De Freitas,1987 | 气温、风、湿度、长波辐射、太阳辐射 | 服装、代谢率 | 是 |
| 热力感受比 | TAR | Ionides et al.,1945 | 气温、平均辐射温度、湿度 | 代谢率 | 是 |
| 通用热气候指数 | UTCI | Jendritzky et al.,2009 | 气温、湿度、风、太阳辐射、长波辐射 | 服装、代谢率 | 是 |
| 生理等效温度 | PET | Mayer and Höppe,1987 | 气温、平均辐射温度、湿度、风 | 服装、代谢率 | 是 |
| 特定用途指数 | 热适应预测效应 | PEHA | Givoni and Goldman,1973b | 气温、湿度 | 代谢率、直肠温度、心率 | 是 |
| 生物气候距离指数 | BDI | Mateeva and Filipov,2003 | 气温、湿度、风、太阳辐射、长波辐射 | 代谢率 | 否 |
注: “—”表示“无”. ...
... 代理热应力和热应变指数是适用于热环境的人体舒适度经验模型,针对主动或被动的代谢状态,包括对热条件的绝对测量和相对测量.其典型指数如预计4 h排汗率(Predicted Four Hour Sweat Rate,P4SR),基于人体的排汗率,综合了气温、湿球温度、风、新陈代谢率及服装热阻等因素,可以很好地表示人体的热负荷状况,常用诺模图预测人体在特定环境下未来4 h的排汗量,单位时间排汗量越多时人体的热负荷越大(McArdle et al.,1947);风效指数(Wind Effect Index,WEI)主要反映人体对风、温度和日照的综合感受,即风速和气温对裸露人体热量散失的影响,综合考虑了气温、风、太阳辐射因素,既考虑了体表的散热,也考虑了太阳辐射后人体的增热,被广泛应用于气候舒适度的评价中(Terjung,1966;Havenith and Fiala,2015;王耕等,2022). ...
A new concept of cooling degree days
1
1957
... 代数或统计模型是基于经验或统计学方法构建的人体舒适度模型,针对主动或被动的代谢状态,也是对热条件的绝对测量.其典型指数如风寒指数(Wind Chill Index,WCI),是指皮肤温度为33 ℃时皮肤表面的冷却速率,综合考虑了气温和风两种因素,体现了人们在冬天对温度和风速的综合感受(Siple and Passel,1945;王耕等,2022);WCI作为可预知未来的“体感”的指标,一方面有助于及时采取预防风寒的措施,另一方面可以指导人们更加科学、合理地来安排出行、工作和起居.此外还有不适指数(Discomfort Index),用于描述夏季湿热天气对人体的影响,之后进一步修正更名为温湿指数(Temperature Humidity Index,THI),THI通过气温和相对湿度的组合,反映人体对周围环境的热量交换,从而反映在不同气温和相对湿度的组合下人体感到舒适的程度,是目前最常见的舒适度指标之一(Thom,1957;Thom,1959). ...
The discomfort index
2
1959
... Typical indicators of human comfort
Tab.2 | 分类 | 指数名称 | 缩写 | 研究 | 地理与气象因子 | 人体代谢、服装热阻及其他 | 是否经过验证 |
| 测量拟合及单传感器指数 | 卡他度 | — | Hill et al.,1916 | 气温、风、湿度、长波辐射 | — | 否 |
| 空气温度 | Ta | Macpherson,1962 | 气温 | — | 否 |
| 湿球温度 | WBT | Haldane,1905 | 湿球温度、环境气压 | — | 否 |
| 代数或统计模型 | 风寒指数 | WCI | Siple and Passel,1945 | 气温、风 | — | 否 |
| 温湿指数 | THI | Thom,1959 | 气温、湿度 | — | 是 |
| 综合舒适度指标 | CCI | 陆鼎煌等,1984 | 气温、湿度、风 | — | 否 |
| 基于“黄金分割法”的人体舒适度指数 | — | 王式功等,2013 | 气温、风、湿度、海拔、纬度 | — | 是 |
| 代理热应力和热应变指数 | 生理效应指标 | Ep | Robinson et al.,1945 | 气温、湿度 | 服装、代谢率、心率、直肠温度、皮肤温度、出汗率 | 是 |
| 预计四小时排汗率 | P4SR | McArdle et al.,1947 | 气温、湿球温度、风 | 服装、代谢率、与适应者相关 | 是 |
| 有效温度 | ET | Houghten and Yaglou,1923 | 气温、湿球温度、风 | 服装 | 是 |
| 风效指数 | WEI | Terjung,1966 | 气温、风、太阳辐射 | — | 否 |
| 能量平衡应变和应力指数 | 皮肤温度能量平衡指数 | STEBIDEX | De Freitas,1985;De Freitas,1986;De Freitas,1987 | 气温、风、湿度、长波辐射、太阳辐射 | 服装、代谢率 | 是 |
| 热力感受比 | TAR | Ionides et al.,1945 | 气温、平均辐射温度、湿度 | 代谢率 | 是 |
| 通用热气候指数 | UTCI | Jendritzky et al.,2009 | 气温、湿度、风、太阳辐射、长波辐射 | 服装、代谢率 | 是 |
| 生理等效温度 | PET | Mayer and Höppe,1987 | 气温、平均辐射温度、湿度、风 | 服装、代谢率 | 是 |
| 特定用途指数 | 热适应预测效应 | PEHA | Givoni and Goldman,1973b | 气温、湿度 | 代谢率、直肠温度、心率 | 是 |
| 生物气候距离指数 | BDI | Mateeva and Filipov,2003 | 气温、湿度、风、太阳辐射、长波辐射 | 代谢率 | 否 |
注: “—”表示“无”. ...
... 代数或统计模型是基于经验或统计学方法构建的人体舒适度模型,针对主动或被动的代谢状态,也是对热条件的绝对测量.其典型指数如风寒指数(Wind Chill Index,WCI),是指皮肤温度为33 ℃时皮肤表面的冷却速率,综合考虑了气温和风两种因素,体现了人们在冬天对温度和风速的综合感受(Siple and Passel,1945;王耕等,2022);WCI作为可预知未来的“体感”的指标,一方面有助于及时采取预防风寒的措施,另一方面可以指导人们更加科学、合理地来安排出行、工作和起居.此外还有不适指数(Discomfort Index),用于描述夏季湿热天气对人体的影响,之后进一步修正更名为温湿指数(Temperature Humidity Index,THI),THI通过气温和相对湿度的组合,反映人体对周围环境的热量交换,从而反映在不同气温和相对湿度的组合下人体感到舒适的程度,是目前最常见的舒适度指标之一(Thom,1957;Thom,1959). ...
A comparison of two techniques for bibliometric mapping: multidimensional scaling and VOS
1
2010
... 本研究系统检索了Web of Science(WOS)数据库和中国国家知识基础设施(China National Knowledge Infrastructure,CNKI)数据库,检索时间截至2023年2月4日,主要中文检索词包括:气候康养、森林康养、康养旅游、气候舒适、旅游气候、气候疗法、气候养生、人体舒适、指标、指数、度;主要英文检索词包括:climate health, thermal climate, holiday climate, forest well, forest therapy, spring therapy, forest travel, spa travel, tourism, health travel, healthy travel, nature travel, climate comfort, tourism comfort, tourist comfort, travel comfort, ocean well, ocean therapy, mountain well, mountain therapy, indicator, index, indices.经过数据清洗和整理,使用VOSviewer 1.6.18软件,针对WOS和CNKI检索的中英文文献结果,分析气候康养指标的中英文关键词、主要作者和研究机构.VOSviewer是荷兰莱顿大学的Van Eck等(2010)开发的一款免费文献计量分析软件,可用于绘制科学知识图谱,基于文献的共引和共被引原理,用可视化方法分析学科发展动态及趋势.可视化图谱中圆圈及字体大小代表权重高低,同一个聚类的圆圈颜色相同,圆圈间的连线表示其曾共同出现,可体现各关键词及作者间的联系. ...
Monitoring health impacts of climate change in Europe: meeting report
2
2001
... 人体舒适度是从气象角度评价不同气候条件下人体的舒适状态,根据机体与大气环境之间的热交换制定的生物气象指标(孙美淑和李山,2015).过去一百年中,国内外研发了大量的人体舒适度指标,足见量化人体热舒适环境问题的迫切性和重要性.气候康养是指将人体从有害的气候环境转移到气候条件适宜且利于开展康养的气候康养地,从被动“避害”到主动“趋利”,达到降低疾病风险、增进机体机能和提升健康水平的目的(刘明华,2003;中国气象局公共气象服务中心和中国旅游研究院战略所,2020;林颖仪等,2021).气候康养旅游指数(Tourism Climate Indices,TCIs)是与旅游相关的人体舒适度,旨在表征旅游目的地气候环境状态,综合计量旅行者气候幸福感(Mieczkowski,1985;De Freitas and Grigorieva,2015).国际社会曾多次强调气候与健康相关指标在气候康养产业发展中的重要性,早在2001年世界气象组织(World Meteorological Organization,WMO)气候学委员会的气候与健康工作组就提出将气候与健康相关指标的科学构建作为未来两年的首要工作(WHO,2001).气候康养旅游指数对提升气象部门的服务质量、辅助气候康养目的地决策和促进气候康养产业良性发展具有重要意义(吴昊旻等,2020;卢山等,2021). ...
... 指标构建框架可以针对一个主题,提供一种系统的方法,展示环境和人类健康的联系以科学构建环境健康指标.一个稳健的框架需要有清晰的概念及范围,兼具灵活性、平衡性和实用性(Hambling et al.,2011).气候康养指标的构建应基于指标构建框架,利用循证医学的方法,提升指标的科学性和适用性.Hambling等(2011)系统检索和评价了环境健康领域的指标构建框架,纳入的指标构建框架包括1990年经济合作与发展组织(the Organization for Economic Co-operation and Development,OECD)构建的压力-状态-响应(The Pressure-State-Response,PSR)框架、1997年联合国可持续发展委员会(the United Nations Commission on Sustainable Development,CSD)通过的驱动力-状态-响应(Driving force-State-Response,DSR)框架和1997世界卫生组织(World Health Organization,WHO)构建的驱动力-压力-状态-暴露-影响-行动(Driving Force-Pressure-State-Exposure-Effect-Action,DPSEEA)框架等(OECD,1993;Mortensen,1997),结果显示DPSEEA为最优框架(WHO,2001;Hambling et al.,2011).然而,现有的人体舒适度及气候康养旅游指数在构建时未遵循系统结构化的框架,未来研究进行指标构建时应基于环境健康领域的指标构建框架,有助于更好地评估气候与人类健康之间的关系. ...
Control of heat casualties at military training centers
1
1957
... 第一阶段,经验公式:20世纪初,学者使用仪器直接测量环境舒适度,如1905年Haldane提出的湿球温度(Wet-bulb thermometer)和1916年Hill提出的卡他度(Kata thermometer)(Haldane,1905;Hill and Hargood-Ash,1919).20世纪20年代开始出现的经验模型是以人类的主观感觉或生理反应为依据,以经验或统计学方法建立的人体舒适模型(Houghten and Yaglou,1923).经验模型包括热环境、冷环境以及普适性环境(闫业超等,2013;孙美淑和李山,2015).1923年Houghton和Yaglou提出了有效温度(Effective Temperature,ET)指数以评估热舒适度,开创了人体气候舒适度经验模型的先河(Houghten and Yaglou,1923).1957年Yaglou和Minard提出了湿球黑球温度指数(Wet Bulb Globe Temperature,WBGT)以预防军事训练中的热损伤事故,WBGT也成为了世界上应用最为广泛的经验热环境评价指数(Yaglou and Minard,1957;孙美淑和李山,2015).人体舒适度经验测度模型在“单设备测量”的基础上由“多要素建模”到“多指数组合”变化,并实现了从“单环境适用”到“环境普适”的演进(孙美淑和李山,2015). ...
Comprehensive evaluation of healthcare benefits of different forest types: a case study in Shimen National Forest Park, China
3
2021
... Typical indicators of tourism climate indices
Tab.3 | 分类 | 指标名称 | 缩写 | 研究 | 地理与气象因子 | 人体代谢、服装热阻及其他 | 验证与否 |
| 综合 | 度假气候指数:城市 | HCI:Urban | Scott et al.,2016 | 温度、湿度、风、降水、云量 | — | 是 |
| 气候康养旅游指数 | TCI | Mieczkowski,1985 | 温度、湿度、风、降水、日照 | — | 是 |
| 气候旅游指数 | CIT | De Freitas et al.,2008 | 云量、风、降水 | — | 是 |
| 避暑 | 避暑旅游指数 | TSI | 吴普等,2014 | 气温、湿度、风、空气质量 | — | 否 |
| 避暑旅游气象指数 | MIST | 侯亚红等,2018 | 温度、湿度、风、降水、日照、空气质量 | — | 是 |
| 高原 | 旅游气候适宜性指数 | TCSI | Tang et al.,2012 | 温度、湿度、日照、太阳辐射、氧含量、大气压力 | — | 否 |
| 喀斯特洞穴康养功能指数 | IKCH | 贾真真等,2019 | 气温、湿度、风、空气质量、空气离子 | — | 是 |
| 海滨 | 海滩气候指数 | BCI | Morgan et al.,2000 | 降水、风、日照 | 感觉温度、沐浴温度 | 是 |
| 滨海旅游气候指数 | CTCI | Gao et al.,2022 | 温度、湿度、风、降水、日照、空气质量 | — | 是 |
| 森林 | 森林综合保健指数 | FCHI | Zhu et al.,2021 | 氧含量、空气质量 | — | 是 |
| 森林康养指数 | FHI | 郑自君等,2021 | 温度、湿度、空气质量、海拔 | — | 是 |
注: “—”表示“无”. ...
... 避暑旅游指数(Tourist Satisfaction Index,TSI)旨在评估旅游目的地发展避暑旅游的条件,综合考虑了气温、湿度、风和空气质量等气象因子,一方面广泛应用于协助游客选择避暑旅游目的地,另一方面也为目的地避暑旅游的发展与提升提供管理工具(吴普,2014;吴普等,2014).旅游气候适宜性指数(Tourism Climate Suitability Index,TCSI)用于评估高原地区旅游气候适应性,包含温度、湿度、日照、太阳辐射、氧含量和大气压力等气象因子,对气候条件复杂的旅游目的地具有重要的科学意义和实用指导价值(Tang et al.,2012).评估滨海地区气候康养条件的典型指数如海滩气候指数(Beach Climate Index,BCI)和滨海旅游气候指数(Coastal Tourism Climate Index,CTCI),包括降水、日照和风速等气象因子,有助于提高滨海旅游城市的吸引力和可持续发展(Morgan et al.,2000;Gao et al.,2022).森林综合保健指数(Forest Comprehensive Healthcare Index,FCHI)是评估森林康养效益的典型指数,包含氧含量、空气质量等因子,不仅可以为森林治疗的时间和目的地提供必要的选择依据,还可以为森林健康效益的综合评价提供理论依据,有助于今后对森林健康环境的深入研究(Zhu et al.,2021). ...
... 基于我国传统中医“天人合一,趋利避害”的养生准则,气候康养旅游可以帮助人群消除疲劳、加快康复,使身心趋于最佳状态(刘明华,2003;王乐和汪荣斌,2021).随着气候康养旅游的日益盛行,国内外学者构建了大量的气候康养指标(Mieczkowski,1985;Morgan et al.,2000;De Freitas et al.,2008;Tang et al.,2012;吴普,2014;Scott et al.,2016;Zhu et al.,2021).由于我国地域广阔,有多种气候类型的气候康养研究受到广泛关注,但存在以下问题需进一步探讨: ...
Outdoor particulate matter exposure and upper respiratory tract infections in children and adolescents: a systematic review and meta-analysis
1
2022
... 研究显示气温在气候康养指标中所占的权重最高,是目前气候康养指标构建的核心考量因子,其次为降水和日照(Blazejczyk,2001;Brandenburg and Arnberger,2001;Scott and McBoyle,2001).然而,大气污染是影响人体健康的重要危险因素(Song et al.,2022;Ziou et al.,2022).全球疾病负担(Global Burden of Disease,GBD)研究显示,空气污染是全球第四大死亡风险因素(GBD 2019 Diseases and Injuries Collaborators,2020).冬季气温寒冷,此时气温对健康的影响大于污染,尤其对于老年人及高血压等慢性病患者(GBD 2019 Diseases and Injuries Collaborators,2020;陈蕾等,2021;黄开龙等,2021;徐静等,2021).此外,大量研究表明气温和大气污染之间存在协同效应,增加心血管及呼吸系统疾病等发病的风险(Chen et al.,2017;Li et al.,2017;刘楚薇等,2020;Anenberg et al.,2020;Song et al.,2021).建议未来在构建气候康养指标的过程中,纳入简易可得的空气质量指数,探究气温和污染的协同效应,以提升指标的科学性和准确性. ...


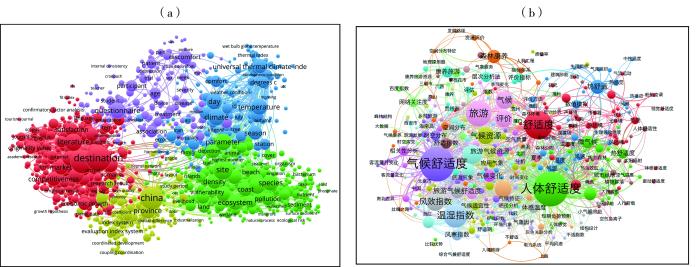
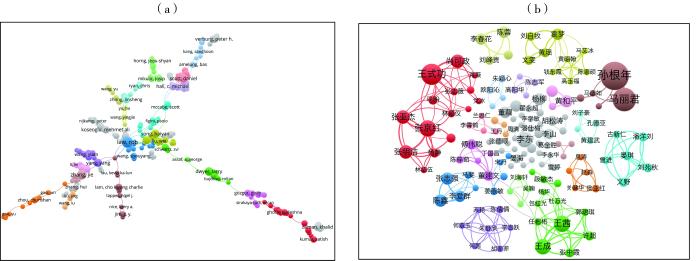
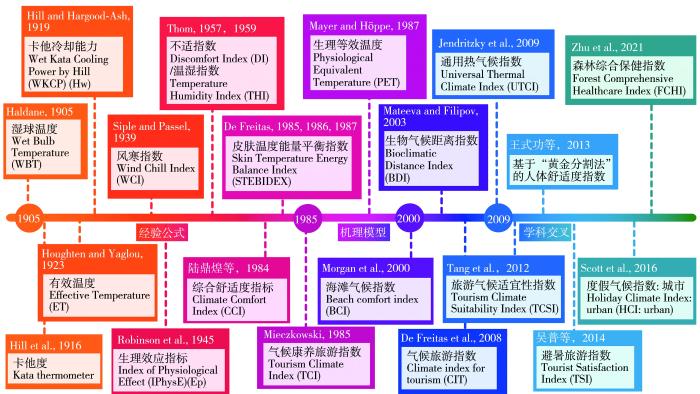


