

引言
宁夏贺兰山东麓有独特的气候、土壤资源和地理条件,是国际公认的出产酿酒葡萄的“黄金地带”(王静芳等,2007)。习近平总书记2020年视察宁夏葡萄酒产业时,寄予了引领中国葡萄酒“当惊世界殊”的殷切期望。近年来,迅速发展的贺兰山东麓葡萄酒产业已成为促进当地经济稳定增长和保障就业的重要支柱和优势特色产业(高冬鹤等,2022)。国内外学者对贺兰山东麓酿酒葡萄的研究方兴未艾,主要集中于气象条件、土壤肥力和水分条件等对酿酒葡萄产量及品质的影响(Gougeon et al.,2018;杨凡,2020;纪立东等,2021;冯蕊等,2022;Geng et al.,2022),葡萄气象灾害(王素艳等,2017;李从娟等,2021;李芳红等,2022),栽培技术、品种选育及抗逆性(陈仁伟等,2020;吴轩等,2022;马军等,2023),病虫害的发生发展及防治(冯蕊等,2021;李文学等,2020)等方面,但对贺兰山东麓土壤热特性的研究还鲜见报道。研究表明,土壤热特性显著影响农业生产和作物的生长发育,如不同覆盖方式对土壤温度影响不同,从而影响食葵的生理生长和产量(郭小龙等,2020);覆膜影响土壤热通量及土壤温度分布,最终对马铃薯不同阶段生长发育及产量都有显著影响(张友良等,2020);覆盖作物可改善土壤热特性,可为玉米种植提升籽粒产量及经济效益(张俊丽等,2017;Mendis et al.,2022),玉米地土壤含水量和热特性的关系,可为精确灌溉等农业管理提供依据(Gamage et al.,2019)。因此,开展贺兰山东麓酿酒葡萄种植区土壤热特性研究对酿酒葡萄生产管理具有重要意义。
不同土壤的热特性不同(李毅等,2003;刘经星等,2010),同一土壤的热特性在不同时段也会有差异(Brunetti et al.,2022),土壤的热特性主要受土壤组成成分、土壤结构、土壤含水量和土壤温度等因素影响(Polyakov et al.,2021;胡继超等,2022)。表征土壤热特性的3个物理参数是导热率、热容量和热扩散率,反映土壤温度的变化速度、保持和传输热量的能力(付永威等,2014)。研究土壤热特性通常只研究热扩散率,通过土壤热扩散率不仅可以了解土壤热传递能力,还可以模拟土壤温度和热通量(孔丽静等,2011)。土壤热扩散率的计算通常有振幅法、相位法、热传导法以及热传导对流法(缪育聪等,2012;周亚等,2018),在干旱半干旱区下垫面土壤含水率低、水分垂直运动弱的条件下,用热传导方法模拟土壤温度、计算土壤热扩散率更有优势(张海宏等,2011)。贺兰山东麓属于干旱半干旱区,冬季葡萄园区水分垂直运动弱,本文基于2021/2022年冬季宁夏贺兰山东麓酿酒葡萄种植区10个葡萄园地温观测资料,采用热传导方法分析贺兰山东麓葡萄种植区土壤热力特性。贺兰山东麓酿酒葡萄越冬需要埋土防寒(张光弟等,2021),研究贺兰山东麓酿酒葡萄种植区冬季土壤热特性可为葡萄越冬埋土管理和葡萄根部土壤温度预测提供可靠依据。
1 资料与方法
1.1 研究区概况
宁夏贺兰山东麓(105°45'E—106°47'E,37°43'N—39°23'N)地处西北干旱区、东部季风区和青藏高寒区的交汇地带,为贺兰山东麓冲积扇与黄河冲积平原之间的宽阔地带,贺兰山东麓酿酒葡萄种植区北起石嘴山市大武口区,最南端至吴忠市红寺堡区,涉及30余个乡镇,规划土地超过20× 104 hm2。因洪水携带的砾石和砂土等在各地沉积不均匀,酿酒葡萄种植区土壤类型丰富,靠近贺兰山土壤砾石含量高,往东风沙土含量高。
对联合国粮农组织(Food and Agriculture Organization of the United Nations, FAO)和维也纳国际应用系统研究所(International Institute for Applied System Analysis, IIASA)2009年构建的基于世界土壤数据库(Harmonized World Soil Database version 1.1, HWSD)的中国土壤数据集[数据来源于国家冰川冻土沙漠科学数据中心(http://www.ncdc.ac.cn)]进行提取和分析得到宁夏贺兰山东麓表层各类土壤类型属性(表1)和表层土壤类型分布(图1)。
表1 宁夏贺兰山东麓主要土壤类型属性
Tab.1
| 土质类型 | 砾石含量 | 沙含量 | 淤泥含量 | 黏土含量 | 有机碳含量 | 石灰石含量 |
|---|---|---|---|---|---|---|
| 简育钙积土 | 10.00 | 81.00 | 10.00 | 9.00 | 0.40 | 9.00 |
| 石灰性冲积土 | 10.00 | 79.00 | 15.00 | 6.00 | 0.41 | 9.10 |
| 过渡性砂性土 | 2.00 | 89.00 | 6.00 | 5.00 | 0.50 | 0.00 |
| 钙积潜育土 | 4.00 | 41.00 | 40.00 | 19.00 | 1.30 | 1.00 |
| 粘化石膏土 | 2.00 | 39.00 | 29.00 | 32.00 | 0.47 | 1.00 |
| 人为堆积土 | 10.00 | 29.00 | 50.00 | 21.00 | 1.12 | 9.30 |
注:砾石含量为体积百分率,沙含量、淤泥含量、黏土含量、有机碳含量及石灰含量为重量百分率。
图1

图1
贺兰山东麓葡萄种植区及其表层土壤类型分布
Fig.1
The distribution of grape planting areas and its surface soil types at the eastern foot of the Helan Mountain
1.2 资料
1.3 方法
式中:T(℃)为土壤温度;t(s)为时间;z(cm)为土壤深度;k(m-2·s-1)为土壤的热扩散率;
式中:α为待定系数。令
2 结果与分析
2.1 不同深度冬季土壤温度日变化
图2为2021/2022年冬季贺兰山东麓10个葡萄园不同深度日平均土壤温度的变化。可以看出,贺兰山东麓酿酒葡萄园区冬季不同深度日平均土壤温度随着时间变化表现的规律基本相近,整体呈先降低后升高的变化趋势,随着土壤深度增加,土壤温度变化幅度减小,且变化趋势滞后于浅层土壤。2022年2月10日前,因空气温度较低,土壤热量从深层向表层传递,土壤温度处于整体下降趋势,表层土壤温度低,各层土壤温度梯度较大;2月10日后,随着气温逐渐升高,土壤中热量传递逐步变为从地表向下传递,各层土壤温度整体呈上升趋势,地表温度升温较快,随着时间推移,各层地温梯度逐渐变小,曲线出现交叉。受2021年12月25日和2022年2月5日前后强降温影响,各葡萄园10 cm和20 cm土壤温度表现出明显下降趋势,土壤温度保持在0.0 ℃以下,30 cm和40 cm土壤温度变化相对较小。冬季,留世酒庄、御马酒庄、东方裕兴酒庄3个葡萄园土壤温度下降幅度较大,10 cm土壤温度达-5.0 ℃左右,其他园区下降至-3.0~-1.5 ℃,各葡萄园30 cm土壤温度在-3.0 ℃以上范围波动,40 cm地温基本维持在-2.0 ℃以上。
图2

图2
2021/2022年冬季贺兰山东麓10个葡萄园不同深度日平均土壤温度的变化
Fig.2
Variation of daily mean soil temperature at different depths in 10 vineyards at the eastern foot of the Helan Mountain in winter of 2021/2022
2.2 不同深度土壤温度回归分析
对2022年2月3—5日不同葡萄园区10、20、30、40 cm小时平均地温应用最小二乘法拟合得到正弦曲线参量(表2)。分土层来看,10 cm土层中留世酒庄、御马酒庄的平均土壤温度较低,为-4.86~-4.04 ℃,观兰酒庄、西鸽酒庄平均土壤温度较高,为-1.90~-1.18 ℃,其他酒庄平均土壤温度比较接近。温度振幅(
表2 2022年2月3—5日10个葡萄园不同深度小时平均土壤温度最小二乘法拟合的物理参量
Tab.2
| 酒庄 | 时间 | R102 | R202 | R302 | R402 | ||||||
|---|---|---|---|---|---|---|---|---|---|---|---|
| 贺东庄园 | 3日 | -2.27 | -1.28 | -0.39 | 0.10 | 1.17 | 5.42 | 0.976 4 | 0.865 5 | 0.543 5 | -inf |
| 4日 | -2.20 | -1.28 | -0.38 | 0.11 | 1.43 | 5.70 | 0.963 7 | 0.880 7 | 0.272 7 | 0.782 3 | |
| 5日 | -2.28 | -1.33 | -0.39 | 0.12 | 1.21 | 5.45 | 0.971 3 | 0.877 4 | 0.543 5 | -inf | |
| 观兰酒庄 | 3日 | -1.18 | -0.70 | 0.30 | 0.11 | -1.67 | -0.85 | 0.954 9 | 0.957 8 | 0.464 6 | 0.236 7 |
| 4日 | -1.35 | -0.82 | -0.36 | 0.18 | 1.35 | 5.24 | 0.953 5 | 0.932 3 | 0.684 1 | 0.742 1 | |
| 5日 | -1.36 | -0.88 | -0.30 | -0.14 | 1.27 | 1.94 | 0.964 4 | 0.921 6 | 0.687 8 | 0.815 2 | |
| 留世酒庄 | 3日 | -4.06 | -3.33 | -1.75 | -0.67 | 0.21 | 1.00 | 0.953 0 | 0.968 9 | 0.935 8 | 0.875 0 |
| 4日 | -4.40 | -3.47 | -2.06 | -0.81 | 0.38 | 1.27 | 0.923 3 | 0.968 5 | 0.979 6 | 0.922 9 | |
| 5日 | -4.04 | -3.35 | -1.86 | -0.69 | 0.16 | 0.91 | 0.955 9 | 0.966 0 | 0.951 7 | 0.9110 | |
| 美御酒庄 | 3日 | -2.85 | -1.91 | -0.65 | -0.24 | 0.71 | 1.41 | 0.954 2 | 0.968 1 | 0.608 6 | 0.782 3 |
| 4日 | -2.96 | -2.01 | -0.65 | 0.25 | 0.77 | 4.92 | 0.953 3 | 0.957 3 | 0.782 3 | 0.324 2 | |
| 5日 | -2.95 | -2.09 | -0.64 | -0.22 | 0.63 | 1.64 | 0.953 1 | 0.973 2 | 0.817 0 | 0.620 9 | |
| 轩尼诗 酒庄 | 3日 | -2.25 | -1.59 | -0.50 | 0.21 | 0.54 | 4.54 | 0.947 4 | 0.964 9 | 0.742 1 | 0.457 9 |
| 4日 | -2.44 | -1.72 | -0.69 | -0.28 | 0.64 | 1.46 | 0.938 5 | 0.971 8 | 0.803 7 | 0.806 9 | |
| 5日 | -2.26 | -1.68 | -0.54 | 0.22 | 0.47 | 4.40 | 0.946 1 | 0.936 2 | 0.801 3 | -inf | |
| 圣易路丁 酒庄 | 3日 | -2.55 | -1.36 | -0.65 | 0.16 | 0.94 | -0.86 | 0.965 3 | 0.950 2 | 0.843 3 | 0.366 8 |
| 4日 | -2.82 | -1.52 | -1.04 | 0.20 | 0.71 | -1.26 | 0.952 7 | 0.962 2 | 0.843 1 | 0.627 7 | |
| 5日 | -2.65 | -1.54 | -0.66 | 0.15 | 0.84 | -1.05 | 0.978 3 | 0.945 4 | 0.707 7 | -inf | |
| 西鸽酒庄 | 3日 | -1.66 | -1.10 | 0.29 | 0.11 | 4.64 | 5.37 | 0.934 2 | 0.947 1 | 0.782 3 | 0.806 9 |
| 4日 | -1.73 | -1.16 | 0.33 | 0.16 | -1.20 | -0.55 | 0.946 5 | 0.946 4 | 0.782 3 | 0.272 7 | |
| 5日 | -1.90 | -1.31 | -0.27 | 0.11 | 1.64 | 5.50 | 0.952 7 | 0.940 3 | 0.815 2 | 0.178 6 | |
| 御马酒庄 | 3日 | -4.25 | -3.44 | -1.82 | -0.64 | 0.15 | 0.95 | 0.917 1 | 0.938 8 | 0.875 1 | 0.622 3 |
| 4日 | -4.86 | -3.67 | -1.99 | -0.75 | 0.30 | 1.36 | 0.895 0 | 0.957 2 | 0.975 4 | 0.918 9 | |
| 5日 | -4.25 | -3.52 | -1.76 | -0.61 | 0.10 | 0.87 | 0.929 7 | 0.948 6 | 0.890 5 | 0.806 9 | |
| 红粉佳荣 酒庄 | 3日 | -2.74 | -1.80 | -0.60 | -0.22 | 0.79 | 1.40 | 0.947 8 | 0.964 5 | 0.850 5 | 0.782 3 |
| 4日 | -2.93 | -1.94 | -0.61 | 0.24 | 0.93 | 4.78 | 0.931 8 | 0.946 4 | 0.782 8 | 0.742 1 | |
| 5日 | -2.91 | -2.03 | -0.61 | -0.22 | 0.56 | 1.08 | 0.951 9 | 0.964 2 | 0.875 0 | 0.457 9 | |
| 东方裕兴 酒庄 | 3日 | -3.55 | -2.56 | -1.23 | -0.49 | 0.46 | 1.32 | 0.901 1 | 0.955 3 | 0.942 3 | 0.880 6 |
| 4日 | -4.33 | -3.02 | -1.60 | -0.71 | 0.58 | 1.53 | 0.942 6 | 0.970 5 | 0.958 1 | 0.842 6 | |
| 5日 | -3.9 | -2.98 | -1.36 | -0.53 | 0.30 | 5.98 | 0.962 0 | 0.978 8 | 0.967 6 | 0.878 0 |
注:
图3为2022年2月3—5日不同葡萄园区10、20、30、40 cm土层实际土壤温度与最小二乘法拟合值的变化曲线。可以看出,各葡萄园区10 cm和20 cm土壤温度随时间呈周期性正弦曲线波动,且20 cm明显滞后于10 cm,应用最小二乘法拟合效果均较好,实测值与拟合曲线相当吻合。30 cm和40 cm土壤温度实测值周期性正弦曲线波动不明显,尤其40 cm土壤温度几乎呈直线台阶式变化,应用最小二乘法无法较好拟合。说明10、20 cm土壤温度变化响应快、波动剧烈,拟合的土壤温度振幅、土壤温度初相能更准确反映土壤热扩散率,且深冬季节表层土壤水分相态均为固态,土壤热量交换稳定,受水分运动产生的热对流效应很弱,所以下文选用T10、T20资料进行土壤热扩散率的计算更准确。
图3
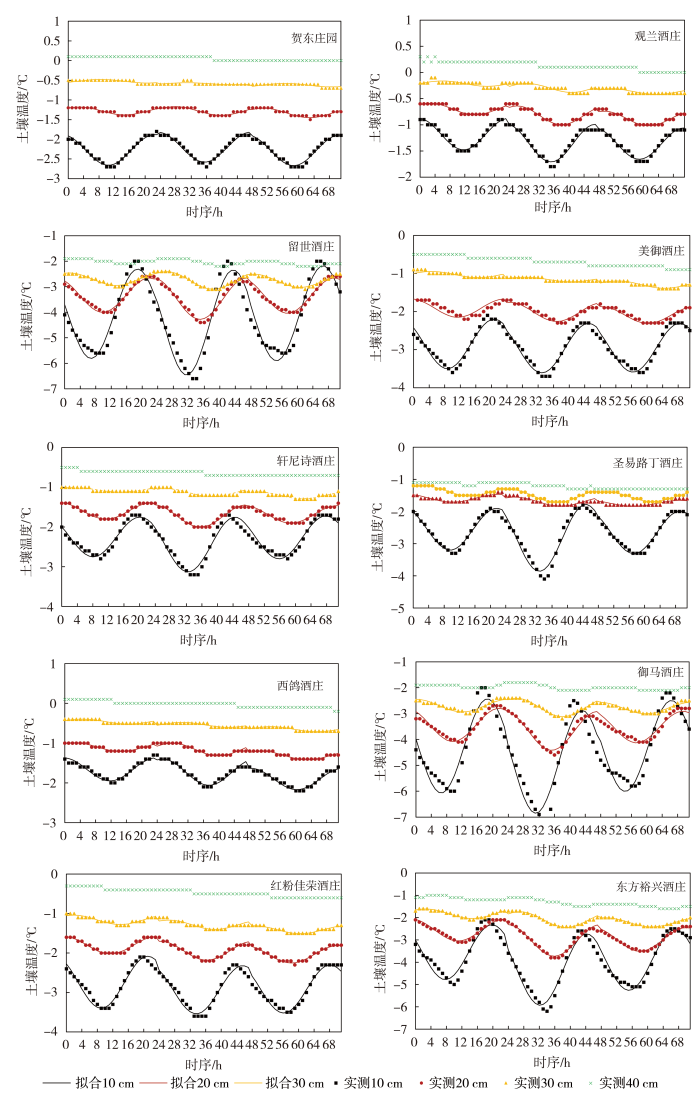
图3
2022年2月3—5日贺兰山东麓10个葡萄园不同深度土壤温度观测值及其拟合曲线
Fig.3
The observed soil temperature and its fitting curves at different depths in 10 vineyards at the eastern foot of the Helan Mountain from 3 to 5 February 2022
2.3 土壤热扩散率的对比分析
将拟合得到的10 cm土壤温度振幅、土壤温度初相以及20 cm土壤平均温度代入公式(3),用热传导方法拟合得到2022年2月3—5日10~20 cm的土壤热扩散率k及其回归校正系数R2(表3)。可以看出热传导方法能很好地拟合冬季贺兰山东麓葡萄园的土壤热扩散率,不同葡萄园区的热扩散率存在不同程度差异,同一园区不同时间的热扩散率也表现出一定差异,热扩散率的变化范围为4.18×10⁻⁶~18.73×10⁻⁶ m2·s-1,贺兰山东麓酿酒葡萄产区冬季的土壤热扩散率整体较大。
表3
2022年2月3—5日贺兰山东麓10个葡萄园土壤热扩散率
Tab.3
| 酒庄名称 | 时间 | k/(10-6 m2·s-1) | R2 | 酒庄名称 | 时间 | k/(10-6 m2·s-1) | R2 |
|---|---|---|---|---|---|---|---|
| 贺东庄园 | 3日 | 5.67 | 0.834 3 | 圣易路丁酒庄 | 3日 | 4.73 | 0.951 4 |
| 4日 | 6.09 | 0.873 5 | 4日 | 4.18 | 0.823 1 | ||
| 5日 | 6.56 | 0.871 5 | 5日 | 4.69 | 0.922 6 | ||
| 观兰酒庄 | 3日 | 10.84 | 0.907 1 | 西鸽酒庄 | 3日 | 12.00 | 0.888 2 |
| 4日 | 16.83 | 0.931 0 | 4日 | 18.73 | 0.914 2 | ||
| 5日 | 17.16 | 0.918 6 | 5日 | 13.20 | 0.893 5 | ||
| 留世酒庄 | 3日 | 11.42 | 0.954 4 | 御马酒庄 | 3日 | 10.12 | 0.907 3 |
| 4日 | 10.45 | 0.967 7 | 4日 | 8.44 | 0.953 1 | ||
| 5日 | 11.36 | 0.935 7 | 5日 | 10.32 | 0.865 5 | ||
| 美御酒庄 | 3日 | 8.42 | 0.968 1 | 红粉佳荣酒庄 | 3日 | 13.14 | 0.886 8 |
| 4日 | 9.01 | 0.955 7 | 4日 | 12.77 | 0.922 7 | ||
| 5日 | 8.13 | 0.971 2 | 5日 | 13.79 | 0.830 4 | ||
| 轩尼诗酒庄 | 3日 | 12.00 | 0.964 8 | 东方裕兴酒庄 | 3日 | 11.02 | 0.953 7 |
| 4日 | 11.77 | 0.968 7 | 4日 | 11.14 | 0.962 9 | ||
| 5日 | 11.91 | 0.927 5 | 5日 | 11.97 | 0.958 4 |
各园区比较来看,观兰酒庄、西鸽酒庄、红粉佳荣酒庄的土壤热扩散率较大,平均k值分别为14.94×10⁻⁶、14.64×10⁻⁶、13.23×10⁻⁶ m2·s-1,轩尼诗酒庄、东方裕兴酒庄、留世酒庄的土壤热扩散率次之,平均k值分别为11.89×10⁻⁶、11.38×10⁻⁶、11.08×10⁻⁶m2·s-1,御马酒庄和美御酒庄的平均k值分别为9.63×10⁻⁶、8.52×10⁻⁶ m2·s-1,产区北部贺东庄园和永宁县偏东的圣易路丁酒庄土壤热扩散率较小,平均k值分别为6.11×10⁻⁶、4.53×10⁻⁶ m2·s-1。根据土壤热扩散率的影响因子,园区土壤热扩散率的差异主要与各园区的土壤质地和土壤含水量有关,土壤中矿物质、砂石含量的增加会提高土壤热扩散率,在一定程度内,土壤热扩散率随着土壤含水量的增加而增大(王卫华等,2020)。贺东庄园土壤类型为人为堆积土,沙含量在所有酒庄土壤类型中最低,圣易路丁酒庄为钙积潜育土,砾石含量和沙含量整体较小,所以二者土壤热扩散率最小;观兰酒庄、西鸽酒庄、留世酒庄、东方裕兴酒庄土壤类型为简育钙积土,砾石含量和沙含量都较高,土壤热扩散率较大;红粉佳荣酒庄的土壤类型为石灰性冲积土,砾石含量和沙含量接近简育钙积土,所以土壤热扩散率也较大;御马酒庄、轩尼诗酒庄位于简育钙积土、人为堆积土、石灰性冲积土、钙积潜育土等多种土壤类型交叉过渡地段,混合土壤降低了砾石和沙含量,热扩散率相对较小;美御酒庄土壤类型也为简育钙积土,砾石与沙含量高,但可能与人为处理葡萄园砾石及表层土壤或者冬灌时的灌溉量有关,热扩散率较其他相同土壤类型的葡萄园低。
3 讨论与结论
3.1 讨论
(1)冬季贺兰山东麓酿酒葡萄园土壤温度呈先降后升趋势,为负垂直温度梯度分布,即土壤温度随深度增加而升高,深层地温较稳定,出现大幅降温天气才会出现波动,这与王静等(2022)对贺兰山东麓地温的研究结果基本一致,主要原因是冬季地表接收的太阳辐射小于地表长波辐射,地面温度下降,热量从深层土壤向表层传导。
(3)本文对贺兰山东麓不同葡萄园冬季土壤热扩散率与土壤类型的研究,所得结果在一定范围能较好地反映土壤热特性,但提取分析的土壤类型数据来自2009年,贺兰山东麓部分葡萄园在长期生产中对土壤类型进行了人为改良,所以要准确掌握整个产区更详尽准确的土壤热特性分布情况以及整个葡萄生长季的热特性,还有待进一步深入研究。
3.2 结论
贺兰山东麓因独特的风土资源,成为最适合种植酿酒葡萄和生产高端葡萄酒的黄金地带之一,由于贺兰山东麓从北向南、由西到东存在土壤类型差异,对葡萄生长发育及越冬有重要影响。为此,利用贺兰山东麓10个葡萄庄园的地温资料,较为系统地分析了冬季贺兰山东麓酿酒葡萄产区土壤的热特性,得出以下结论:
(1)冬季土壤温度先下降后上升,土壤温度随着土层深度增加而上升,深层土壤波动幅度小于表层土壤,且变化滞后于表层土壤。留世酒庄、御马酒庄、东方裕兴酒庄3个葡萄园冬季的日平均土壤温度较低,10 cm土壤温度在-5.0 ℃左右。
(2)通过热传导方法拟合冬季贺兰山东麓10、20 cm土壤温度,拟合效果较好,回归校正系数平均值分别达0.947 2、0.947 5,20 cm地温拟合效果最佳。
(3)贺兰山东麓葡萄园冬季土壤热扩散率整体较高。其中,位于产区北端大武口的贺东庄园和永宁县偏东的圣易路丁酒庄土壤热扩散率较小,平均k值分别为6.11×10⁻⁶、4.53×10⁻⁶ m2·s-1,葡萄越冬冻害风险较其他酒庄低;靠近贺兰山的观兰酒庄、西鸽酒庄、留世酒庄、轩尼诗酒庄和红寺堡的东方裕兴酒庄、红粉佳荣酒庄土壤热扩散率较大,平均k值为11.08×10⁻⁶~14.94×10⁻⁶ m2·s-1,这些酒庄葡萄园土壤热交换快,在葡萄越冬管理中,要增加葡萄埋土厚度,有条件的酒庄可以多掺壤土来完成埋土作业,减小上层土壤热扩散率从而降低土壤热量散失能力,降低葡萄越冬冻害的风险;御马酒庄和美御酒庄的平均k值分别为9.63×10⁻⁶、8.52×10⁻⁶ m2·s-1,土壤热扩散率相对较小,生产上适当增加葡萄埋土厚度。
参考文献
贺兰山东麓葡萄园结露温度与结露时间变化特征
[J].
利用银川农气站2003—2020年葡萄生育期4—10月逐小时气象观测资料和美域酒庄2019—2020年小气候监测站逐小时气象观测数据以及同一区域立兰葡萄园2019年6月逐10 min叶面温度监测数据,以美域酒庄葡萄园为例,分析贺兰山东麓葡萄园葡萄生育期结露温度和结露日数、时长及结露时间变化规律及其影响因素。结果表明:贺兰山东麓葡萄园葡萄生育期的结露温度呈“单峰型”月际分布,7月达到峰值,10月最低。近18 a来,葡萄生育期结露日数(时长)大致呈逐月递增趋势,9月最多(长),4月最少(短),且存在明显的年际变化;全天均可出现结露现象,但结露主要分布在17:00至次日01:00,且随月份结露时段范围逐渐扩大,结露时段9月最宽,4月最窄。露点温度与最低气温、降水量呈显著正相关,结露通常出现在降水天气前后及最低气温低的情况下。病虫害与结露密切相关,因此在结露较多的月份需注意干燥通风。
宁夏贺兰山东麓葡萄园小气候特征
[J].利用贺兰山东麓葡萄产区2019年8套小气候站和银川国家基准站(简称“银川站”)气象资料,对比分析银川站与葡萄园小气候代表站美域酒庄气候差异,以及美域酒庄气象要素垂直变化、同一气候区4个酒庄和5个子产区酒庄小气候差异。结果表明:(1)美域酒庄与同区域银川站各气象要素均存在差异。(2)在典型晴天10 cm地温日波动最大,40 cm最平稳,日平均地温秋、冬季典型晴天表现为10 cm<20 cm<40 cm,春、夏季典型晴天表现为10 cm>20 cm>40 cm。月、生长季和年平均50、150 cm两高度空气相对湿度差异不明显。(3)同一气候区,4个酒庄小气候受地势、海拔和土壤类型影响较大。砾石含量越高,气温越高;海拔越高,相对湿度越小、风速越大;处于山前海拔较低的留世酒庄生长季降水最多,轩尼诗酒庄降水最少。(4)5个子产区酒庄由南至北降水、空气相对湿度和光合有效辐射逐渐减小,气温逐渐升高。
质地对土壤热扩散率的影响
[J].土壤热性质的研究是分析地表能量平衡的重要途径之一,土壤热扩散率是表征土壤热性质的重要参数。根据非稳态一维热传导方程的差分解计算了不同质地土壤的热扩散率。结果表明,风干土热扩散率小于1.4×10⁻³ cm2·s-1,并随着时间的推移逐渐减小;土壤质地越轻土墒条件越好热量传输速度越慢。
耕作方式对旱作农田土壤水热特性及夏玉米产量的影响
[J].
Probabilistic estimation of depth-resolved profiles of soil thermal diffusivity from temperature time series
[J].. Improving the quantification of soil thermal and physical properties is key to achieving a better understanding and prediction of soil hydro-biogeochemical processes and their responses to changes in atmospheric forcing. Obtaining such information at numerous locations and/or over time with conventional soil sampling is challenging. The increasing availability of low-cost, vertically resolved temperature sensor arrays offers promise for improving the estimation of soil thermal properties from temperature time series, and the possible indirect estimation of physical properties. Still, the reliability and limitations of such an approach need to be assessed. In the present study, we develop a parameter estimation approach based on a combination of thermal modeling, sliding time windows, Bayesian inference, and Markov chain Monte Carlo simulation to estimate thermal diffusivity and its uncertainty over time, at numerous locations and at an unprecedented vertical spatial resolution (i.e., down to 5 to 10 cm vertical resolution) from soil temperature time series. We provide the necessary framework to assess under which environmental conditions (soil temperature gradient, fluctuations, and trend), temperature sensor characteristics (bias and level of noise), and deployment geometries (sensor number and position) soil thermal diffusivity can be reliably inferred. We validate the method with synthetic experiments and field studies. The synthetic experiments show that in the presence of median diurnal fluctuations ≥ 1.5 ∘C at 5 cm below the ground surface, temperature gradients > 2 ∘C m−1, and a sliding time window of at least 4 d the proposed method provides reliable depth-resolved thermal diffusivity estimates with percentage errors ≤ 10 % and posterior relative standard deviations ≤ 5 % up to 1 m depth. Reliable thermal diffusivity under such environmental conditions also requires temperature sensors to be spaced precisely (with accuracy to a few millimeters), with a level of noise ≤ 0.02 ∘C, and with a bias defined by a standard deviation ≤ 0.01 ∘C. Finally, the application of the developed approach to field data indicates significant repeatability in results and similarity with independent measurements, as well as promise in using a sliding time window to estimate temporal changes in soil thermal diffusivity, as needed to potentially capture changes in bulk density or water content.\n
Spatial variability of soil thermal properties and their relationships with physical properties at field scale
[J].
Wine analysis and authenticity using H-1-NMR metabolomics data: application to chinese wines
[J].
Effects of water stress on the sugar accumulation and organic acid changes in Cabernet Sauvignon grape berries
[J].
Effects of cover crops on soil thermal properties of a corn cropping system
[J].

