

引言
政府间气候变化专门委员会第六次评估报告指出,全球气候系统变暖毋庸置疑,1880—2012年全球地表平均温度升高0.85 ℃(0.65~1.06 ℃),观测的许多变化在几十年乃至上千年里都是前所未有的,并导致大气和海洋变暖、积雪和冰川减少、海平面上升及温室气体浓度增加(IPCC, 2019; IPCC, 2021)。研究表明,气候变化引起的辐射强迫及相关海温模式演化等引起大气环流发生变化(Chadwick et al., 2016),进而导致对流层低层水汽含量增加和垂直运动增强,加之向下辐射通量增加,全球平均降水量和蒸散量增加,从而使大范围陆地水循环发生变化(Zhao et al., 2017; Zhang et al., 2015)。集合模式模拟表明,在未来气候变化情景预估RCP(Representative Concentration Pathways)8.5路径下,到本世纪末,年平均陆地降水和蒸散将继续增加,土壤继续变干,积雪和冻土融化,年平均径流量增加,地表水储量减少,陆地水循环持续加速(Cheng et al., 2019)。由此可见,蒸散对气候变化的响应极为敏感。然而,太阳辐射、湿度、空气温度、风速、土壤湿度及植被覆盖等均会引起蒸散变化(张亚春等,2021;Fisher et al., 2017),且全球不同区域、流域的影响因素和蒸散响应程度并不一致,因而对气候变化背景下陆面蒸散的变化趋势研究仍存在不确定性(Zhang et al., 2015; Jung et al., 2010; Madeleine et al., 2021),合理评估蒸散变化趋势一直是研究的热点问题。
黄河流域是我国重要的生态屏障,也是我国重要经济带,同时是国家脱贫攻坚、区域协调发展与“一带一路”倡议等重要区域,在我国经济社会发展和生态安全方面具有十分重要的地位(郑子彦等,2020)。黄河流经地区大部分属于干旱半干旱区,其生态环境脆弱,是气候变化敏感区,也是陆-气相互作用研究的热点区域(Koster et al., 2004;杨扬等,2021)。气候变化导致黄河流域出现冰川退缩、冻土融化、草地退化、水资源短缺等生态问题,对流域生态安全产生显著影响(马守存等,2018;张镭等,2020;肖风劲等,2021)。研究表明,1950年代以来黄河流域平均气温总体呈上升趋势,1990年代以后升温明显加快,2000年以后年平均气温比1950年代普遍升高1.00 ℃以上(徐宗学和隋彩虹,2005;杨特群等,2009)。黄河流域降水分布不均匀,总体由西北向东南递增,其中黄河源区和河套地区过去60 a的年降水量呈增加趋势,且未来将继续增加,而黄河下游地区过去60 a及未来降水量都呈减少趋势(王澄海等,2022)。在气候变化背景下,黄河流域温度和降水的显著变化势必导致蒸散的变化。由于缺乏时空连续的蒸散观测资料,已有研究从遥感反演、同化产品和数值模拟等多方面对黄河流域蒸散变化进行了分析:遥感反演模型计算分析发现黄河上游蒸散增加(Xu et al., 2018; Yuan et al., 2022);遥感模型和多套再分析资料研究表明黄河中下游蒸散减少(Feng et al., 2018; Yang et al., 2019);水分平衡模型计算指出黄河上游蒸散增加,中下游减少(Gao et al., 2007);而遥感产品和诊断模型分析则发现黄河中下游蒸散增加(Li et al., 2020)。此外,Lv等(2019)利用WRF(Weather Research and Forecasting Model)模式模拟得到2006—2010年黄河流域及其周边蒸散,指出该流域蒸散量增加223.9 mm;童瑞等(2015)利用VIC(Variable Infiltration Capacity)陆面模式模拟了1961—2012年黄河流域水文过程,获得日尺度蒸散,发现蒸散呈减少趋势。上述研究由于其模型和方法的差异,获得结论并不一致,这主要是由于缺乏高精度、高时空分辨率的蒸散观测数据所致。
2019年,欧洲中期天气预报中心(European Centre for Medium-Range Weather Forecasts,ECMWF)发布了最新的全球第五代再分析资料ERA5,包含高时空分辨率的气象要素、陆面参数等资料,为研究黄河流域蒸散变化趋势提供重要的数据支撑。鉴于此,本文利用ERA5-Land近42 a蒸散资料,精细化评估黄河流域蒸散时空变化特征,以期加深黄河流域蒸散变化的认识,为黄河流域水资源合理利用、生态保护和高质量发展提供科学依据。
1 资料和方法
1.1 研究区域
黄河流域(95°E—120°E,32°N—42°N)东西长约1 900 km,南北宽约1 100 km,流域面积7.95×10⁵ km2(http://www.yrcc.gov.cn/hhyl/hhgk/hd/lyfw/201108/t20110814_103452.html),流域内气象要素空间分布差异较大,下垫面类型复杂多变。为探究黄河流域陆面蒸散变化特征,本文依据王澄海等(2022)方法,将黄河流域划分为黄河源区(96°E—104°E,33°N—37°N)、河套地区(104°E—112°E,34.5°N—41°N)及黄河下游地区(112°E—119°E,34°N—38°N)(图1)分别进行分析。其中,黄河源区位于青藏高原东北部半干旱高寒区,海拔高、支流多、季风影响较小,是黄河径流量主要供给区,年平均降水量为400~800 mm;中部河套地区横跨河套平原、鄂尔多斯高原、毛乌素沙地和黄土高原,属于干旱半干旱区,年平均降水量较少(100~500 mm)且空间差异大;黄河下游位于半湿润区,流域内山西、河南、山东3段受季风影响显著,降水相对较多,达600~1 000 mm。图1使用的降水资料是基于中国气象局提供的2 400余个地面台站观测资料采用薄板样条法插值建立的高分辨率格点数据集(CN05.1)(吴佳和高杰,2013),时间长度为1961—2018年,空间分辨率为0.25°×0.25°。文中附图涉及的地图均基于国家测绘地理信息局标准地图服务网站下载的审图号为GS(2016)2556号的标准地图制作,底图无修改。
图1
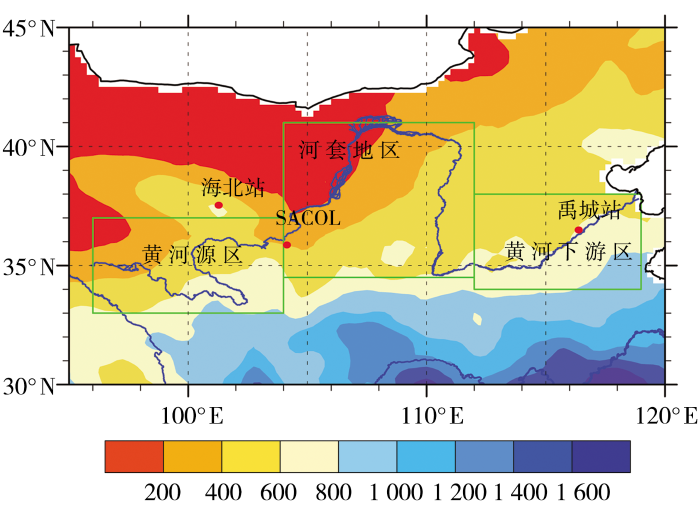
图1
黄河流域区域划分(绿色框)及1961—2018年平均年降水量空间分布(填色区,单位:mm)
(蓝色实线代表黄河。下同)
Fig.1
The regional division (green boxs) of the Yellow River Basin and spatial distribution of average annual precipitation (color filled areas, Unit: mm) from 1961 to 2018
(The blue solid line represents the Yellow River. the same as below)
1.2 ERA5-Land资料
欧洲中期天气预报中心(ECMWF)最新发布的ERA5资料是第五代全球气候和天气再分析数据,在许多方面较先前版本有明显改善(Hersbach and Coauthors, 2020)。ERA5是ECMWF首次在土壤湿度再分析资料中集成了遥感观测数据,提高了陆面土壤湿度的精度(Hersbach and Coauthors, 2020; Qiao et al., 2021)。已有大量研究通过与观测及其他再分析资料对比,全面评估ERA5资料中的辐射通量、土壤湿度及地表温度等物量,发现ERA5资料均优于ERA-Interim资料(Martens et al., 2020; Wang et al., 2019),为陆-气相互作用相关研究提供更精确、更高时空分辨率的数据基础(Hersbach and Coauthors, 2020; Wu et al., 2021)。与ERA5相比,ERA5-Land未与ECMWF的综合预报系统(Integrated Forecasting System, IFS)耦合,因此更新速度快,无需数据同化。ERA5-Land提供了全球1950年至今的地表能量通量和地表289 cm以上土壤温度、湿度等数据,其时间分辨率最小为1 h,空间分辨率为0.1°×0.1°。本文选取ERA5-Land资料中1980—2021年逐月潜热通量资料,开展黄河流域蒸散变化研究。文中春季为3—5月,夏季为6—8月,秋季为9—11月,冬季为12月至次年2月,季节蒸散由各月蒸散求和得到。
1.3 站点资料
为验证ERA5-Land蒸散资料在黄河流域的适用性,分别在黄河源区、河套地区及黄河下游地区各选择一个代表性站点观测数据进行验证。3个站点(图1)介绍如下:
(1)海北站(101.28°E,37.62°N)位于青海省海北州,处于青藏高原东北隅,属于高原大陆性气候,无明显四季之分,仅冷暖季之别,干湿季分明,年平均降水量535.2 mm,年平均气温-1.2 ℃,最热月(7月)平均气温为10.4 ℃,最冷月(1月)平均气温为-14.4 ℃,下垫面主要为高寒草地,可反映黄河源区的气候特征及典型地表类型;
(2)兰州大学半干旱气候与环境观测站(Semi-Arid Climate and Environment Observatory of Lanzhou University,SACOL)(104.14°E,35.95°N)位于黄土高原区,地处温带半干旱气候区,年平均降水量381.8 mm,年平均气温6.7 ℃,下垫面为天然荒漠草地,可代表河套地区气候特征及典型下垫面类型;
(3)禹城站(116.38°E,36.58°N)位于山东省禹城市西南部,属于暖温带半湿润季风气候,年平均降水量582.0 mm,年平均气温13.1 ℃,下垫面主要为农田,种植冬小麦及夏玉米,可代表黄河下游地区气候特征及典型下垫面类型。
1.4 方法
利用3个站点观测值与ERA5-Land数据之间的平均偏差(Mean Bias Error, MBE)、相关系数(R)和均方根误差(Root Mean Square Error, RMSE)定量评估ERA5-Land资料在黄河流域的适用性。使用经验正交函数(Empirical Orthogonal Function,EOF)分解方法分析黄河流域蒸散时空变化特征(魏凤英,1999)。利用功率谱分析得到蒸散的主要振荡周期。功率谱分析是以傅里叶变换为基础的频域分析方法,能够对EOF的主分量时间序列进行递进分析,根据不同频率波的方差贡献诊断出主要周期,从而确定序列隐含的显著周期(魏凤英,1999;黄珊等,2020)。趋势分析利用回归分析方法,并利用student’s-t检验趋势是否显著(魏凤英,1999)。
计算区域平均蒸散时,根据面积进行加权处理,具体公式(安琳莉等,2022)如下:
式中:F(mm)为区域平均蒸散量;ai(m2)为第i个栅格的面积;fi(mm)为第i个栅格的蒸散量。
2 结果分析
2.1 ERA5-Land在黄河流域蒸散的适用性评估
图2为海北、禹城和SACOL站ERA5-Land蒸散与观测值逐月变化及散点图。可以看出,ERA5-Land资料能够合理地反映各站点蒸散的年际变化特征,其中夏季蒸散较大、冬季较小,ERA5-Land蒸散较各站点观测值均偏低。海北站ERA5-Land蒸散与观测值的线性拟合线最接近于1:1线,相关系数达0.92;SACOL及禹城站的线性拟合线均在1:1线附近,SACOL站的相关性最好,相关系数为0.93,禹城站的相关性较弱,相关系数为0.72。定量评估表明,ERA5-Land在海北、SACOL和禹城站月蒸散与观测值的均方根误差(RMSE)分别为19.4、18.1、28.6 mm,且SACOL站的相关性最好,禹城站的相关性最差,表明ERA5-Land对黄河流域河套地区的蒸散反映更好,对禹城站的反映相对不理想。综上所述,ERA5-Land蒸散资料在黄河流域适用性较好,可用于长序列、大范围的蒸散时空分布特征研究。
图2
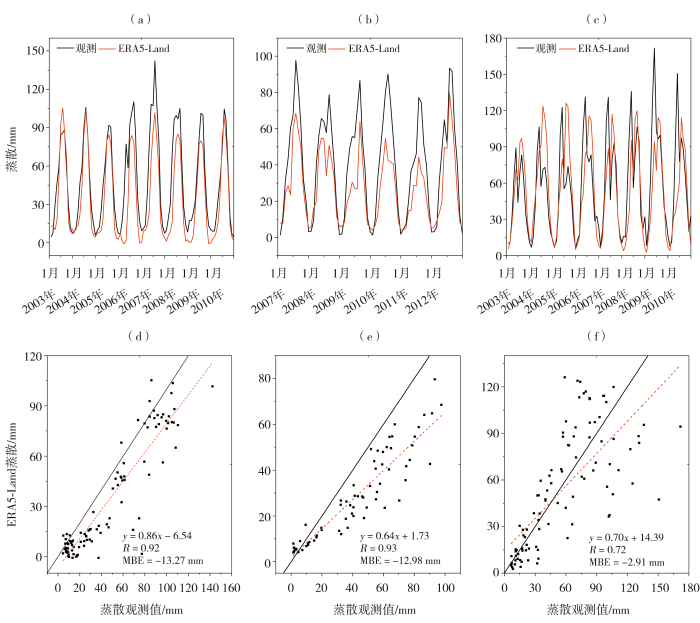
图2
2003—2010年海北(a、d)和禹城(c、f)站及2007—2012年SACOL站(b、e)ERA5-Land蒸散与观测逐月变化(a、b、c)及散点图(d、e、f)
Fig.2
Monthly variation (a, b, c) and scatter plots (d, e, f) of evapotranspiration between ERA5-Land data and the observation at Haibei (a, d) and Yucheng (c, f) station from 2003 to 2010, SACOL station (b, e) from 2007 to 2012
2.2 黄河流域蒸散空间分布
图3为1980—2021年黄河流域年和季节蒸散空间分布。总体上,黄河流域及各分区蒸散由西北向东南逐渐增大。全流域平均年蒸散为480.4 mm,黄河源区、河套地区、黄河下游地区平均年蒸散分别为426.1、441.7、661.1 mm,河套北部蒸散偏小,低值区不超过260.0 mm,南部蒸散相对较大,超过515.0 mm。黄河流域不同区域蒸散具有明显的季节变化,夏季蒸散最大,秋季次之,冬春季偏小,这与夏秋季降水较多,地表湿润,植被蒸腾作用较强密切相关。黄河流域夏季蒸散多年平均值为253.7 mm,占全年的52.8%,黄河源区、河套地区、黄河下游地区夏季蒸散分别为263.0、231.3、322.5 mm,各区域仍然是夏季占主导地位。可见,黄河流域蒸散空间分布均呈东高西低的特征,下游蒸散明显大于源区和河套地区,与该地区的降水分布(图1)较为一致。
图3

图3
1980—2021年黄河流域年和季节平均蒸散的空间分布(单位:mm)
(a)全年,(b)春季,(c)夏季,(d)秋季,(e)冬季
Fig.3
The spatial distribution of annual and seasonal mean evapotranspiration in the Yellow River Basin during 1980-2021 (Unit: mm)
(a) the whole year, (b) spring, (c) summer, (d) autumn, (e) winter
2.3 黄河流域蒸散变化趋势
图4为1980—2021年黄河流域年和不同季节蒸散年际变化及趋势分布。可以看出,近42 a来,黄河流域蒸散总体呈明显减少趋势,速率(a)为-2.37 mm·a-1,但各区域减幅不同,其中下游减少速率最大(-3.74 mm·a-1),其次是河套地区(-2.82 mm·a-1),上游变化速率相对平缓(-1.12 mm·a-1)。各季节蒸散变化趋势与年基本一致,即整个黄河流域蒸散呈减少趋势,中下游减少速率大于源区,夏季蒸散变化速率最大,全流域蒸散速率为-0.89 mm·a-1,冬季蒸散变率相对较小(图略)。从空间上看,春、夏、秋季源区大部区域蒸散为显著减少趋势,仅零星区域的蒸散呈弱增加趋势(通过95%的置信水平);冬季源区蒸散也呈减少趋势,但未通过95%的置信水平,平均速率为-0.48 mm·a-1(图略)。河套地区蒸散在夏季和冬季均呈减少趋势,夏季平均速率最大为-1.35 mm·a-1;在春季和秋季大部区域呈减少趋势,春季在河套南部、秋季在北部零星区域蒸散增加。黄河下游蒸散均呈减少趋势,夏季减少速率最大,为-1.52 mm·a-1,冬季最小(-0.40 mm·a-1)。
图4

图4
1980—2021年黄河流域不同区域年和不同季节蒸散年际变化(b、d、f、h)及变化趋势空间分布(a、c、e、g)(单位:mm·a-1)
(a、b)全年,(c、d)春季,(e、f)夏季,(g、h)秋季
(黑点区域表示通过95%的置信水平。下同)
Fig.4
Inter-annual variation (b, d, f, h) of evapotranspiration and spatial distribution of variation trend (a, c, e, g) (Unit: mm·a-1) in the whole year and different seasons in the different area of the Yellow River Basin during 1980-2021
(a, b) annual, (c, d) spring, (e, f) summer, (g, h) autumn
(The black dot areas passed the confidence level at 95%. the same as below)
2.4 黄河流域蒸散的时空变化特征
利用EOF分解详细分析黄河流域不同区域蒸散的时空变化特征。黄河源区、河套地区及黄河下游地区年蒸散的前2个模态累积方差贡献率分别为85.2%、86.7%、87.7%,且均通过North显著性检验。因此以前2个模态进行分析。图5~7分别为黄河源区、河套地区及黄河下游地区年蒸散EOF分解前2个模态的空间型、标准化时间系数及时间系数功率谱。如图5所示,黄河源区第1模态方差贡献率为79.6%,空间分布表现为全区一致型。相应标准化时间系数在2004年前多为负值,之后变为正值,表明源区蒸散自2004年呈一致减弱趋势;第2模态方差贡献率为5.6%,空间分布表现为南北偶极子型;相应标准化时间系数在2001年前基本为负值,之后多为正值,表明源区北部蒸散从2001年开始减弱,南部从2001年开始增加。
图5
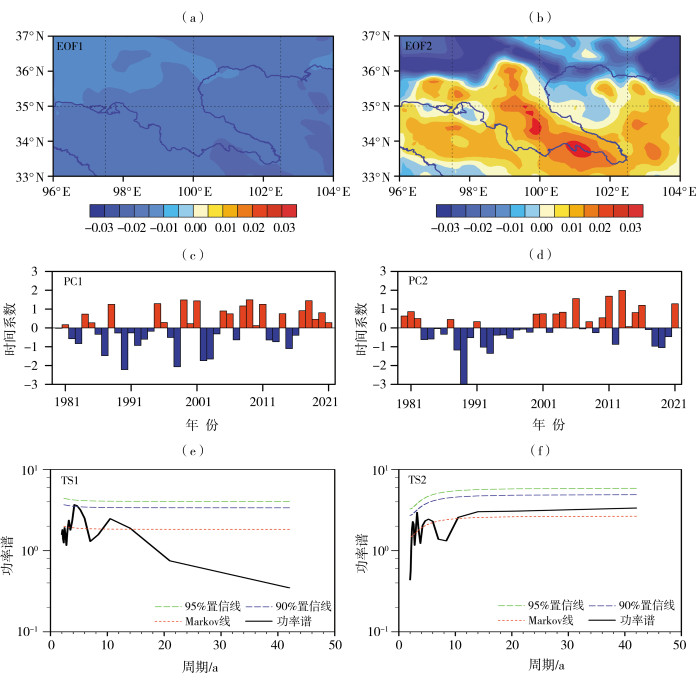
图5
1980—2021年黄河源区年蒸散EOF分解前2个模态空间型(a、b)、标准化时间系数(c、d)及其功率谱(e、f)
Fig.5
Spatial patterns (a, b), standardized time coefficients (c, d) and their power spectrum (e, f) of the first two modes of EOF analysis of annual evapotranspiration in source region of the Yellow River Basin during 1980-2021
如图6所示,河套地区年蒸散第1模态方差贡献率为79.9%,空间表现为全区一致型,相应标准化时间系数在1999年前多为正值,之后除2002—2004年、2012—2013年为正值外,其余年份均为负值,表明河套地区年蒸散第1模态在1980—1999年全区一致增强,进入21世纪后逐渐减弱;第2模态方差贡献率为6.8%,表现为西北—东南反向变化特征,由西北向东南逐渐增加,对应时间系数在1990年代初期前后由正值变为负值,表明河套西北部蒸散由减少到增多、东南部由增多到减少趋势的转变,年际变化明显。
图6
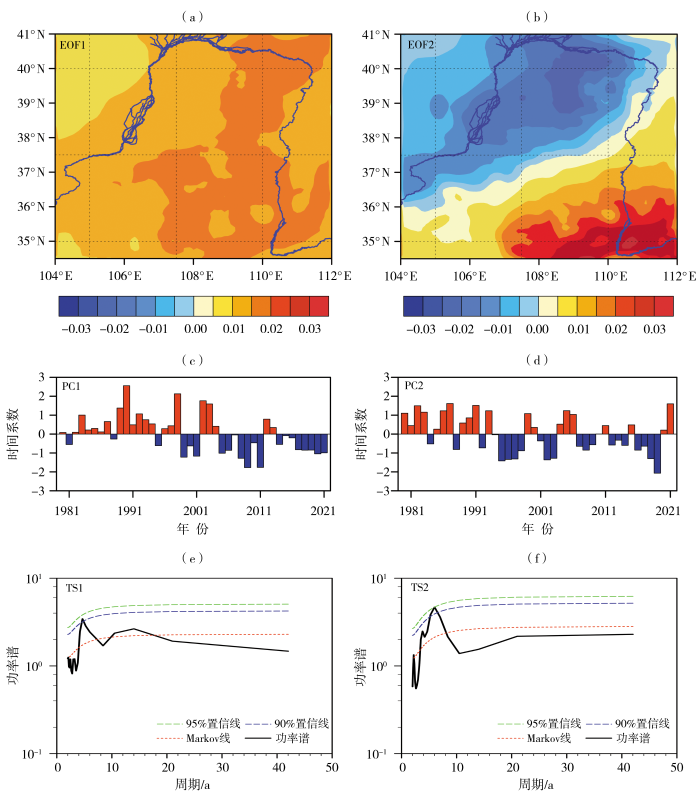
图6
1980—2021年河套地区年蒸散EOF分解前2个模态空间型(a、b)、标准化时间系数(c、d)及其功率谱(e、f)
Fig.6
Spatial patterns (a, b), standardized time coefficients (c, d) and their power spectrum (e, f) of the first two modes of EOF analysis of annual evapotranspiration in Hetao area during 1980-2021
如图7所示,黄河下游第1模态方差贡献率为83.0%,空间表现为全区一致型,相应标准化时间系数在2006年前多为正值,之后变为负值,表明下游地区蒸散自2006年由增大变为减少趋势;第2模态方差贡献率为4.7%,其空间分布西负东正,当时间系数为正时蒸散西减东增,且在黄河入海口区有很强的正变化中心。
图7
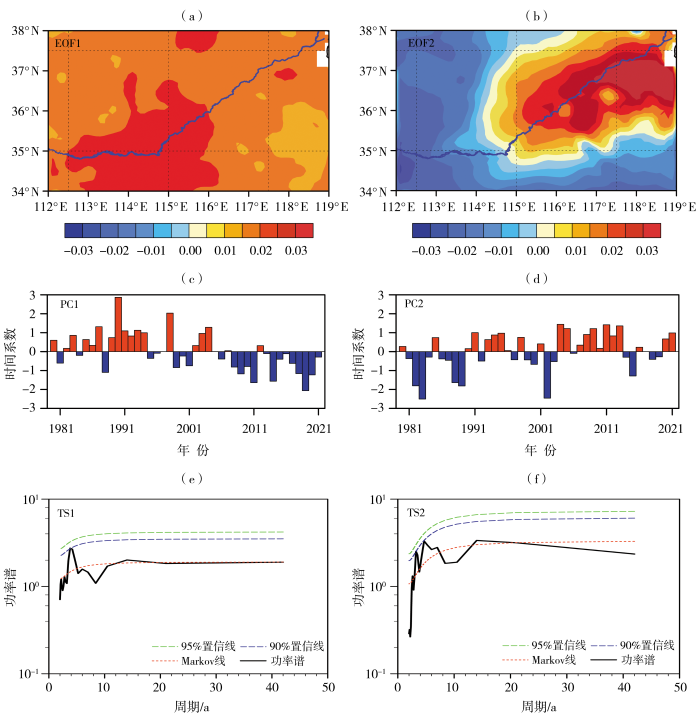
图7
1980—2021年黄河下游年蒸散EOF分解前2个模态空间型(a、b)、标准化时间系数(c、d)及其功率谱(e、f)
Fig.7
Spatial patterns (a, b), standardized time coefficients (c, d) and their power spectrum (e, f) of the first two modes of EOF analysis of annual evapotranspiration in the lower reaches of the Yellow River Basin during 1980-2021
3 讨论与结论
3.1 讨论
当前获取高时空分辨率、高精度的蒸散资料仍是一大难点,由于分析资料和时段不同,不同研究得到的黄河流域蒸散变化趋势不尽一致。为此,本文使用其他资料做进一步比较,供研究参考。分别使用Amsterdam全球陆地蒸发模型(Global Land Evaporation Amsterdam Model, GLEAM V3;空间分辨率0.25°×0.25°,数据时间1980—2018年)、全球陆面数据同化系统(Global Land Data Assimilation System, GLDAS;Noah模式生成,空间分辨率0.25°×0.25°,数据时间1981—2014年)及中国陆地实际蒸散发数据集(Eta;空间分辨率0.1°×0.1°,数据时间1982—2017年)分析黄河流域蒸散的时空变化。由图8(a)、(c)、(e)看出,基于GLEAM和GLDAS的黄河流域年蒸散呈增加趋势,下游增速最快,而源区增速相对平缓;基于Eta的上游地区年蒸散有增有减,河套西北部年蒸散增加,其余区域呈减少趋势,下游年蒸散减速最快,平均速率为-2.51 mm·a-1。由图8(b)、(d)、(f)看出,基于GLEAM的黄河流域年蒸散整体变化速率为1.50 mm·a-1,大于GLDAS(1.11 mm·a-1),其中中下游蒸散变化速率大于源区;基于GLDAS的河套地区年蒸散变化速率为0.60 mm·a-1,小于源区及下游;基于Eta的黄河流域年蒸散速率为-0.92 mm·a-1,中下游蒸散减少速率大于源区。上述蒸散的变化速率均通过95%的置信水平。基于ERA5-Land蒸散分析得出,近42 a黄河流域年蒸散为明显下降趋势,下游减速明显大于源区,与基于Eta数据的研究结果一致,与基于GLEAM和GLDAS数据的变化趋势相反。前人从遥感反演、同化产品和数值模拟等多方面对黄河流域蒸散变化特征进行研究,利用不同方法得出的结论并不相同。如利用不同数值模式模拟得出黄河流域蒸散量呈相反的变化趋势(Lv et al., 2019;童瑞等,2015);而利用不同遥感反演模型、水分平衡模型及多套再分析资料分析表明黄河上游蒸散增加,中下游蒸散减小(Gao et al., 2007; Xu et al., 2018; Yuan et al., 2022; Feng et al., 2018; Yang et al., 2019)。由此可见,由于所用资料和方法的差异导致不同蒸散资料存在不确定性,而选取的时间序列长度和空间范围不同也会导致变化趋势的差异。改进驱动资料和模式参数化方案,获得更高精度的蒸散资料,仍是蒸散变化特征研究的重中之重。
图8
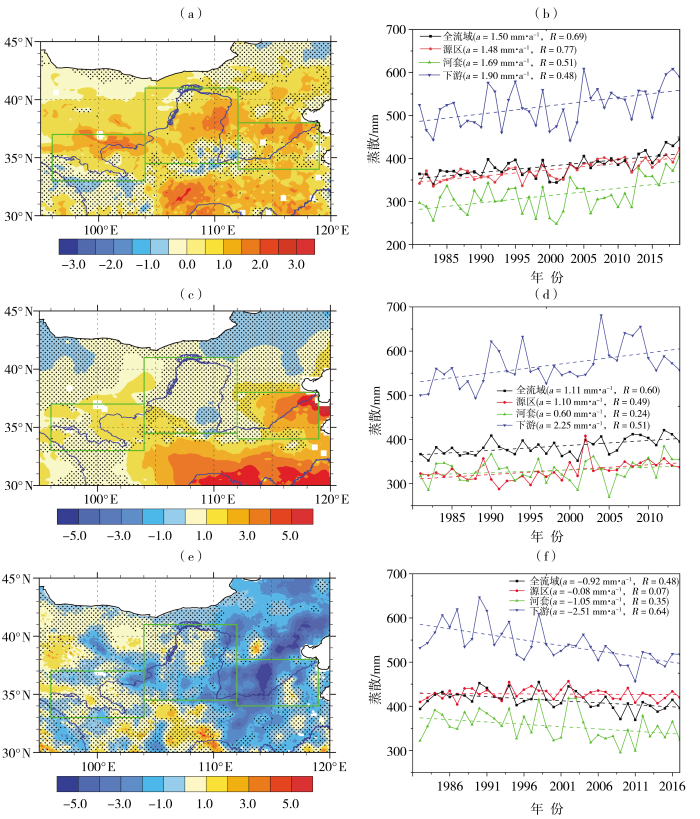
图8
基于GLEAM(a、b)、GLDAS(c、d)及Eta(e、f)资料的黄河流域不同区域蒸散年际变化(b、d、f)及变化趋势空间分布(a、c、e)(单位:mm·a-1)
Fig.8
Inter-annual variation (b, d, f) of evapotranspiration and variation trend spatial distribution (a, c, e) (Unit: mm·a-1) in different areas of the Yellow River Basin based on GLEAM (a, b)、GLDAS (c, d) and Eta (e, f) data
3.2 结论
黄河流域是我国重要生态屏障,生态环境脆弱,对气候变化敏感,也是陆-气相互作用的热点区域,探析黄河流域蒸散时空变化特征,对研究陆-气相互作用及区域水资源管理有一定指示意义。本研究基于ERA5-Land蒸散资料,研究近42 a来黄河流域蒸散变化特征,得到如下结论:
(1)ERA5-Land蒸散资料在海北、SACOL和禹城站适用性较好,能够反映黄河流域蒸散的年际变化特征,与观测值的相关性较好,平均偏差和均方根误差较小,适用于黄河流域蒸散的时空分布特征研究。
(2)黄河流域年蒸散由西北向东南逐渐增大。源区蒸散较低,多年平均为426.1 mm;河套北部年蒸散偏小,低值区不足260.0 mm,南部相对较大,超过515.0 mm;下游地区年蒸散偏大,多年平均为661.1 mm。黄河流域蒸散有明显季节变化,夏季蒸散最大,大部分区域大于200.0 mm,冬季蒸散偏小。
(3)黄河流域不同区域年蒸散存在多时间尺度的周期变化,主要有5、15 a的显著周期,年际和年代际变化信号明显。过去近42 a,黄河流域不同区域蒸散EOF分解第1模态呈全区一致分布,在2004年前后由增大变为减少趋势;第2模态呈偶极子型分布,表现空间分布的反向变化特征,相应时间系数表明蒸散空间变化增减趋势的转变。
(4)近42 a黄河流域年蒸散存在显著减少趋势,全流域的变化速率为-2.37 mm·a-1。不同区域减幅不同,下游减少速率最大,为-3.74 mm·a-1,河套地区为-2.82 mm·a-1,上游相对平缓,为-1.12 mm·a-1。夏季蒸散变化最大,河套地区速率为-1.35 mm·a-1,下游为-1.52 mm·a-1;冬季蒸散变率较小,源区减少速率最大,为-0.48 mm·a-1。
致谢
感谢中国通量观测研究网络(ChinaFLUX)提供海北和禹城站资料、兰州大学干旱气候与环境观测站提供SACOL站观测数据、欧洲中期天气预报中心(ECMWF)提供ERA5-Land再分析资料(https://cds.climate.copernicus.eu/cdsapp#!/home),以及国家青藏高原科学数据中心(http://data.tpdc.ac.cn)提供中国陆地实际蒸散发数据。
参考文献
中国北方旱区陆地水储量变化特征及其归因分析
[J].
基于重力反演与气候实验(Gravity Recovery and Climate Experiment, GRACE)卫星观测数据分析中国北方旱区近20 a的陆地水储量变化,并结合多种观测和模式数据分析其变化特征和原因。结果表明,2002—2020年中国北方旱区陆地水储量以每年17.80±1.72 Gt的净速率下降。地下水、根区土壤水和表层土壤水均不同程度减少。归因分析发现:在中国北方旱区,地表升温和人为耗水等因素造成蒸散大量增加。蒸散的负向贡献超过同期降水的正向贡献,使得区域净水储量持续减少,区域水资源压力攀升。因此,需要在中国北方旱区采取更有效的节水措施和建立全面的水资源监测系统。
1982—2013年黄河源区植被变化趋势及其对气候变化的响应
[J].基于1982—2013年GIMMS NDVI 3g数据集及黄河源区26个国家气象观测站同期气温与降水观测资料,利用趋势分析和相关分析方法,对黄河源区植被覆盖的时空变化特征及其驱动因子进行分析。结果表明:(1)黄河源区植被覆盖呈现从东南向西北递减的空间特征。近32 a来,黄河源区气温呈显著升高、降水则呈微弱增加的趋势,气候由干冷逐渐向暖湿化转变;植被覆盖呈现整体缓慢升高、局部退化的趋势,且“先增后降”的年代际变化特征明显。(2)1982—2013年,黄河源区生长季(5—9月)植被受气温和降水共同影响,植被最大NDVI与气温和降水有显著正相关关系。与降水相比,NDVI与气温的相关性更强,气温是影响黄河源区植被变化的主要气候因子,且随着海拔高度的升高影响越大。
A simple moisture advection model of specific humidity change over land in response to SST warming
[J].The robust weakening of the tropical atmospheric circulation in projections of anthropogenic warming is associated with substantial changes in regional and global climate. The present study focuses on understanding the response of the annual-mean Hadley circulation from a perspective of interactions between climate feedbacks and tropical circulation. Simulations from an ensemble of coupled ocean–atmosphere models are used to quantify changes in Hadley cell strength in terms of feedbacks, radiative forcing, ocean heat uptake, atmospheric eddies, and gross moist stability. Climate feedbacks are calculated for the model integrations from phase 5 of CMIP (CMIP5) using radiative kernels. Tropical mean circulation is found to be reduced by up to 2.6% K−1 for an abrupt quadrupling of carbon dioxide concentration. The weakening is characterized by an increase in gross moist stability, by an increase in eddy heat flux, and by positive extratropical feedbacks, such as those associated with lapse rate and sea ice response. Understanding the impact of radiative feedbacks on the large-scale circulation provides a framework for constraining uncertainty in the dynamic climate response, including the hydrological cycle.
Soil moisture and other hydrological changes in a stratospheric aerosol geoengineering large ensemble
[J].
Temporal characteristics of actual evapotranspiration over China under global warming
[J].
The future of evapotranspiration: global requirements for ecosystem functioning, carbon and climate feedbacks, agricultural management, and water resources
[J].
Trend of estimated actual evapotranspiration over China during 1960-2002
[J].
The ERA5 global reanalysis
[J].
Climate Change 2021:The physical science basis. Contribution of Working Group I to the Sixth Assessment Report of the Intergovernmental Panel on Climate Change
[M/OL].
Recent decline in the global land evapotranspiration trend due to limited moisture supply
[J].
Regions of strong coupling between soil moisture and precipitation
[J].
LUCC-driven changes in gross primary production and actual evapotranspiration in North China
[J].
Responses of terrestrial water cycle components to afforestation within and around the Yellow River Basin
[J].
A 10 percent increase in global land evapotranspiration from 2003 to 2019
[J].
Evaluating the land-surface energy partitioning in ERA5
[J].
Evaluation of soil moisture in CMIP6 simulations
[J].This study employs multiple reanalysis datasets to evaluate the global shallow and deep soil moisture in Coupled Model Intercomparison Project phase 6 (CMIP6) simulations. The multimodel ensemble mean produces generally reasonable simulations for overall climatology, wet and dry centers, and annual peaks in the melt season at mid- to high latitudes and the rainy season at low latitudes. The simulation capability for shallow soil moisture depends on the relationship between soil moisture and the difference between precipitation and evaporation (P − E). Although most models produce effective simulations in regions where soil moisture is significantly related to the P − E (e.g., Europe, low-latitude Asia, and the Southern Hemisphere), considerable discrepancies between simulated conditions and reanalysis data occur at high elevations and latitudes (e.g., Siberia and the Tibetan Plateau), where cold-season processes play a driving role in soil moisture variability. These discrepancies reflect the lack of information concerning the thaw of snow and frozen ground in the reanalyzed data and the inability of models to simulate these processes. The models also perform poorly in areas of extreme aridity. On a global scale, the majority of models provide consistent and capable simulations owing to the minimal variability in deep soil moisture and limited observational information in reanalysis data. Models with higher spatial resolution do not exhibit closer agreement with the reanalysis data, indicating that spatial resolution is not the first limiting factor for CMIP6 soil moisture simulations.
Investigating soil moisture-climate interactions in a changing climate: a review
[J].
Comparison of ERA5 and ERA-Interim near-surface air temperature, snowfall and precipitation over Arctic sea ice: effects on sea ice thermodynamics and evolution
[J].
A review of global terrestrial evapotranspiration: observation, modeling, climatology, and climatic variability
[J].
Evaluation of soil moisture climatology and anomaly components derived from ERA5-land and GLDAS-2.1 in China
[J].
Trends in evapotranspiration and their responses to climate change and vegetation greening over the upper reaches of the Yellow River Basin
[J].
Quantitative assessment of the parameterization sensitivity of the Noah-MP land surface model with dynamic vegetation using ChinaFLUX data
[J].
Changes in evapotranspiration over global semiarid regions 1984-2013
[J].
A monthly 0.01° terrestrial evapotranspiration product (1982-2018) for the Tibetan Plateau
[J].
Seasonal and inter-annual variability of the Bowen smith ratio over a semiarid grassland in the Chinese Loess Plateau
[J].
Vegetation greening and climate change promote multidecadal rises of global land evapotranspiration
[J].Recent studies showed that anomalous dry conditions and limited moisture supply roughly between 1998 and 2008, especially in the Southern Hemisphere, led to reduced vegetation productivity and ceased growth in land evapotranspiration (ET). However, natural variability of Earth's climate system can degrade capabilities for identifying climate trends. Here we produced a long-term (1982-2013) remote sensing based land ET record and investigated multidecadal changes in global ET and underlying causes. The ET record shows a significant upward global trend of 0.88 mm yr(-2) (P < 0.001) over the 32-year period, mainly driven by vegetation greening (0.018% per year; P < 0.001) and rising atmosphere moisture demand (0.75 mm yr(-2); P = 0.016). Our results indicate that reduced ET growth between 1998 and 2008 was an episodic phenomenon, with subsequent recovery of the ET growth rate after 2008. Terrestrial precipitation also shows a positive trend of 0.66 mm yr(-2) (P = 0.08) over the same period consistent with expected water cycle intensification, but this trend is lower than coincident increases in evaporative demand and ET, implying a possibility of cumulative water supply constraint to ET. Continuation of these trends will likely exacerbate regional drought-induced disturbances, especially during regional dry climate phases associated with strong El Nino events.

