

引言
孟加拉地区位于青藏高原(简称“高原”)南侧、孟加拉湾北侧,是南亚与东亚两大季风区的交汇地带,是越赤道气流经过阿拉伯海、印度输送到东亚与南亚季风区的必经之地(Araya-Melo et al.,2015;Bosmans et al.,2018;Shi et al.,2020;Cheng and Lu,2020;Clemens et al.,2021),也是孟加拉湾的水汽输送到东亚地区的必经之地(Chen et al.,2013)。孟加拉地区的水汽变化与我国华北(张人禾,1999;郝立生等,2016)、华南(陶诗言等,1988;蔡学湛,2001)、江淮流域(尹树新和江燕如,1993;王文等,2017)以及河套地区(李栋梁等,2016)等的降水密切相关,研究孟加拉地区的水汽分布对于了解我国的气候变化有重要的科学意义。
1976/1977年太平洋海温及其大气环流发生显著的年代际突变,由正位相转为负位相,在海洋上表现为热带中东太平洋海表温度(Sea Surface Temperature,SST)出现年代际异常升高,黑潮及其延伸体区域和北太平洋中部SST异常降低,而北太平洋东部沿岸SST异常升高;大气方面表现为北太平洋海平面气压和500 hPa高度场明显降低,阿留申低压异常加深、东移并偏南(Trenberth,1990;Trenberth and Hurrell,1994)。Mantua等(1997)将20°N以北的太平洋海表温度异常的经验正交分解第一模态定义为北太平洋年代际振荡(Pacific Decadal Oscillation,PDO)。Power等(1999)研究表明这种年代际模态也存在于整个太平洋,即正位相表现为南、北太平洋SST呈现负异常而热带中东太平洋SST呈现正异常,并将其称之为太平洋年代际振荡(Interdecadal Pacific Oscillation,IPO)。相比于IPO,PDO更关注北太平洋,但两者在年际与年代际尺度上具有较高的相关性,IPO在1925、1945、1977年发生的位相转变与PDO类似(Han et al.,2014),PDO与IPO指数的月平均时间序列相关性达0.74(Newman et al.,2016)。
IPO与PDO作为年代际背景影响东亚夏季风环流,对东亚地区“南涝北旱”降水格局的年代际变化起主导作用:当IPO由正位相转为负位相时,热带太平洋SST东西梯度增大,南方涛动指数偏强,Walker环流偏强,Hadley环流东弱西强,东亚夏季风偏弱,我国华北及其以南大部分地区气压偏高,华北地区受异常西北风控制而降水减弱,长江下游地区则偏涝(王绍武和赵宗慈,1979;李峰和何金海,2000;陈隆勋等,2004;唐民和吕俊梅,2007;丁一汇等,2013;王会军和范可,2013;He et al.,2017;Yang et al.,2017)。IPO与PDO不仅作为年代际背景影响东亚地区降水,同时也作为年代际背景影响印度—太平洋地区降水的年代际变化(Deser et al.,2004),影响南亚季风区夏季降水,IPO与PDO正位相有利于孟加拉湾地区对流层下部东风带和对流层上部西风带异常,当IPO和PDO由正位相转为负位相时,Walker环流与Hadley环流均偏强,有利于年际尺度下孟加拉湾异常夏季风爆发,影响南亚季风降雨(Krishnan and Sugi,2003;Wu and Mao,2019;Huang et al.,2020)
综上所述,太平洋SST的年代际信号与东亚、南亚地区气候在年际和年代际尺度上有密切联系,而孟加拉地区正好位于南亚季风与东亚季风交汇区,太平洋SST异常也可能与孟加拉地区的气候变化有关联。在全球大气循环中,水汽作为重要的温室气体之一影响着地气系统(Hall and Manabe,1999;Solomon et al.,2010)。在全球变暖大背景下,孟加拉地区的空中水资源长期趋势及与IPO的联系是什么?本文分析该区域不同方向的水汽收支在整层以及垂直方向上的变化特征,揭示水汽收支对孟加拉地区空中水资源长期趋势的贡献,试图探讨夏季孟加拉地区大气可降水量(Atmospheric Precipitable Water,APW)的变化及与IPO的联系,揭示IPO影响孟加拉地区大气可降水量的可能物理过程。
1 资料和方法
采用1979—2020年欧洲中期天气预报中心(European Centre for Medium-Range Weather Forecasts,ECMWF)第五代大气数据再分析资料(ERA5)(Hersbach et al.,2020),空间分辨率为
海表温度数据集使用1979—2020年6—9月美国国家海洋和大气管理局(National Oceanic and Atmosphere Administration,NOAA)提供的第五代扩展重建海面温度数据集(Extended Reconstructed Sea Surface Temperature version 5,ERSSTv5)(Huang et al.,2017),ERASSTv5是源自国际海洋大气综合数据集(International Comprehensive Ocean-Atmosphere Data Set,ICOADS)的全球海面温度数据集,空间分辨率为2°×2°,相比以往的海温数据,对统计方法和偏差矫正方法进行了升级,增强了空间完整性。
对于太平洋年代际振荡信号,采用1979—2020年6—9月NOAA物理科学实验室(Physical Science Laboratory,PSL)提供的IPO指数(Henley et al.,2015)。
大气可降水量(APW)为整个大气柱内所含水汽的重量,APW及整层积分的水汽通量计算公式如下:
式中:Ptcwv(kg·m-2)为大气可降水量;q(kg·kg-1)为比湿;P(hPa)为大气气压,Ps(hPa)为地表气压,Pt(hPa)为大气层顶气压;g为重力加速度,取值9.8 m·s-2;u、v(m·s-1)分别为纬向风和经向风;
计算各边界的水汽收支并相加得到水汽净收支。4个边界的水汽收支计算公式如下:
式中:
用9 a滑动平均代表时间序列的年代际尺度变率,原始序列减去9 a滑动平均为时间序列的年际变率,9 a滑动平均计算公式如下:
式中:k表示滑动长度9;j=1,2,…,n-k+1,n为时间序列长度;
2 亚洲南部的降水与大气可降水量变化
从亚洲南部1979—2020年季节平均的APW空间分布(图1)可以看出,孟加拉地区(85
图1

图1
1979—2020年亚洲南部季节平均的APW空间分布(单位:kg·m-2)
(红色矩形框为孟加拉地区,下同)
(a)春季,(b)夏季,(c)秋季,(d)冬季
Fig.1
Spatial distribution of seasonal mean atmospheric precipitable water in southern Asia during 1979-2020 (Unit: kg·m-2)
(The red rectangle is the Bengal region. the same as below)
(a) spring, (b) summer, (c) autumn, (d) winter
图2
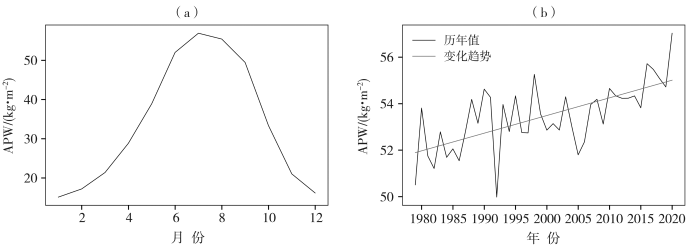
图2
1979—2020年孟加拉地区平均APW逐月变化(a)和6—9月平均APW的时间序列与变化趋势(b)
Fig.2
The monthly change of average atmospheric precipitable water in the Bengal region during 1979-2020 (a), the time series and its trend of average atmospheric precipitable water from June to September in the Bengal region during 1979-2020 (b)
3 水汽输送对孟加拉地区大气可降水量趋势的贡献
孟加拉地区位于高原南侧与孟加拉湾北侧,是亚洲季风的重要水汽通道,而水汽输送在大气水循环中起着非常重要的作用。
图3
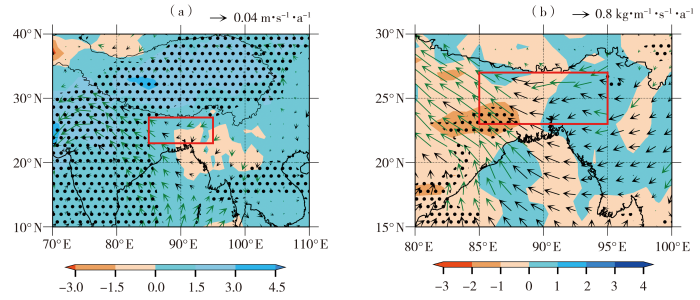
图3
1979—2020年亚洲南部夏季850 hPa平均矢量风(箭矢,单位:m·s-1·a-1)与比湿(填色,单位:10-4
(
Fig.3
Spatial distribution of variation trends of the average vector wind (arrow vectors, Unit: m·s-1·a-1) and specific humidity (the shaded, Unit: 10-4
(the dotted passing the significance test of α=0.1)
图4(a)为1979—2020年孟加拉地区各边界夏季平均的水汽收支,纬向上以向东为正,经向上以向北为正。可以看出,西边界、东边界、北边界的水汽收支气候态分别为负值、正值、正值,均为水汽支出边界;南边界的水汽收支气候态为正值,为水汽收入边界。西边界、东边界、北边界平均的水汽支出分别为28.3
图4
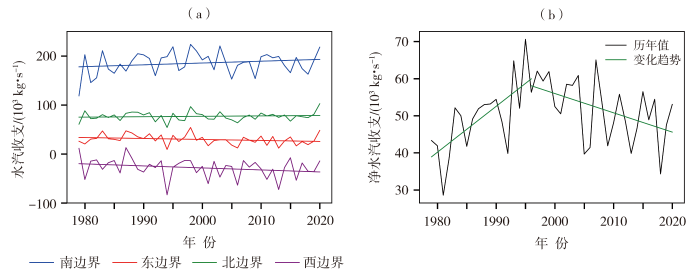
图4
1979—2020年夏季孟加拉地区各边界平均水汽收支(a)与水汽净收支(b)的时间序列与变化趋势
Fig.4
Time series and trends of water vapor budget of each boundary (a) and net water vapor budget (b) in the Bengal region in summer averaged from June to September during 1979-2020
表1 孟加拉地区各边界水汽收支及净水汽收支的变化趋势与水汽收支正、负气候态的物理意义
Tab.1
| 气候平均 | 对区域水汽的贡献 | 趋势 | 对区域水汽的贡献 | |
|---|---|---|---|---|
| 东边界 | 正值 | 区域内水汽减少 | 负值 | 支出水汽减少,区域内水汽增多 |
| 西边界 | 负值 | 区域内水汽减少 | 负值 | 支出水汽增加,区域内水汽减少 |
| 北边界 | 正值 | 区域内水汽减少 | 正值 | 支出水汽增加,区域内水汽减少 |
| 南边界 | 正值 | 区域内水汽增加 | 正值 | 收入水汽增加,区域内水汽增加 |
| 孟加拉区域 | 正值 | 区域内水汽增加 | 正值 | 收入水汽增加,区域内水汽增加 |
从图4(b)看出,1979—2020年孟加拉地区的水汽净收支存在2个不同的变化阶段,1979—1996年以1 236.6 kg·s-1·a-1的趋势显著上升,且通过α=0.000 1的显著性检验;1996—2020年以-520.0 kg·s-1·a-1的趋势显著下降,通过α=0.02的显著性检验。综合看来,1979—2020年孟加拉地区的总水汽收支以73.9 kg·s-1·a-1的趋势增加,但未通过显著性检验,表明水汽收支的长期趋势有利于孟加拉地区APW增加。
图5

图5
1979—2020年夏季孟加拉地区垂直分布的各边界水汽收支与水汽净收支气候态(a)及其趋势(b)
(★表示通过α=0.1的显著性检验)
Fig.5
The vertical distribution of water vapor budget of each boundary and net water vapor budget (a) and their trends (b) in the Bengal region in summer averaged from June to September during 1979-2020
(the stars passing the significance test of α=0.1)
从图5(b)看出,孟加拉地区西边界水汽收支趋势在各层均为负值,水汽支出增加趋势最大值-0.029 kg·s-1·a-1在925 hPa,表明从西边界支出的水汽增多,不利于孟加拉地区水汽增加;东边界各层也为负趋势,水汽支出减少趋势最大值-0.013 kg·s-1·a-1在850 hPa,东边界水汽支出减少有利于孟加拉地区水汽增加;南边界水汽收支趋势为正,水汽收入增加趋势最大值0.027 kg·s-1·a-1在700 hPa,表明从南边界收入的水汽更多,利于孟加拉地区水汽增加;北边界水汽支出400 hPa以上、850 hPa以下为负趋势,最大值0.014 kg·s-1·a-1在600 hPa,整体上呈正趋势,表明从北边界支出的水汽增多,不利于孟加拉地区水汽增加。从孟加拉地区总的水汽收支趋势来看,600 hPa以上、925 hPa以下为负趋势,其他高度为正趋势,最大值0.001 kg·s-1·a-1在850 hPa。
4 大气可降水量与海气系统的关系
图6为1979—2020年孟加拉地区夏季平均APW与SST的相关系数分布。可以看出,孟加拉地区夏季平均APW与同期热带印度洋、北太平洋、西太平洋和南太平洋SST显著正相关,最大相关系数超过0.6;与赤道中太平洋、东南太平洋的零星区域SST呈负相关,与南印度洋小范围区域SST呈显著负相关,最大相关系数约-0.4。从孟加拉地区APW与太平洋SST相关分布来看,其空间分布形态呈IPO负位相。
图6
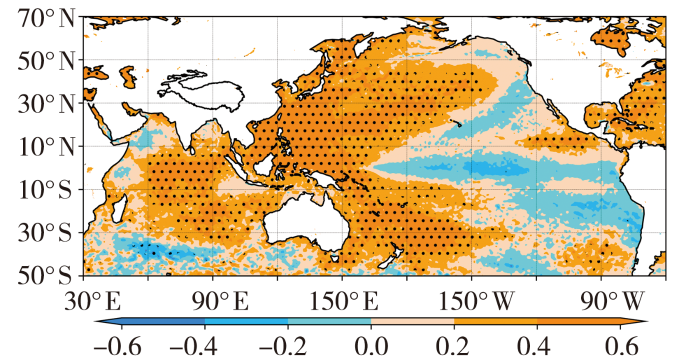
图6
1979—2020年孟加拉地区夏季平均APW与同期平均海表面温度的相关系数分布
(打点区通过α=0.05的显著性检验)
Fig.6
The distribution of correlation coefficients between APW in summer in the Bengal region and average sea surface temperature in the same period during 1979-2020
(the dotted area passing the significance test of α=0.05)
夏季孟加拉地区的APW与原始IPO指数序列呈显著负相关(相关系数为-0.39)(图7),通过α=0.01的显著性检验。在年代际尺度上,夏季孟加拉地区APW与夏季IPO指数的相关系数为-0.70,通过α=0.01的显著性检验(图略);在年际尺度上,夏季孟加拉地区APW与夏季IPO指数的相关系数为-0.33,通过α=0.05的显著性检验(图略)。夏季的IPO与夏季孟加拉地区APW在年际和年代际尺度上都具有密切联系,基于此,采用原始的IPO指数序列探讨其伴随的环流异常对孟加拉地区水汽的可能影响。
图7
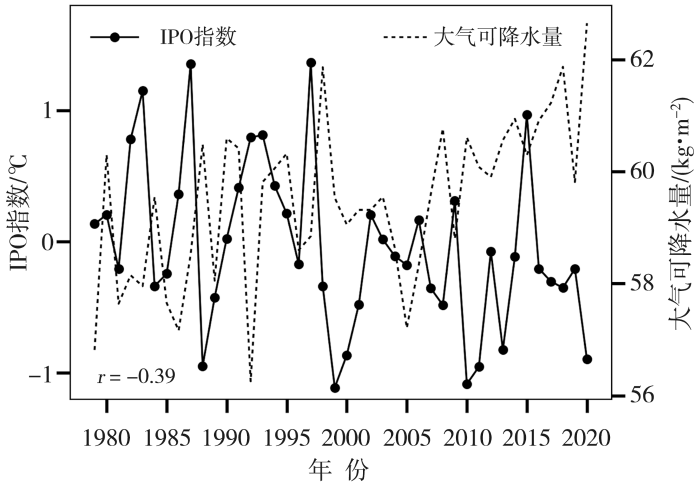
图7
1979—2020年孟加拉地区夏季平均的APW与IPO指数的时间序列
Fig.7
Time series of summer average atmospheric precipitable water and IPO index in the Bengal region from 1979 to 2020
图8为1979—2020年夏季平均的IPO指数回归的850 hPa和200 hPa水平风场和位势高度场。从图8(a)可以看出,南、北太平洋850 hPa为显著的负位势高度距平,最大值超过-60 gpm,北太平洋风场呈气旋型环流异常。热带西太平洋至东太平洋呈显著的西风异常,这与ENSO相关的热带风场分布型一致。热带印度洋风场呈显著的东风异常,在东亚地区分别向南、北偏转,在印度洋—阿拉伯—印度一带形成反气旋型环流异常,反气旋环流中心位于阿拉伯半岛,热带南印度洋呈气旋型环流异常。热带印度洋北部为位势高度正异常,最大值超过50 gpm。印度季风偏弱,热带印度洋北部呈异常的反气旋性环流,孟加拉地区为西北风异常,利于气流从西边界输送到孟加拉地区。
图8
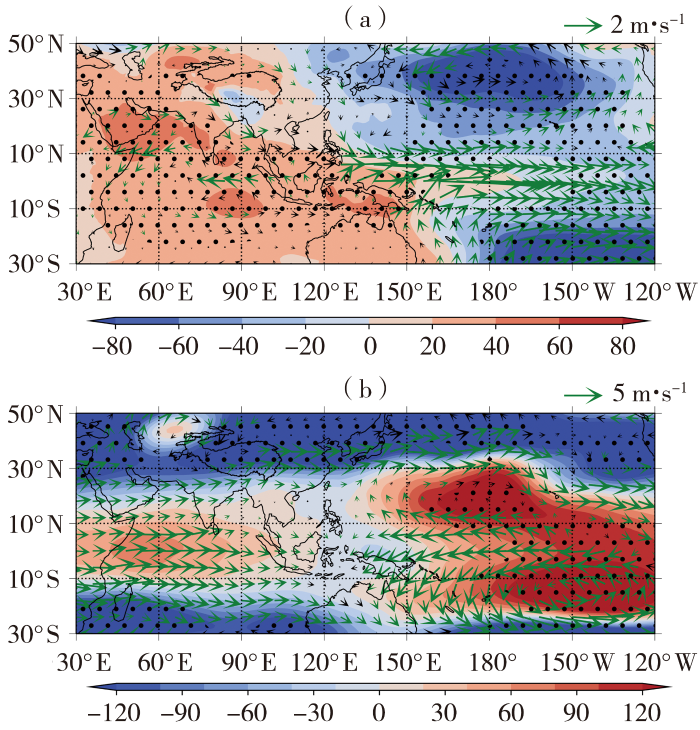
图8
1979—2020年夏季平均IPO指数回归的850 hPa(a)和200 hPa(b)位势高度场(填色,单位:
(打点区与绿色箭矢通过α=0.05的显著性检验)
Fig.8
The 850 hPa (a) and 200 hPa (b) geopotential height (the color shaded, Unit: gpm) and horizontal wind (arrow vectors, Unit: m·s-1) regressed by IPO index averaged in summer during 1979-2020
(The dotted area and green arrow vectors pass the significance test of α=0.05)
总体来说,当IPO为正位相时,热带太平洋盛行西风异常,南北太平洋为气旋型环流异常,热带印度洋盛行东风异常,其南北两侧为气旋型与反气旋型环流异常。从IPO伴随的热带印度洋和太平洋位势高度和风场异常结构可以看出,热带太平洋西风异常为东传的热带开尔文波结构,热带南、北印度洋的反气旋型环流异常为Gill型反气旋环流(Gill,1980)。印度和孟加拉地区西风加强,抑制了热带水汽从南侧的孟加拉湾和东侧的西太平洋输入,不利于孟加拉地区水汽增加。
从图8(b)看出,热带印度洋和热带太平洋200 hPa为正位势高度距平,分别盛行西风和东风异常,与850 hPa风场盛行方向相反。气流在西太平洋地区辐合下沉,对流层低层辐散。在北半球中纬度为负位势高度距平,盛行西风异常,表明对流层上层西风急流加强。热带南、北太平洋200 hPa呈反气旋型异常环流,与对流层低层相反。
从高低层配置来看,在热带印度洋和太平洋呈准斜压结构。这一高低层结构表明,西太平洋高层辐合、低层辐散,热带太平洋低层盛行西风异常、高层盛行东风异常,呈反向Walker环流异常,表明太平洋上Walker环流偏弱。同理,热带印度洋上Walker环流也是减弱。即当IPO为正位相时,印度洋上Walker环流减弱,热带印度洋呈Gill型反气旋型环流,印度季风偏弱,西太平洋地区盛行下沉气流,印度至中南半岛一带西风增强,抑制了从南侧孟加拉湾和东侧西太平洋的水汽向孟加拉地区输送,不利于这一地区的水汽增加;反之当IPO为负位相时,Walker环流偏强,印度季风偏强,有利于水汽输送到孟加拉地区。
图9为1979—2020年夏季平均IPO指数回归的夏季APW和850 hPa水汽输送通量。当IPO为正位相时,赤道印度洋盛行向西的水汽输送,印度西北部和热带印度洋东部均呈反气旋型的水汽输送异常,印度季风减弱;位势高度场上同样对应为反气旋型环流异常(图8),盛行下沉气流,不利于水汽在热带太平洋西部与热带印度洋东部地区汇聚。印度北部至孟加拉地区一带盛行西北向的水汽输送[图9(a)],不利于来自孟加拉湾和西太平洋的水汽向孟加拉地区输送,孟加拉地区APW偏少。从图9(b)看出,IPO与孟加拉地区的APW呈显著负相关,并且IPO与孟加拉地区西边界、南边界的水汽输送关系密切,当IPO为正位相时,西边界向孟加拉地区输入水汽,南边界从孟加拉地区输出水汽,且输出水汽大于输入水汽,不利于孟加拉地区水汽增加。反之当IPO为负位相时,印度季风偏强,有利于水汽从南边界进入孟加拉地区,有利于该地区APW增加。
图9
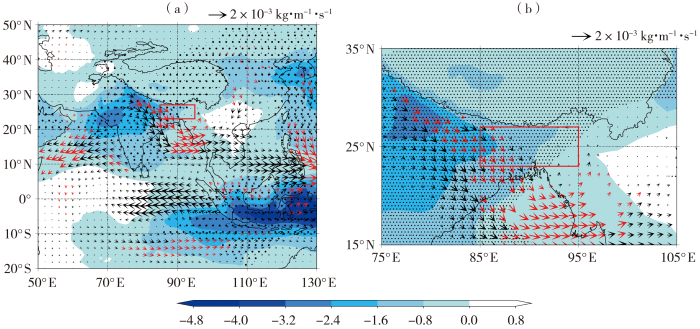
图9
1979—2020年夏季平均IPO指数回归的850 hPa水汽通量(箭矢,单位:kg·m-1·s-1)和大气可降水量(填色,单位:kg·m-2)
(打点区与红色箭矢表示通过α=0.10的显著性检验)
(a)50
Fig.9
The 850 hPa water vapor flux (arrow vectors, Unit: kg·m-1·s-1) and atmospheric precipitable water (the color shaded, Unit: kg·m-2) regressed by IPO index averaged in summer during 1979-2020
(The dotted area and red vector arrows pass the significance test of α=0.10)
(a) 50
综上所述,IPO与夏季孟加拉地区APW在年际和年代际尺度均呈显著负相关。当IPO为正位相时,太平洋与印度洋上Walker环流减弱;对流层低层的水平风场上,热带太平洋盛行西风异常,热带印度洋盛行东风异常,在热带北印度洋和南亚地区与热带南印度洋东部表现为Gill型反气旋环流,印度季风偏弱,不利于从孟加拉湾和西太平洋来的水汽输送至孟加拉地区,不利于孟加拉地区水汽增多。
5 结论
本文基于1979—2020年ERA5资料、IPO指数、ERASSTv5等资料,研究了孟加拉地区夏季水汽变化及其与太平洋年代际振荡的联系,得到如下结论:
(1)1979—2020年,孟加拉地区APW在亚洲南部同纬度地区中最大,夏季水汽最丰沛并呈显著增加趋势。
(2)孟加拉地区西边界与北边界的水汽支出增多,不利于该区域水汽增加;东边界水汽支出减少与南边界水汽收入增加利于该区域水汽增加;孟加拉地区的水汽净收支呈增加趋势。
(3)孟加拉地区夏季APW与IPO在年际、年代际尺度上均呈显著负相关。当IPO为正位相时,热带太平洋低层盛行西风异常,高层盛行东风异常,太平洋上Walker环流减弱;热带印度洋低层盛行东风异常,高层盛行西风异常,印度洋上Walker环流减弱。热带印度洋低层为Gill型反气旋性环流,反气旋伴随的下沉气流不利于该地区水汽增加。印度季风偏弱,印度北部至孟加拉地区盛行西北风异常,不利于从孟加拉湾和西太平洋来的水汽输送至孟加拉地区,孟加拉地区夏季APW减少。反之,当IPO为负位相时,太平洋与印度洋上的Walker环流增强,印度季风偏强,有利于从孟加拉湾和西太平洋来的水汽输送到孟加拉地区,孟加拉地区夏季APW增加。
参考文献
El Ni(n)o盛期印度夏季风水汽输送在我国华北地区夏季降水异常中的作用
[J].
通过对1951~1994年我国夏季160个站降水资料的分析,指出El Niño盛期在我国华北地区具有显著的降水负异常。为了解释这种降水负异常产生的原因,利用NCEP/NCAR1949~1996年再分析资料,分析了夏季印度季风区的水汽输送在东亚季风区水汽输送中的作用。结果表明,印度季风区的水汽输送与我国华北地区的水汽输送有显著的正相关。El Niño期间往往对应着弱印度季风,即El Ni珘no盛期与弱印度夏季风相联系的弱水汽输送造成了我国华北地区水汽输送的减弱,使得华北地区上空大气中可降水量产生显著负异常,由此导致了负的降水异常。
Global sensitivity analysis of the Indian monsoon during the Pleistocene
[J].. The sensitivity of the Indian monsoon to the full spectrum of climatic conditions experienced during the Pleistocene is estimated using the climate model HadCM3. The methodology follows a global sensitivity analysis based on the emulator approach of Oakley and O'Hagan (2004) implemented following a three-step strategy: (1) development of an experiment plan, designed to efficiently sample a five-dimensional input space spanning Pleistocene astronomical configurations (three parameters), CO2 concentration and a Northern Hemisphere glaciation index; (2) development, calibration and validation of an emulator of HadCM3 in order to estimate the response of the Indian monsoon over the full input space spanned by the experiment design; and (3) estimation and interpreting of sensitivity diagnostics, including sensitivity measures, in order to synthesise the relative importance of input factors on monsoon dynamics, estimate the phase of the monsoon intensity response with respect to that of insolation, and detect potential non-linear phenomena. By focusing on surface temperature, precipitation, mixed-layer depth and sea-surface temperature over the monsoon region during the summer season (June-July-August-September), we show that precession controls the response of four variables: continental temperature in phase with June to July insolation, high glaciation favouring a late-phase response, sea-surface temperature in phase with May insolation, continental precipitation in phase with July insolation, and mixed-layer depth in antiphase with the latter. CO2 variations control temperature variance with an amplitude similar to that of precession. The effect of glaciation is dominated by the albedo forcing, and its effect on precipitation competes with that of precession. Obliquity is a secondary effect, negligible on most variables except sea-surface temperature. It is also shown that orography forcing reduces the glacial cooling, and even has a positive effect on precipitation. As regards the general methodology, it is shown that the emulator provides a powerful approach, not only to express model sensitivity but also to estimate internal variability and detect anomalous simulations.
Response of the Asian summer monsoons to idealized precession and obliquity forcing in a set of GCMs
[J].
Main moisture sources affecting lower Yangtze River Basin in boreal summers during 2004-2009
[J].
Moisture source-receptor network of the East Asian summer monsoon land regions and the associated atmospheric steerings
[J].Arctic–midlatitude teleconnections are complex and multifaceted. By design, targeted modeling studies typically focus only on one direction of influence—usually, the midlatitude atmospheric response to a changing Arctic. The two-way, coupled feedbacks between the Arctic and the midlatitude circulation on submonthly time scales are explored using a regularized regression model formulated around Granger causality. The regularized regression model indicates that there are regions in which Arctic temperature drives a midlatitude circulation response, and regions in which the midlatitude circulation drives a response in the Arctic; however, these regions rarely overlap. In many regions, on submonthly time scales, the midlatitude circulation drives Arctic temperature variability, highlighting the important role the midlatitude circulation can play in impacting the Arctic. In particular, the regularized regression model results support recent work that indicates that the observed high pressure anomalies over Eurasia drive a significant response in the Arctic on submonthly time scales, rather than being driven by the Arctic.
Remote and local drivers of Pleistocene South Asian summer monsoon precipitation: a test for future predictions
[J].
Pacific interdecadal climate variability: linkages between the tropics and the north Pacific during Boreal winter since 1900
[J].
Some simple solutions for heat-induced tropical circulation
[J].
The role of water vapor feedback in unperturbed climate variability and global warming
[J].
Intensification of decadal and multi-decadal sea level variability in the western tropical Pacific during recent decades
[J].
Interannual variability of Eastern China summer rainfall: the origins of the meridional triple and dipole modes
[J].
A tripole index for the interdecadal Pacific oscillation
[J].
The ERA5 global reanalysis
[J].
Extended reconstructed sea surface temperature, version 5 (ERSSTv5): upgrades, validations, and intercomparisons
[J].
South Asian summer monsoon projections constrained by the interdecadal Pacific oscillation
[J].
Pacific decadal oscillation and variability of the Indian summer monsoon rainfall
[J].
Decadal modulation of the ENSO-Indian ocean basin warming relationship during the decaying summer by the interdecadal Pacific oscillation
[J].
A Pacific interdecadal climate oscillation with impacts on salmon production
[J].
The Pacific decadal oscillation, revisited
[J].
ENSO-forced variability of the Pacific decadal oscillation
[J].
Inter-decadal modulation of the impact of ENSO on Australia
[J].
A Lagrangian analysis of water vapor sources and pathways for precipitation in East China in different stages of the East Asian summer monsoon
[J].The Hybrid Single-Particle Lagrangian Integrated Trajectory (HYSPLIT) platform is used to simulate Lagrangian trajectories of air parcels in East China during the summer monsoon. The investigation includes four distinct stages of the East Asian summer monsoon (EASM) during its seasonal migration from south to north. Correspondingly, the main water vapor channel migrates from the west Pacific Ocean (PO) for the premonsoon in South China (SC) to the Indian Ocean (IO) for the monsoon in SC and in the Yangtze–Huaihe River basin, and finally back to the PO for the terminal stage of monsoon in North China. Further calculations permit us to determine water vapor source regions and water vapor contribution to precipitation in East China. To a large extent, moisture leading to precipitation does not come from the strongest water vapor pathways. For example, the proportions of trajectories from the IO are larger than 25% all of the time, but moisture contributions to actual precipitation are smaller than 10%. This can be explained by the large amount of water vapor lost in the pathways across moisture-losing areas such as the Indian and Indochina Peninsulas. Local water vapor recycling inside East China (EC) contributes significantly to regional precipitation, with contributions mostly over 30%, although the trajectory proportions from subregions in EC are all under 10%. This contribution rate can even exceed 55% for the terminal stage of the monsoon in North China. Such a result provides important guidance to understand the role of land surface conditions in modulating rainfall in North China.
Contributions of stratospheric water vapor to decadal changes in the rate of global warming
[J].
Decadal atmosphere-ocean variations in the Pacific
[J].
Recent observed interdecadal climate changes in the Northern Hemisphere
[J].
Decadal changes in interannual dependence of the Bay of Bengal summer monsoon onset on ENSO modulated by the Pacific Decadal Oscillation
[J].
Decadal modulation of precipitation patterns over eastern China by sea surface temperature anomalies
[J].El Niño–Southern Oscillation (ENSO) is the dominant mode of interannual variability in the tropical Pacific. However, the models in the ensemble from phase 5 of the Coupled Model Intercomparison Project (CMIP5) have large deficiencies in ENSO amplitude, spatial structure, and temporal variability. The use of stochastic parameterizations as a technique to address these pervasive errors is considered. The multiplicative stochastically perturbed parameterization tendencies (SPPT) scheme is included in coupled integrations of the National Center for Atmospheric Research (NCAR) Community Atmosphere Model, version 4 (CAM4). The SPPT scheme results in a significant improvement to the representation of ENSO in CAM4, improving the power spectrum and reducing the magnitude of ENSO toward that observed. To understand the observed impact, additive and multiplicative noise in a simple delayed oscillator (DO) model of ENSO is considered. Additive noise results in an increase in ENSO amplitude, but multiplicative noise can reduce the magnitude of ENSO, as was observed for SPPT in CAM4. In light of these results, two complementary mechanisms are proposed by which the improvement occurs in CAM. Comparison of the coupled runs with a set of atmosphere-only runs indicates that SPPT first improve the variability in the zonal winds through perturbing the convective heating tendencies, which improves the variability of ENSO. In addition, SPPT improve the distribution of westerly wind bursts (WWBs), important for initiation of El Niño events, by increasing the stochastic component of WWB and reducing the overly strong dependency on SST compared to the control integration.

