

引言
在陆面过程模式中,土壤温度是一个极其重要的变量(Ukkola et al., 2016a; Oogathoo et al., 2022),其模拟性能通过影响土壤热通量(An et al., 2017; Cuntz and Haverd, 2018),进而影响感热通量和潜热通量的模拟性能(Ukkola et al., 2016a; Ukkola et al., 2016b)。感热通量和潜热通量对降水和气温产生影响(Seneviratne et al., 2010),而降水和气温的模拟误差又会影响融雪时间、土壤温度、生长季节长度等(Oogathoo et al., 2022)。此外,在相变过程中,土壤水分与热传输耦合,土壤温度的变化同土壤水分相互作用,因此土壤温度模拟性能的准确性直接影响土壤水分模拟性能的准确性,特别是存在冻融过程的高寒山区和缺水的干旱半干旱地区,土壤温度模拟的准确性对土壤液态水的模拟尤为重要(Cuntz and Haverd, 2018; Oogathoo et al., 2022)。
通用陆面过程模式(Community Land Model,CLM)是通用地球系统模式(Community Earth System Model,CESM)里的陆面模块,是目前国际上最具发展潜力且发展最完善的陆面过程模式之一(Dickinson et al., 2006)。CLM包含了详细的陆面过程,可以连续地模拟地表水热,已被广泛应用(朱昱作等,2019)。针对CLM对土壤温度的模拟性能,有学者开展了大量研究,指出CLM模式能较为准确地模拟出土壤剖面和各土层土壤温度的时空分布及年际变化(陈海山等,2010;陈猛等,2015),但依然存在一定的偏差,主要表现在:CLM模式普遍低估了土壤温度(陈海山等,2010),且模式对浅层土壤温度模拟较好,而土壤深层则相对较差(夏坤等,2011;陈渤黎等,2014a;张兴山等,2014;杨扬等,2016);在季节性冻土区域,CLM模式对冻融过程中土壤温度模拟较好,但冻结期的模拟精度低于非冻结期,冻结期模拟值普遍偏低(夏坤等,2011;陈渤黎等,2014a)。
CLM 5.0是CLM模式的最新版本,具有较完善的水文循环机制(Swenson and Lawrence, 2014; Lawrence et al., 2019; Magliulo et al., 2021)。相较于CLM 4.5,CLM 5.0在土壤、雪密度和作物建模上有显著改进(Lawrence et al., 2019)。然而,高寒山区具有复杂的气候、地形、植被与土壤条件,分布着大量积雪和冻土,冻融过程使得水热传输更加特殊和复杂,导致对土壤温度进行准确模拟依然较为困难(夏坤等,2011; 李时越,2018)。此外,干旱半干旱地区昼夜温差大,土壤温度变异性强,进一步加大了土壤温度准确模拟的困难(张海宏等,2011;李火青等,2018)。尽管对于CLM模式土壤温度模拟性能评估的研究已有很多,但目前使用CLM 5.0对土壤温度在干旱环境中高寒山区模拟性能进行评估的研究较少。同时,CLM模式低估土壤温度的原因尚不清楚。因此,本文选择高寒山区——黑河上游为研究区,基于9个观测站数据对CLM 5.0在高寒山区的土壤温度模拟性能进行评估分析,以期为陆面过程模式在高寒山区的应用及改进提供科学依据。
1 研究区概况、资料与方法
1.1 研究区概况
黑河流域上游位于祁连山区(图1),流域面积10 009 km2,干流长度为313 km,属于半干旱半湿润温带大陆性季风气候(Deng et al., 2015; Zhang et al., 2016)。该地区气候阴湿寒冷,高山深谷共存,地势差异显著,气温、地表植被和降水具有垂直分带性。黑河上游年平均气温为-3.1~3.6 ℃,最低气温为-28 ℃。年平均降水量为250(海拔1 900 m以下)~700 mm(海拔3 600 m以上),降水量主要集中在6—9月(Zhang et al., 2017)。该区域寒冷和干旱共存,拥有多种景观,主要包括冰川、冻土、高山草甸和森林(Xu et al., 2020; 彭晨阳等,2021),是理想的自然野外实验区(Li et al., 2013; Liu et al., 2018)。黑河流域上游9个观测站(阿柔站、大沙龙站、大野口站、康乐站、扁都口站、黄草沟站、峨堡站、垭口站和景阳岭站)的地理位置如图1所示。
图1
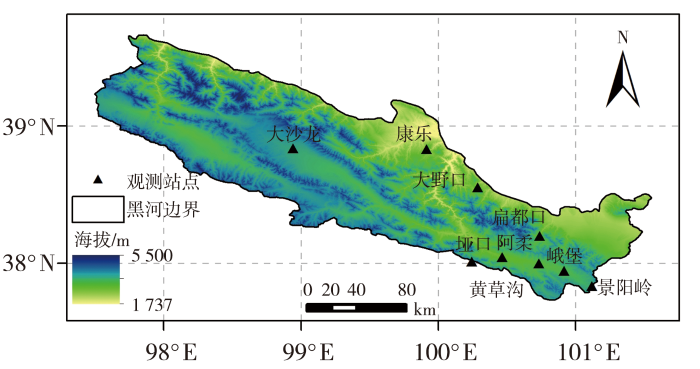
图1
黑河流域上游地形及9个观测站点空间分布
Fig.1
Topography and spatial distribution of 9 observation stations in the upper reaches of the Heihe River Basin
1.2 资料
1.2.1 土壤温度资料
选取黑河流域上游9个观测站土壤温度观测数据和CLM 5.0模拟的土壤温度进行对比分析。其中,扁都口、大野口和康乐站的土壤温度采用型号为109的CAMPBELL仪器(美国)测量,而其他站点的土壤温度数据则由祁连山综合观测网:黑河综合观测网数据集提供(Liu et al., 2018),其测量仪器CAMPBELL的型号为107(美国)。所有站的观测数据时间分辨率均为30 min,扁都口、康乐和大野口站的测量仪器垂直安装在采样土壤层中,测量深度分别为0~10、>10~20、>20~30、>30~50、>50~70 cm,阿柔站测量深度分别为0~7、>7~15、>15~30、>30~50 cm,其他站点测量深度分别为0~7、>7~15、>15~30、>30~60 cm。表1列出黑河流域上游9个观测站数据的详细说明。
表1 黑河流域上游9个观测站数据的详细说明
Tab.1
| 站名 | 经度 | 纬度 | 海拔/m | 下垫面类型 | 数据时间 | 时间分辨率/min |
|---|---|---|---|---|---|---|
| 阿柔 | 100.464°E | 38.047°N | 3 033 | 亚高山山地草甸 | 2013—2019年 | 30 |
| 扁都口 | 100.737°E | 38.201°N | 2 886 | 农牧交错带草地 | 2016—2018年 | 30 |
| 大沙龙 | 98.941°E | 38.840°N | 3 739 | 沼泽化高寒草甸 | 2015—2018年 | 30 |
| 大野口 | 100.285°E | 38.556°N | 2 698 | 森林草地过渡带草地 | 2015—2018年 | 30 |
| 峨堡 | 100.915°E | 37.949°N | 3 294 | 草地 | 2014—2015年 | 30 |
| 黄草沟 | 100.731°E | 38.003°N | 3 137 | 草地 | 2014年 | 30 |
| 景阳岭 | 101.116°E | 37.838°N | 3 750 | 高寒草甸 | 2019年 | 30 |
| 康乐 | 99.913°E | 38.834°N | 2 839 | 草原草地 | 2016—2018年 | 30 |
| 垭口 | 100.242°E | 38.014°N | 4 148 | 高寒草甸 | 2015—2018年 | 30 |
1.2.2 CLM 5.0的驱动数据
CLM 5.0的驱动数据主要分为大气强迫数据和地表数据。大气强迫数据包括近地面风速、温度、比湿、压强、降水、大气短波辐射和长波辐射。景阳岭、阿柔、大沙龙、峨堡、黄草沟和垭口站的大气强迫数据来自祁连山综合观测网:黑河流域地表过程综合观测网(https://data.tpdc.ac.cn/zh-hans)(Liu et al., 2018),时间分辨率为30 min。康乐、大野口和扁都口站的近地面风速、温度、比湿和降水等气象强迫数据由自动气象站(美国Spectrum公司生产,型号:WatchDog 2000)采集,时间分辨率为30 min(Wang et al., 2016a);近地面压强、向下长波辐射和短波辐射来自1979—2018年中国区域地面气象要素驱动数据集(阳坤等, 2019; He et al., 2020),空间分辨率为0.1°×0.1°,时间分辨率为3 h。地表数据包括土壤数据(土壤有机质和粘土、砂土的百分比)和土地利用数据。其中,大野口、扁都口和康乐站的土壤数据为实验分析数据,其他站则采用陆面模拟的中国土壤数据集(Shangguan et al., 2013; 上官微和戴永久,2014);土地利用数据采用祁连山区域30 m人类活动参数产品数据集(V2.0,2020)(杨爱霞等, 2021; Zhong et al., 2021)。以上数据集均由国家青藏高原科学数据中心提供。
1.3 模式介绍
1.4 试验设计
在9个观测站点使用CLM 5.0进行单点离线模拟试验,利用气象数据作为CLM模式的强迫数据,利用导出的土壤数据和土地利用数据替换模式在每个站点的默认值,并运行卫星物候模式(Satellite Phenology, CLMSP)。由于初始条件显著影响模式性能(Yang et al., 2018),为了达到水热状态平衡,各站点选用首年数据,进行80 a的spin-up(Lawrence et al., 2019; Umair et al., 2019; Yang et al., 2021),最后使用CLM 5.0平衡后的数值作为初始值进行模拟。试验运行的网格时间分辨率为30 min、空间分辨率为0.1°×0.1°。
1.5 模型评价分类
由于黑河上游陆面过程十分复杂,为了更全面地评估CLM 5.0模拟土壤温度的性能,从整体、植被类型、土壤分层、生长季和非生长季、冻结期和非冻结期5个方面进行评估。9个站点按植被类型可分为两类:阿柔、大沙龙、景阳岭和垭口站为高寒草甸;扁都口、大野口、峨堡、黄草沟和康乐站为草地。对于土壤分层而言,由于实测值和模拟值土壤深度不同,为方便对比,通过加权平均法处理为对应层的值,具体公式(Deng et al., 2020)如下:
式中:i(i=1,2,3,…,N)是原始模拟或观测土壤温度的土壤层;
表2 黑河流域上游9个观测站土壤温度模拟值和实测值的土壤层数及其对应深度
Tab.2
| 处理后 | 实测土壤温度 | 模拟土壤温度 | |||||||||
|---|---|---|---|---|---|---|---|---|---|---|---|
| 扁都口、大野口、康乐站 | 阿柔站 | 其余站 | 阿柔站 | 其余站 | |||||||
| 土壤层数 | 土壤深度/cm | 土壤层数 | 土壤深度/cm | 土壤层数 | 土壤深度/cm | 土壤层数 | 土壤深度/cm | 土壤层数 | 土壤深度/cm | 土壤层数 | 土壤深度/cm |
| 1 | [0, 12] | 1 | [0, 10] | 1~2 | [0, 15] | 1~2 | [0, 15] | 1~3 | [0, 12] | 1~3 | [0, 12] |
| 2 | (12, 32] | 2~3 | (10, 30] | 3 | (15, 30] | 3 | (15, 30] | 4~5 | (12, 32] | 4~5 | (12, 32] |
| 3 | (32, 68] | 4~5 | (30, 70] | 4 | (30, 50] | 4 | (30, 60] | 6 | (32, 48] | 6~7 | (32, 68] |
表3 不同年份黑河流域上游9个观测站的非冻结期
Tab.3
| 站点 | 非冻结期 |
|---|---|
| 阿柔 | 2013年5月3日至11月2日,2014年5月3日至11月16日,2015年5月7日至11月13日,2016年5月4日至11月9日,2017年5月2日至11月12日,2018年5月3日至11月13日,2019年4月30日至11月14日 |
| 扁都口 | 2016年4月4日至11月28日,2017年3月30日至11月24日,2018年3月21日至11月20日 |
| 大沙龙 | 2015年5月27日至10月27日,2016年5月26日至10月25日,2017年5月29日至10月26日,2018年5月20日至10月18日 |
| 大野口 | 2015年5月1日至11月9日,2016年4月27日至11月1日,2017年5月1日至11月12日,2018年5月6日至11月3日 |
| 峨堡 | 2014年5月31日至11月3日,2015年6月1日至10月31日 |
| 黄草沟 | 2014年5月14日至11月2日 |
| 景阳岭 | 2019年5月30日至10月24日 |
| 康乐 | 2016年3月26日至11月8日,2017年3月27日至11月14日,2018年3月14日至11月7日 |
| 垭口 | 2016年6月23日至10月5日,2017年6月28日至10月8日,2018年6月19日至9月26 |
1.6 评价指标
选取皮尔逊相关系数(R)、均方根误差(Root Mean Square Error, RMSE)、RMSE观测标准偏差率(RMSE-Observations Standard Deviation Ratio, RSR)和偏差(Bias)来评价各模式模拟值与实测值的相关性和精度(Moriasi et al., 2007; Li et al., 2011;李时越等,2018;杜鹃等,2019;朱昱作等,2019;宁锋伟等,2023)。其中,RMSE是实测值和模拟值之间差异的量度(肖方景等,2023),RSR最优值为0,RSR越低,表明RMSE越低,模式模拟性能越好(Li et al., 2011);R越大,Bias、RMSE和RSR的绝对值越小,模拟性能越好。
2 结果与分析
2.1 土壤温度的整体模拟性能分析
将黑河流域9个观测站的土壤温度观测值和CLM 5.0模拟值采用加权平均法处理为整个土壤剖面的值,结果如图2所示。所有测站土壤温度观测值与模拟值的R值为0.897~0.984,均通过0.01的显著性检验,表明CLM 5.0能较好地模拟土壤温度的年际变化。RMSE值为2.175~6.069 ℃,RSR值范围为0.332~0.879,模拟性能从高到低依次是扁都口>景阳岭>黄草沟>康乐>峨堡>阿柔>大沙龙>大野口>垭口。Bias值为-4.934~-0.773 ℃,说明CLM 5.0普遍低估土壤温度。综上可知,CLM 5.0能较好地模拟土壤温度的年际变化,但存在一定偏差。
图2
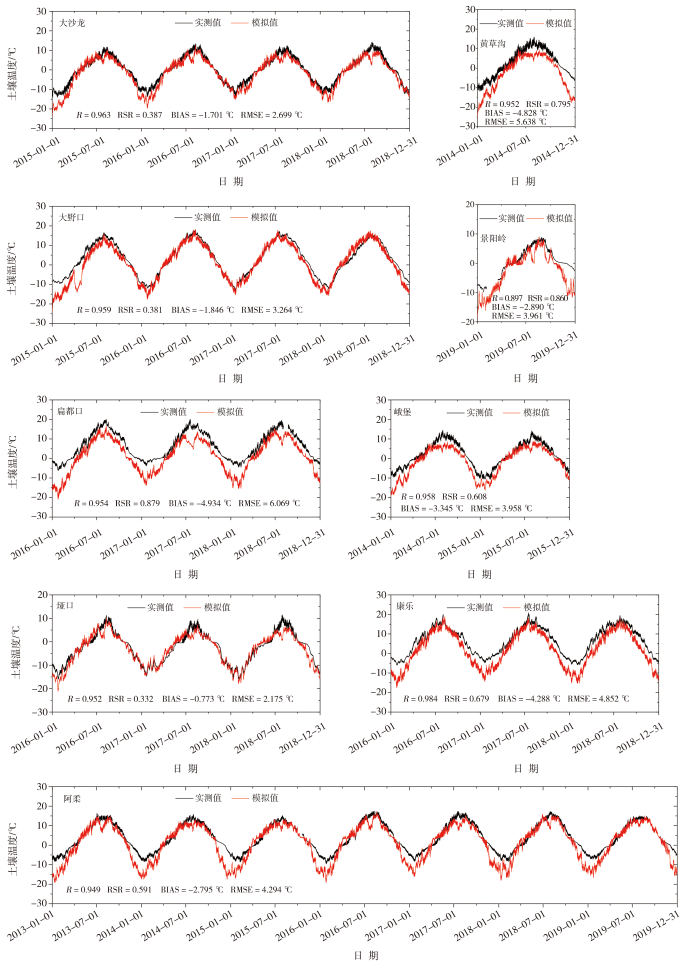
图2
黑河流域上游9个观测站土壤温度观测值与CLM 5.0模拟值对比
Fig.2
Comparison of observed soil temperature and CLM 5.0 simulated value at 9 observation stations in the upper reaches of the Heihe River Basin
2.2 土壤温度的分层模拟性能
图3为黑河上游9个观测站不同土壤层CLM 5.0模拟与实测土壤温度比较的泰勒图。可以看出,土壤温度在草地和高寒草甸上的模拟性能差异并不明显,但是草地的模拟性能较为接近,而高寒草甸的模拟性能则较为分散。整体上,高寒草甸的R值范围为0.897~0.963,草地的R值范围为0.952~0.984,且均通过0.01的显著性检验,说明CLM 5.0在两种植被下均能较好地模拟土壤温度。高寒草甸RSR值范围为0.332~0.860,平均值为0.542;草地的RSR值范围为0.381~0.879,平均值为0.663。由此可知,高寒草甸的RSR值略小于草地,CLM 5.0在高寒草甸的模拟精度略高于草地。高寒草甸的3个土壤层(第1层、第2层、第3层)RSR值范围分别为0.396~1.071、0.346~0.974和0.466~1.003,模拟精度基本一致;草地的3个土壤层RSR值范围分别为0.420~0.768、0.352~0.806和0.353~1.042,模拟精度逐渐变差。综上所述,CLM 5.0在高寒草甸的模拟精度略高于草地,随着土壤层的加深,草地模拟精度逐渐变差。
图3
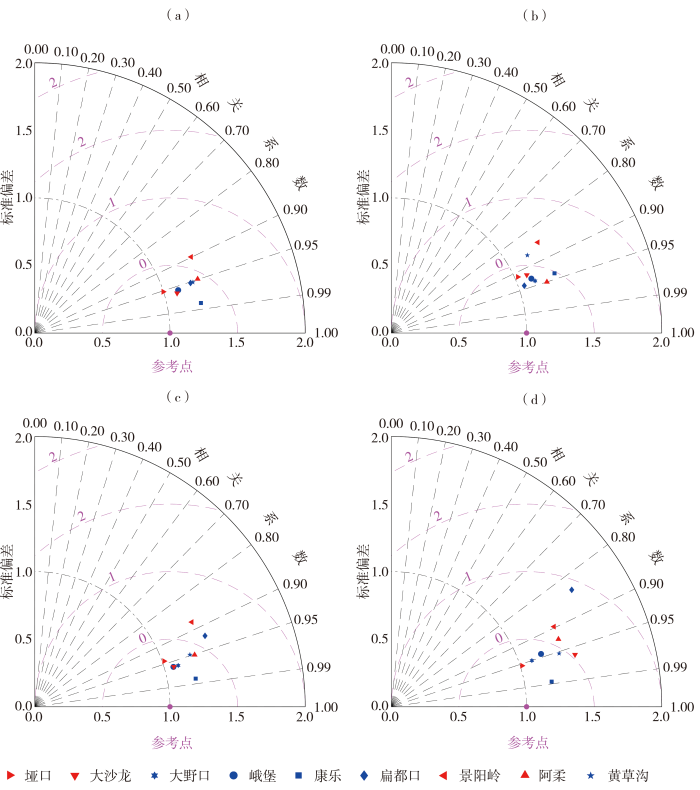
图3
黑河流域上游9个观测站不同土壤层CLM 5.0模拟与实测土壤温度对比的泰勒图
(红色站点、蓝色站点的植被类型分别为高寒草甸、草地)
(a)整层,(b)第1层,(c)第2层,(d)第3层
Fig.3
Taylor diagram of CLM 5.0 simulatied and observed soil temperature in different layers of 9 observation stations in the upper reaches of the Heihe River Basin
(The vegetation types of red stations and blue stations are alpine meadow and grassland respectively)
(a) the entire soil profile, (b) layer 1, (c) layer 2, (d) layer 3
3个土壤层(第1层、第2层、第3层)温度实测值和模拟值的R值分别为0.839~0.950、0.880~0.985和0.897~0.988,均通过0.01的显著性检验,表明CLM 5.0能够很好地模拟不同层次的土壤温度。各站点不同土壤层温度的模拟性能对比如图4所示。可以看出,除大沙龙站外,其他站点模拟土壤温度的平均偏差绝对值均随着土壤的加深而增大。康乐、大野口和大沙龙站的土壤温度模拟精度第2层最好,垭口站的模拟精度随着土壤层的加深逐渐变好,而其余站点模拟精度则随土壤的加深逐渐变差。为更清楚展示模式在各土壤层的模拟性能,计算各土壤层的平均RSR值,第1、2、3层分别是0.578、0.568、0.770,第1层和第2层的模拟精度相近,而第3层的模拟精度明显变差。因此,CLM 5.0模拟的土壤温度性能浅层优于深层。
图4
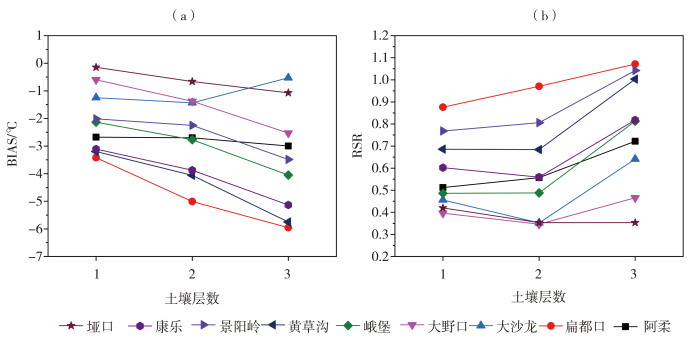
图4
黑河流域上游9个观测站不同土壤层土壤温度的模拟性能对比
(a)Bias,(b)RSR
Fig.4
Comparison of simulation performance of soil temperature in different layers at 9 observation stations in the upper reaches of the Heihe River Basin
(a) Bias,(b) RSR
2.3 生长季和非生长季土壤温度的模拟性能
表4列出黑河流域上游9个观测站生长季和非生长季CLM 5.0模拟土壤温度的评价指标。可以看出,生长季,土壤温度模拟值和实测值的R值为0.768~0.897,平均为0.814;非生长季的R值为0.834~0.963,平均为0.909,均通过0.01的显著性检验,表明CLM 5.0可以较好地模拟生长季和非生长季的土壤温度。生长季的RSR值为0.659~1.356,平均为0.937,Bias值为-0.719~-3.761 ℃,平均为-2.166 ℃;非生长季的RSR值为0.428~1.695,平均为1.083,Bias值为-0.811~-5.866 ℃,平均为-3.691 ℃。对比上述结果可知,模式在非生长季和生长季均能较好地模拟整层土壤温度,生长季的模拟精度优于非生长季,且生长季模拟偏差绝对值显著低于非生长季。因此,CLM 5.0模拟整层土壤温度的性能在生长季优于非生长季,非生长季的低估更明显。
表4 黑河流域上游9个观测站生长季和非生长季CLM 5.0模拟土壤温度的评价指标
Tab.4
| 站点 | 生长季 | 非生长季 | ||||||
|---|---|---|---|---|---|---|---|---|
| R | RSR | Bias/℃ | RMSE/℃ | R | RSR | Bias/℃ | RMSE/℃ | |
| 阿柔 | 0.863* | 0.659 | -1.412 | 2.203 | 0.893* | 1.310 | -3.733 | 5.258 |
| 扁都口 | 0.793* | 1.255 | -3.643 | 5.350 | 0.922* | 1.695 | -5.866 | 6.539 |
| 大沙龙 | 0.772* | 0.763 | -1.353 | 2.457 | 0.952* | 0.616 | -1.951 | 2.862 |
| 大野口 | 0.824* | 0.701 | -1.247 | 2.487 | 0.888* | 0.700 | -2.278 | 3.725 |
| 峨堡 | 0.834* | 1.104 | -3.043 | 3.592 | 0.952* | 0.950 | -3.554 | 4.191 |
| 黄草沟 | 0.800* | 1.356 | -3.761 | 4.211 | 0.926* | 1.428 | -5.598 | 6.476 |
| 景阳岭 | 0.768* | 0.926 | -1.897 | 2.691 | 0.834* | 1.358 | -3.791 | 4.813 |
| 康乐 | 0.897* | 0.998 | -2.421 | 2.792 | 0.963* | 1.260 | -5.635 | 5.908 |
| 垭口 | 0.777* | 0.674 | -0.719 | 2.433 | 0.935* | 0.428 | -0.811 | 1.969 |
注: *表示通过0.01的显著性检验。
2.4 冻结期和非冻结期土壤温度的模拟性能
冻融过程对土壤温度的影响显著,黑河上游土壤的冻融过程极为活跃(陈渤黎等, 2014b),因此评估了CLM 5.0在冻结期和非冻结期土壤温度的模拟性能(表5)。非冻结期各站点土壤温度模拟值和实测值的R值为0.655~0.967,平均为0.872;RSR值为0.514~0.984,平均为0.791;Bias值为-5.276~-1.231 ℃,平均为-2.493 ℃。冻结期各站点土壤温度模拟值和实测值的R值为0.755~0.947,平均为0.875;RSR值为0.416~4.392,平均为2.026;Bias值为-6.586~0.134 ℃,平均为-3.084 ℃。由此可知,CLM 5.0在两个时期均可以很好地模拟土壤温度,但非冻结期的模拟精度明显高于冻结期;CLM 5.0在两个时期均表现出了低估,且冻结期低估更明显。
表5 黑河流域上游9个观测站冻结期和非冻结期CLM 5.0模拟土壤温度的评价指标
Tab.5
| 站点 | 冻结期 | 非冻结期 | ||||||
|---|---|---|---|---|---|---|---|---|
| R | RSR | Bias/℃ | RMSE/℃ | R | RSR | Bias/℃ | RMSE/℃ | |
| 阿柔 | 0.832* | 1.830 | -4.891 | 6.027 | 0.905* | 0.514 | -1.378 | 2.603 |
| 扁都口 | 0.888* | 4.392 | -5.708 | 5.959 | 0.952* | 0.984 | -5.276 | 5.718 |
| 大沙龙 | 0.935* | 0.740 | -2.119 | 3.043 | 0.845* | 0.639 | -1.231 | 2.267 |
| 大野口 | 0.818* | 1.038 | 0.134 | 3.735 | 0.893* | 0.572 | -1.430 | 2.885 |
| 峨堡 | 0.947* | 1.850 | -4.348 | 5.126 | 0.901* | 0.854 | -2.740 | 3.275 |
| 黄草沟 | 0.869* | 2.091 | -6.356 | 7.152 | 0.902* | 0.946 | -3.502 | 3.950 |
| 景阳岭 | 0.755* | 1.585 | -3.919 | 5.175 | 0.831* | 0.965 | -2.151 | 2.761 |
| 康乐 | 0.887* | 4.293 | -6.586 | 6.783 | 0.967* | 0.757 | -3.385 | 3.822 |
| 垭口 | 0.943* | 0.416 | -0.445 | 1.942 | 0.655* | 0.888 | -1.340 | 2.565 |
注: *表示通过0.01的显著性检验。
3 讨论
3.1 评估的不确定性
本研究评估网格尺度的模式模拟土壤温度时采用的对比数据是点尺度的原位观测数据,尺度不匹配会导致评价结果存在一定的不确定性(李时越, 2018)。然而,相比于观测站的密度,观测站的代表性对评估结果的可靠性更为重要(Luo et al., 2017)。本文研究的9个观测站海拔为2 700~4 200 m,占黑河流域上游海拔高度范围的71.311%;9个观测站的植被类型以草地、草甸和森林为主,这3种植被类型占研究区总面积的85.821%;9个观测站的土壤类型以壤土、粉砂壤土、砂壤土为主,共占研究区总面积的89.856%。因而,本文选取的9个观测站具有代表性,同时,选用代表性站点评估模型性能是当前通用方法(夏坤等,2011; Du et al., 2013; Wang et al., 2016b)。因此,这9个观测站的评价结果基本可靠。
3.2 植被对土壤温度模拟性能的影响
3.3 模式参数对不同冻结状态下土壤温度模拟性能的影响
由表5可知,CLM 5.0土壤温度模拟结果在非冻结期和冻结期均出现了低估,且在冻结期低估更明显,这与前人研究(丁旭,2018;苏有琦等,2020)一致。针对该现象,尝试从模式构建机理的角度探讨产生偏差的原因。CLM 5.0在模拟土壤温度时,首先通过基础的热量平衡公式,确定每层的土壤温度,然后判断土壤层是否发生相变(Lawrence et al.,2020)。由于本文模拟结果的主要偏差来源于冻结期,那么在模拟土壤温度过程中必然要考虑相变,相变后的土层温度需重新计算。Lawrence等(2020)研究发现,土壤温度的低估来源于土壤热容量,表6列出9个观测站全年和冻结期土壤热容量与整层土壤温度模拟误差的相关系数。可以看出,全年土壤热容量与土壤温度模拟误差的相关系数为0.112~0.632,呈现显著正相关,说明土壤热容量是土壤温度模拟误差的关键参数;冻结期土壤温度模拟误差与土壤热容量的相关系数更高(0.210~0.817),说明土壤热容量对冻结期土壤温度模拟误差的影响更显著。因此,土壤热容量的估算偏差是导致冻结期土壤温度模拟偏低的主要因素。
表6 黑河流域上游9个观测站全年和冻结期土壤热容量与土壤温度模拟误差的相关系数
Tab.6
| 站点 | 全年 | 冻结期 |
|---|---|---|
| 阿柔 | 0.475* | 0.595* |
| 扁都口 | 0.463* | 0.544* |
| 大沙龙 | 0.229* | 0.503* |
| 大野口 | 0.179* | 0.210* |
| 峨堡 | 0.264* | 0.490* |
| 黄草沟 | 0.632* | 0.817* |
| 景阳岭 | 0.597* | 0.657* |
| 康乐 | 0.626* | 0.673* |
| 垭口 | 0.112* | 0.357* |
注: *表示通过0.01的显著性检验。
因此,土壤热容量的估算误差主要来自于土壤中冰和液态水模拟值的误差。由于CLM模式对冻结期液态水模拟性能较好(李时越等,2018),故而土壤热容量的估算误差来自土壤中冰的估算误差。
4 结论与展望
CLM 5.0是CLM模式的最新版本,本文选取高寒山区——黑河上游为研究区,以9个观测站的观测数据对其土壤温度模拟性能进行评估分析,为陆面过程模式的应用及改进提供科学依据。主要结论如下:
(1)CLM 5.0土壤温度模拟值和实测值的R值范围为0.897~0.984,RMSE值范围为2.175~6.069 ℃,RSR值范围为0.332~0.879,BIAS值范围为-4.934~-0.773 ℃。表明CLM 5.0可以很好地模拟土壤温度在高寒山区的年际变化,但模拟值相较实测值普遍存在低估。
(2)CLM 5.0在高寒草甸和草地的平均RSR值分别为0.542和0.663,表明CLM 5.0在高寒草甸的模拟精度略高于草地,因为相较于草地,高寒草甸植被覆盖度高,叶面积指数低,土壤温度变化波动小,变异性较弱。CLM 5.0在第1、2、3层土壤的平均RSR值分别是0.578、0.568和0.770,表明CLM 5.0土壤温度模拟性能在土壤浅层优于土壤深层。
(3)CLM 5.0各站点的模拟值和实测值在生长季和非生长季的BIAS平均值分别为-2.166 ℃和-3.691 ℃,表明CLM 5.0模拟土壤温度在生长季和非生长季均呈现低估,且在非生长季低估更明显。
(4)CLM 5.0在冻结期和非冻结期的土壤温度模拟值和实测值的BIAS平均值分别为-3.084 ℃和-2.493 ℃,表明CLM 5.0模拟土壤温度在两个时期均是低估的,且冻结期的模拟结果低估更明显。
(5)非生长季CLM 5.0对土壤温度的明显低估是由于冻结期土壤温度的明显低估引起的。CLM 5.0中土壤冰的估算误差导致参数土壤热容量出现估算偏差,进而导致模拟的土壤温度出现偏差。
通过以上研究可以发现,CLM 5.0模式能较好地模拟土壤温度的年际变化和年内变化,但冻结期存在明显低估。经过对模型机理分析,发现土壤热容量的估算偏差是导致冻结期土壤温度低估的主要原因,而土壤热容量的估算误差来自于土壤中冰的估算误差。由于目前野外仪器只能观测到液态水,故而土壤冰的模拟误差将在后续工作中进一步研究。另外,土壤中的无机盐、腐殖质等也可能对冻结期土壤温度的模拟产生较大的影响,有待今后进一步深入研究。
参考文献
中国东南地区土壤温度时空分布特征模拟研究
[C]//
基于CLM4.5模式的季节冻土区土壤参数化方案的模拟研究
[J].
利用位于季节冻土区的中国科学院那曲高寒气候环境观测研究站那曲/BJ观测点的野外观测数据, 通过CLM4.5的单点模拟实验, 分析评估了Luo土壤热导率参数化方案、 Johansen土壤热导率参数化方案、 C?té土壤热导率参数化方案和虚温参数化方案对土壤温、 湿度的模拟能力, 为将来选取最优的参数及参数化方案来更合理的模拟青藏高原土壤冻融过程为目的的工作提供依据。结果表明: (1)三种土壤热导率参数化方案模拟结果的土壤热传导率有明显差异, 其中C?té方案的土壤热传导率最高, Luo方案的土壤热传导率最低。(2)三种热传导率方案均能合理地模拟出土壤温湿度的日变化趋势, Johansen方案对土壤温度年变化趋势模拟的更好, C?té方案对土壤温度模拟的数值较观测值偏离的更小, Luo方案对土壤湿度的模拟更好。(3)加入虚拟温度方程, 并引入相变效率参数后, 减少了模式对土壤湿度模拟的负偏差, Y-L方案在保持土壤温度较好模拟能力的基础上, 能够进一步的提升土壤湿度的模拟能力。
CLM5.0对高寒山区蒸散发模拟的适用性评估
[J].蒸散发是地表水文循环和能量交换过程的重要组成部分,且在高寒山区有极强的时空异质性,准确模拟蒸散发对于研究高寒山区水文循环过程有着重要的意义。CLM5.0(Community Land Model 5.0)是CLM模式的最新版本,具有较为完善的水文循环机制,是目前国际上发展最为完善的陆面过程模式之一。基于典型高寒山区黑河上游五个观测站的观测数据,对CLM5.0的蒸散发模拟性能进行评估。结果表明:CLM5.0在模拟蒸散发时结果总体上可信,其R值的范围在0.601~0.839之间,RSR值的范围在0.964~1.145之间,BIAS值的范围在-1.220~-0.597 mm·d<sup>-1</sup>之间。说明CLM5.0在高寒山区可以较好地捕捉观测到蒸散发的时间趋势,但仍存在一定的低估。非生长季的BIAS值的范围在 -0.904~-0.367 mm·d<sup>-1</sup>之间,生长季的BIAS值的范围在-2.094~-0.794 mm·d<sup>-1</sup>之间,这表明蒸散发模拟值的低估主要来自生长季的模拟。高寒草甸上R值的范围在0.299~0.651之间,RSR值的范围在1.135~1.332之间,高寒草地上R值为0.209,RSR值为1.450,因此,CLM5.0在草甸的模拟性能优于草地。CLM5.0白天R值的范围在0.605~0.840之间,RSR值的范围在0.252~1.193之间,夜晚R值的范围在0.344~0.651之间,RSR值的范围在0.482~2.966之间,对比可知CLM5.0在白天模拟蒸散发的性能优于夜晚。这些结论可为CLM5.0的应用和改进提供科学依据。
祁连山区多年冻土空间分布模拟
[J].祁连山区位于青藏高原东北边缘,是亚洲水塔重要的组成部分,多年冻土的变化对生态系统和水资源平衡有着重要影响。基于青藏高原第二次综合科学考察、道路勘察钻孔点以及前人所获得的多年冻土下界资料,回归得出祁连山区多年冻土下界统计模型,借助ArcGIS平台在DEM数据的支持下,模拟出祁连山区多年冻土空间分布图。结果表明:祁连山区多年冻土分布的下界具有良好的地带性规律,表现为随经纬度增加而降低的规律;祁连山区多年冻土在空间分布上呈现出以哈拉湖为中心向四周扩散的分布格局;祁连山区总面积约为16.90×10<sup>4</sup> km<sup>2</sup>,其中多年冻土面积约为8.03×10<sup>4</sup> km<sup>2</sup>,占总面积约47.51%。多年冻土区与季节冻土区之间存在着有不连续多年冻土分布的过渡区,过渡区面积约1.43×10<sup>4</sup> km<sup>2</sup>,占总面积约8.46%。
不同草地类型WOFOST模型参数敏感性分析
[J].以C为驱动的WOFOST作物生长模型是基于作物生理生态过程,综合考虑了CO<sub>2</sub>、土壤、气候等因素对产量的胁迫作用,因此,对WOFOST模型参数进行本地化和优化便可实现时间连续且高精度的草地生物量监测。为探讨WOFOST参数敏感性分析结果在不同草地类型覆盖区表现出的不确定性问题,在天祝藏族自治县不同草地覆盖区选择了4个站点,利用气象数据、草地实测数据及土壤数据,基于扩展傅里叶幅度敏感性检验法(EFAST)研究潜在水平(指保证营养元素和水分为最佳供应,草地地上生物量仅由辐射、温度和作物特性决定)和水分限制水平(假设营养元素的供给仍然是最佳的, 但需考虑土壤有效水分对蒸发和草地生物量的影响)下WOFOST模型在不同草地类型覆盖区的全局敏感性参数和优化模型模拟精度。结果表明潜在生产水平下草地地上生物量(AGB)的敏感参数有比叶面积(SLATB)、单叶片CO<sub>2</sub>的初始光能利用率(EFFTB)、最大光合速率(AMAXTB)、根相对维持呼吸速率(RMR)、总干物质占根和叶的比例(FRTB和FLTB),水分限制条件下的敏感参数有SLATB、AMAXTB、RMR和FLTB。不同生产水平下叶面积指数(LAI)的敏感参数一致,从出苗到出苗后60 d主要受到SLATB、FLTB和FRTB的影响,出苗后60~200 d的敏感性参数为FLTB、FRTB、SLATB和漫射可见光的消光系数(KDIFTB),LAI开始下降后受到KDIFTB的敏感性增强。其中,山地草甸AGB的模拟值与观测值模拟精度最高,R<sup>2</sup>=0.94、RMSE=11.71 g·m<sup>-2</sup>,高寒草甸模拟精度最低,R<sup>2</sup>=0.83、RMSE=32.68 g·m<sup>-2</sup>。温性荒漠草原LAI的模拟值与观测值模拟精度最高,R<sup>2</sup>=0.96、RMSE=0.02,温性草原模拟精度最低,R<sup>2</sup>=0.66、RMSE=0.38。敏感性分析方法在WOFOST模型中的应用减少了人为主观因素的影响,极大地缩短了调参时间,对获取时间连续的草地生长监测方法选择提供参考。
青藏高原高寒湿地冻融过程土壤温湿变化特征
[J].青藏高原高寒湿地作为大江大河支流的发源地,其冻融过程对该地区及下游的生态系统和气候调节有重要意义。利用青藏高原腹地三江源区隆宝高寒湿地试验站的高时间分辨率土壤温湿数据,对冻融过程中土壤温湿的季节、日以及冻融转换期变化特征进行分析和探讨。结果表明:(1)高寒湿地土壤冻融过程中,土壤温度整体表现出夏高冬低的变化特征,冻结期5 cm、40 cm、20 cm、30 cm和10 cm地温依次增大,地温随深度变化存在一定的不规律性,而非冻结期则正好相反;土壤湿度在冻结期自上而下逐渐降低,融化期自上而下逐渐增加。(2)土壤表层5 cm和深层40 cm地温存在显著的日变化特征,表层较深层变化更显著,且夏季变化幅度最大;土壤含水率较稳定,除表层有一定波动,其他各层无明显日变化。(3)冻融转换期,土壤温度垂直分布存在显著的三层结构,10 cm和30 cm处与邻近层的温度差异是导致这种特殊分布的主要原因;随着深度的加深,土壤含水率冻结期(融化期)逐渐增加(减少),且深层比浅层的变化时间明显滞后。
面向陆面模拟的中国土壤数据集
[DB/OL].
基于BPNN 的一江两河流域水体中重金属浓度预测
[J/OL].
中国区域地面气象要素驱动数据集(1979-2018)
[DB/OL].
祁连山区域30 m人类活动参数产品数据集(V2.0, 2020)
[DB/OL].
黄土高原半干旱区2020年生长季草地土壤呼吸特征及其影响因素
[J].采用LI-8100A型土壤碳通量仪对黄土高原半干旱区草地生长季(5—10月)的土壤呼吸速率、土壤温度及含水量进行连续观测,综合分析土壤呼吸的时间变化规律,并研究环境因子对呼吸速率的影响。结果表明:(1)不同天气条件下土壤呼吸速率的日动态变化差异明显,晴天的日均值 (2.90 µmol·m<sup>-2</sup>·s<sup>-1</sup>)与变化范围(1.73~4.92 µmol·m<sup>-2</sup>·s<sup>-1</sup>)明显大于多云天和阴天。不同月份土壤呼吸速率的平均日变化均呈现“单峰型”结构,最高值(2.20~4.40 µmol·m<sup>-2</sup>·s<sup>-1</sup>)、最低值(0.71~1.70 µmol·m<sup>-2</sup>·s<sup>-1</sup>)分别出现在12:00或13:00、05:00或06:00,日均值接近于10:00或19:00的观测值。(2)白天和夜间土壤呼吸速率在5—6月处于较小值,从6月开始逐渐增大,8月达到峰值(白天3.31±0.98 µmol·m<sup>-2</sup>·s<sup>-1</sup>、夜间1.80±0.39 µmol·m<sup>-2</sup>·s<sup>-1</sup>),之后逐渐减小,10月出现最低值(白天1.55±0.55 µmol·m<sup>-2</sup>·s<sup>-1</sup>、夜间0.81±0.12 µmol·m<sup>-2</sup>·s<sup>-1</sup>),且白天通常高于夜间。整个生长季夜间土壤呼吸对全天总呼吸的贡献率为27.2%~32.4%。因此,在当前草地生态系统碳循环模型中应考虑夜间土壤呼吸的影响。(3)土壤温度是影响生长季土壤呼吸速率的主要环境因子,但土壤温度单变量模型不足以全面解释土壤呼吸的动态变化。结合土壤温度与含水量的双变量非线性模型能更好地拟合土壤呼吸速率,对其变异的解释程度达74.0%。(4)2020年生长季,全天、白天和夜间土壤呼吸的温度敏感性指数(Q<sub>10</sub>)变化范围分别为1.38~2.14、1.22~1.96和0.85~1.64,对应平均值分别为1.58±0.23、1.41±0.19和1.20±0.16。如果只用白天时段的Q<sub>10</sub>值代替日均值,将造成约10.8%的低估。
Estimation of ground heat flux from soil temperature over a bare soil
[J].
Physically accurate soil freeze-thaw processes in a global land surface scheme
[J].
Comparison of soil water and heat transfer modeling over the Tibetan Plateau using two Community Land Surface Model (CLM) versions
[J].
Impacts of land use and land cover changes on surface energy and water balance in the Heihe River Basin of China, 2000-2010
[J].
The Community Land Model and its climate statistics as a component of the community climate system model
[J].
Hydrological simulation by SWAT model with fixed and varied parameterization approaches under land use change
[J].
Effect of soil temperature on evapotranspiration by C3 and C4 grasses
[J].
Actual evapotranspiration of subalpine meadows in the Qilian Mountains, Northwest China
[J].As a main component in water balance, evapotranspiration (ET) is of great importance for water saving, especially in arid and semi-arid areas. In this study, the FAO (Food and Agriculture Organization) Penman-Monteith model was used to estimate the magnitude and temporal dynamics of reference evapotranspiration (ET0) in 2014 in subalpine meadows of the Qilian Mountains, Northwest China. Meanwhile, actual ET (ETc) was also investigated by the eddy covariance (EC) system. Results indicated that ETc estimated by the EC System was 583 mm, lower than ET0 (923 mm) estimated by the FAO Penman-Monteith model in 2014. Moreover, ET0 began to increase in March and reached the peak value in August and then declined in September, however, ETc began to increase from April and reached the peak value in July, and then declined in August. Total ETc and ET0 values during the growing season (from May to September) were 441 and 666 mm, respectively, which accounted for 75.73% of annual cumulative ETc and 72.34% of annual cumulative ET0, respectively. A crop coefficient (kc) was also estimated for calculating the ETc, and average value of kc during the growing season was 0.81 (ranging from 0.45 to 1.16). Air temperature (Ta), wind speed (u), net radiation (Rn) and soil temperature (Ts) at the depth of 5 cm and aboveground biomass were critical factors for affecting kc, furthermore, a daily empirical kc equation including these main driving factors was developed. Our result demonstrated that the ETc value estimated by the data of kc and ET0 was validated and consistent with the growing season data in 2015 and 2016.
Temperature extremes: effect on plant growth and development
[J].
The first high-resolution meteorological forcing dataset for land process studies over China
[J].The China Meteorological Forcing Dataset (CMFD) is the first high spatial-temporal resolution gridded near-surface meteorological dataset developed specifically for studies of land surface processes in China. The dataset was made through fusion of remote sensing products, reanalysis datasets and in-situ station data. Its record begins in January 1979 and is ongoing (currently up to December 2018) with a temporal resolution of three hours and a spatial resolution of 0.1°. Seven near-surface meteorological elements are provided in the CMFD, including 2-meter air temperature, surface pressure, and specific humidity, 10-meter wind speed, downward shortwave radiation, downward longwave radiation and precipitation rate. Validations against observations measured at independent stations show that the CMFD is of superior quality than the GLDAS (Global Land Data Assimilation System); this is because a larger number of stations are used to generate the CMFD than are utilised in the GLDAS. Due to its continuous temporal coverage and consistent quality, the CMFD is one of the most widely-used climate datasets for China.
Temperature and plant species control over litter decomposition in alaskan tundra
[J].
A daily soil temperature dataset and soil temperature climatology of the contiguous United States
[J].
The Community Land Model Version 5: description of new features, benchmarking, and impact of forcing uncertainty
[J].
CLM5.0 technical description
[EB/OL]. (
Heihe Watershed Allied Telemetry Experimental Research (HiWATER): scientific objectives and experimental design
[J].
Performance of WASMOD and SWAT on hydrological simulation in Yingluoxia watershed in northwest of China
[J].
The Heihe integrated observatory network: a basin-scale land surface processes observatory in China
[J].
Improving CLM4.5 simulations of land-atmosphere exchange during freeze-thaw processes on the Tibetan Plateau
[J].
Channel adjustments over 140 years in response to extreme floods and land-use change, Tammaro River, southern Italy
[J].
Model evaluation guidelines for systematic quantification of accuracy in watershed simulations
[J].
Evaluation of simulated soil moisture and temperature for a Canadian boreal forest
[J].
Modeling soil temperature in a temperate region: a comparison between empirical and physically based methods in SWAT
[J].
Investigating soil moisture-climate interactions in a changing climate: a review
[J].
A China data set of soil properties for land surface modeling
[J].
Assessing a dry surface layer-based soil resistance parameterization for the Community Land Model using GRACE and FLUXNET-MTE data
[J].
Land surface models systematically overestimate the intensity, duration and magnitude of seasonal-scale evaporative droughts
[J].
Modelling evapotranspiration during precipitation deficits: identifying critical processes in a land surface model
[J].
Impacts of land use/land cover on runoff and energy budgets in an East Asia ecosystem from remotely sensed data in a Community Land Model
[J].
Estimates of global surface hydrology and heat fluxes from the Community Land Model (CLM4.5) with four atmospheric forcing datasets
[J].
The simulation of LUCC based on Logistic-CA-Markov model in Qilian Mountain area, China
[J].
Exploring evapotranspiration changes in a typical endorheic basin through the integrated observatory network
[J].
Improved simulation of frozen-thawing process in Land Surface Model (CLM4.5)
[J].
Evaluation of soil thermal conductivity schemes incorporated into CLM5.0 in permafrost regions on the Tibetan Plateau
[J].
Multi-scale evaluation of the SMAP product using sparse in-situ network over a high mountainous eatershed, Northwest China
[J].
Hydrological impacts of land use change and climate variability in the headwater region of the Heihe River Basin, Northwest China
[J].
Empirical estimation of soil temperature and its controlling factors in Australia: Implication for interaction between geographic setting and air temperature
[J].
Long time series high-quality and high-consistency land cover mapping based on machine learning method at Heihe River Basin
[J].Long time series of land cover changes (LCCs) are critical in the analysis of long-term climate, environmental, and ecological changes. Although several moderate to fine resolution global land cover datasets have been publicly released and they show strong consistency at the global scale, they have large deviations at the regional scale; furthermore, high-quality land cover datasets from before 2000 are not available and the classification consistency among different datasets is not very good. Thus, long time series of land cover datasets with high quality and consistency are in great demand but they are still unavailable, even at the regional scale. The Landsat series of satellite imagery composed of eight successive satellites can be traced back to 1972 and it is, therefore, possible to produce a long time series land cover dataset. In addition, the newly available satellite data have the capability to construct time series satellite images and a time series analysis method such as LCMM can be employed for making high-quality land cover datasets. Therefore, by taking the advantages of the two categories of satellite data, we proposed a new time series land cover mapping method based on machine learning and it, thereafter, is applied to Heihe River Basin (HRB) for verification purposes. Firstly, the high-quality land cover datasets at HRB from 2011–2015, which were retrieved using the LCMM method, are used for quickly and accurately making training samples. Secondly, a strategy for transferring the training samples after 2011 to earlier years is established. Thirdly, the random forest model is employed to train the selected yearly samples and a land cover map for every year is subsequently made. Finally, comprehensive analysis and validation are carried out for evaluation. In this study, a long time series land cover dataset including 1986, 1990, 1995, 2000, 2005, 2010, 2011, 2012, 2013, 2014, and 2015 is finally made and an average precision of about 90% is achieved. It is the longest time series land cover map with 30 m resolution at HRB and the dataset has good time continuity and stability.

