

引言
呼吸系统疾病是门诊住院中常见且多发的疾病,对人们的日常生活影响很大,且呼吸系统疾病患病与气象要素变化存在密切联系(李瑞盈等,2019;张莹等,2014;张智等,2015;张智和崔巍,2017),其中气温对呼吸系统疾病的影响最大(付桂琴等,2017;徐静等,2021;Fu et al., 2018;Mäkinen et al., 2009;Wang et al., 2013);特别是气温的急剧变化会刺激呼吸系统,从而导致呼吸系统疾病患病风险增加。国外研究表明,纽约地区日平均气温为29.0~36.0 ℃时,每升高1.0 ℃,呼吸系统疾病当日住院人数会增加2.7%~3.1%(Lin et al., 2009);在越南境内,热浪对当日呼吸系统疾病住院的相对风险(relative risk, RR)为1.3(95%置信区间为1.19~1.42)(Dang et al., 2019)。近年来,国内各地关于气温对呼吸系统疾病的影响研究也表明,安徽阜南县的呼吸系统住院人数更易受低温影响,高温影响不显著(赵笑颜,2018);遵义地区低温对呼吸系统疾病有明显的滞后效应,在敏感阈值范围内(17.1 ℃以下)日平均气温每变化1.0 ℃,患病人数将增加31.6%(95%置信区间为4.4%~65.8%)(乐满等,2018);由此可见,不同日平均气温段导致呼吸系统患病的风险不同。北京的一项研究表明,虽然极端低温寒潮对诱发呼吸系统疾病当天的相对风险最高,但累积相对风险却不是最高;而中等强度的寒潮由于发生频次较高,其对呼吸系统疾病的累积风险最高;热浪对呼吸系统疾病的相对风险随着气温升高而增加(Song et al., 2018)。此外,气温对性别以及各年龄段人群的影响也不相同,在兰州地区,女性比男性更容易受低温影响,而6~14岁少年儿童对高温和低温的影响更敏感(Chai et al., 2020)。在香港地区,老年人更容易受气温的影响,老年人群的肺炎住院病例中,10.7%的病例与气温变化密切相关,其中有8.7%和2.0%的病例分别归因于低温和高温,且大多数的老年人肺炎入院病例归因于中度寒冷的天气(Qiu et al., 2016)。
综上所述,尽管气温与呼吸系统疾病之间的关系已有诸多研究,但由于我国地域辽阔,地形复杂,南北气候差异较大,其研究工作的覆盖面仍有局限性。特别是东北地区属于我国四季气温变化最大的地区,也是冬季气温最低的地区,气温对当地居民健康的影响也比国内其他地区更明显,但目前东北地区关于此方面的研究还较少。此外,目前国内大多数研究侧重于极端气温对人体健康的影响,忽略了中度气温对人体健康的潜在影响,且对各气温段所导致的患病风险评估还不够全面。基于此,本文利用2016—2018年辽宁省北票市和西丰县两县域城市的逐日气象观测资料和呼吸系统疾病住院病例资料,着重研究气温对北票市和西丰县两地居民呼吸系统疾病的影响,拟采用相对风险(RR)和归因分值(Attributable Fraction, AF)两种指标,探究呼吸系统疾病患病的气象环境诱因,试图探明性别、年龄分层的呼吸系统疾病住院人数对气温的响应关系,以期为当地恰当进行疾病预防、合理开展气候康养提供科学依据。
1 资料与方法
1.1 研究区概况
北票市归属于辽宁省朝阳市,北有努鲁儿虎山脉,南有松岭山脉,属于北温带大陆性季风气候区,是东北老工业基地的重要组成部分(北票市史志办公室,2018)。而西丰县地处铁岭市东部丘陵地带,地势由东向西逐渐降低,同属于北温带大陆性季风气候区,冬季寒冷干燥、夏季温热多雨。两地冬季气温较低,并伴有干旱、寒潮等极端事件,虽然两地距渤海较近,但由于南部山脉的阻隔,受海洋暖湿空气影响较小,所以降雨量偏少,空气中颗粒物不易沉降扩散,大气污染物和气象要素共同影响呼吸系统疾病。
1.2 资料
疾病数据:辽宁省朝阳市北票市和铁岭市西丰县2016年1月1日至2018年12月31日的呼吸系统疾病逐日住院人数资料。北票市疾病数据来自当地具有呼吸科专长的某二甲医院,该医院离矿区较近,故住院男性患者明显多于女性患者,该医院接收呼吸系统疾病住院人数占当地的50.0%以上;而西丰县疾病数据来自当地位列前茅的二甲医院,其呼吸系统疾病住院人数约占当地60.0%左右。两所医院覆盖人群包含县域内的城市和农村人群,具有较好的代表性。根据国际疾病分类标准第10版(ICD-10)(卫生部卫生统计信息中心,2001),通过编码筛选呼吸系统疾病,其中包括上呼吸道疾病(J00-J06)、下呼吸道疾病(J45-J47,J85-J86)、流行性感冒(J09-J11)、肺炎(J12-J22)、支气管炎(J40,J42)、慢性阻塞性疾病(J43,J44)、外部物质引起的肺部疾病(J60-J70),并把癌症等病例剔除,两县域分别筛选出呼吸系统病例资料12 948、13 528例,病例信息具体包括入院日期、出院日期、诊断、性别、年龄和实际住院日数等。
气象和污染数据:来源于辽宁省气象局气象信息中心提供的北票市和西丰县2016年1月1日至2018年12月31日逐日气象观测资料,包括日平均气温、气压、相对湿度、风速等气象要素;从空气质量在线监测分析平台(https://www.aqistudy.cn)获取2016年1月1日至2018年12月31日的污染数据,包括空气动力学直径小于2.5 μm颗粒物(PM2.5)、二氧化硫(SO2)、二氧化氮(NO2)等逐日数据。为确保数据准确性,疾病资料剔除了性别、年龄信息不全的病例以及入院诊断与出院诊断不一致的病例。
1.3 研究方法
广义相加模型(Generalized Additive Model,GAM)适用于分析因变量与若干解释变量之间复杂的非线性关系,在环境气象与健康领域得到广泛应用(陈蕾等,2021;李俊林等,2022)。解释变量可通过各种平滑函数(自然立方样条函数ns、B样条函数bs、多项式函数ploy)拟合,以此定量表征各解释变量对因变量的影响程度。由于特定暴露事件的影响并不局限于观察到的时间段,可能还会有一定的滞后性。所以引入Gasparrini等(2010)提出的分布滞后非线性模型(the Distributed Lag Non-linear Model, DLNM)来模拟暴露事件与一系列未来结果之间的关系。分布滞后非线性模型中“交叉基”的构建提供了暴露-反应关系的额外滞后时间维度,即预测与滞后效应两个函数组合成一个二维矩阵,来反映暴露事件及其滞后效应对健康的影响。本文通过GAM和DLNM的结合,并使用近似Poisson分布估计气象要素与呼吸系统住院人群之间的特定联系。选出每日住院人数与气象要素的Spearman相关系数较好且显著的要素作为解释变量加入模型。基本模型框架如下:
式中:E(Yt)表示第t天呼吸系统疾病的住院人数;basis.T表示气温的交叉基,其中暴露-反应曲线用二次B样条函数,其中3个内部节点分别是气温分布的第10、75、90个百分位数;用三次多项式函数构造其滞后效应,最大滞后日数设置为15 d;ns为自然立方样条函数,长期时间趋势的自由度设置为7,气象要素的自由度设置为3,以上参数的选择与设置基于以往对呼吸系统疾病的研究(Chai et al., 2020; Ma et al., 2019;Zhao et al., 2019)。其中RH(%)、V(m·s-1)、P(hPa)分别表示相对湿度、风速、气压。并选择3种污染物变量,分别为SO2、NO2、PM2.5。为了去除节假日、星期效应,还引入了哑变量holiday、dow,公共节假日的holiday为1,否则为0;dow为星期数(1~7);α为残差项。以上模型以赤池信息准则(the Akaike Information Criterion,AIC)检验模型优度(Akaike, 1974),调整时间序列的自由度和交叉基中的平滑函数以及滞后结点。根据奥卡姆剃刀定律(Stone, 1981),选择其中AIC相对较低且包含自由度较少的模型。通过改变模型的最大滞后日数(由最初的15 d增加到21 d)来检验模型的稳定性,以证明15 d作为最大滞后时间是合理的。
结合各年龄段呼吸系统住院的患病人数以及历史研究对年龄段的划分(马盼等,2018),将呼吸系统住院人数的年龄分为3个年龄段,分别为少儿组(0~14岁)、中青年组(15~59岁)、老年组(≥60岁)。
本文利用相对风险(RR)和归因分值(AF)量化气温所导致的患病风险,其中RR指暴露在某种条件下患病的风险,即群体在某暴露条件下的患病率与非暴露条件下的患病率之比。RR=1.0时,暴露条件对疾病无影响;RR>1.0时,表示会增加患病人数;RR<1.0时,则会减少患病人数。RR及其95%的置信区间(简称“95%CI”)计算公式(马盼等,2018)如下:
式中:β是模型估算的暴露-反应关系系数;dt(℃)是气温的变化量;SE为模型估算的气温标准误差。
在总体累积暴露反应曲线中,最适宜气温Ts(℃)定义为气温的第1个和第99个百分位数之间的最小累积相对风险所对应的气温。并将此最适宜气温设置为模型的参考气温,重新拟合暴露滞后反应关系,以此来计算归因分值(AF),进一步探究气温对患病风险的贡献。并将日平均气温(T)划分为4个气温段,即极端低温(T<T2.5)、中度低温(T2.5≤T<Ts)、中度高温(Ts<T≤T97.5)、极端高温(T>T97.5),其中T2.5、T97.5(℃)分别为日平均气温分布的第2.5、97.5个百分位数,分别计算不同温度段的AF,分析各层次气温对呼吸系统疾病患病的贡献(Gasparrini et al., 2015)。最后通过蒙特卡罗模拟的5000个样本计算95%CI,估计归因分值的分布范围(Gasparrini et al., 2014)。
归因分值AF也称归因危险度百分比,是指暴露人群中的患病归因于暴露的部分占全部患病的百分比。本文使用后向归因分值,表示假设t时刻的风险可归因于过去一段时间内的各种暴露事件(Gasparrini et al., 2015)。AF的计算公式如下:
式中:t为时间,x为事件;AN为某人群在过去一段时间内暴露在事件下所产生的患病人数;AF(%)为归因分值,具体表征该患病人数在总患病人数中的占比;
2 结果与讨论
2.1 气象要素与呼吸系统住院人数的描述性统计
表1 2016—2018年辽宁省北票市及西丰县不同气象要素及污染要素统计特征
Tab.1
| 地区 | 统计量 | 气象要素 | 污染要素/(µg·m-3) | |||||
|---|---|---|---|---|---|---|---|---|
| 平均气温/℃ | 气压/hPa | 平均相对湿度/% | 平均风速/(m·s-1) | PM2.5 | SO2 | NO2 | ||
| 北票 | 9.5 | 1 016.7 | 50.3 | 3.2 | 38.4 | 30.0 | 22.3 | |
| s | 12.8 | 10.4 | 20.1 | 1.3 | 29.6 | 26.8 | 9.4 | |
| Pmin | -21.9 | 992.9 | 8.5 | 0.7 | 0.0 | 4.0 | 6.0 | |
| P2.5 | -13.6 | 999.7 | 18.8 | 1.2 | 7.0 | 6.0 | 9.0 | |
| P50.0 | 11.4 | 1 016.2 | 46.8 | 3.0 | 30.0 | 20.0 | 20.0 | |
| P97.5 | 27.9 | 1 036.6 | 89.0 | 6.1 | 124.6 | 105.6 | 45.0 | |
| Pmax | 32.0 | 1 045.2 | 98.8 | 7.5 | 219.0 | 190.0 | 58.0 | |
| 西丰 | 5.8 | 1 016.6 | 68.4 | 2.2 | 45.2 | 19.0 | 29.8 | |
| s | 14.7 | 10.1 | 14.3 | 0.9 | 32.4 | 13.6 | 11.7 | |
| Pmin | -30.4 | 984.5 | 19.3 | 0.6 | 0.0 | 3.0 | 6.0 | |
| P2.5 | -21.8 | 999.8 | 36.1 | 1.0 | 8.0 | 5.0 | 13.0 | |
| P50.0 | 7.5 | 1 016.1 | 69.5 | 2.0 | 36.0 | 15.0 | 28.0 | |
| P97.5 | 26.9 | 1 035.6 | 93.0 | 4.4 | 133.0 | 55.6 | 56.0 | |
| Pmax | 30.5 | 1 045.1 | 99.0 | 6.0 | 250.0 | 91.0 | 79.0 | |
注:
表2 2016—2018年辽宁省北票市及西丰县呼吸系统疾病住院人数统计特征
Tab.2
| 地区 | 统计量 | 不同人群 | 不同年龄段 | ||||
|---|---|---|---|---|---|---|---|
| 总数 | 男性 | 女性 | <15岁 | 15~59岁 | ≥60岁 | ||
| 北票 | 116.9 | 82.6 | 34.2 | 35.6 | 11.1 | 70.2 | |
| s | 35.4 | 24.1 | 13.9 | 16.9 | 4.5 | 23.3 | |
| Pmin | 0.0 | 0.0 | 0.0 | 0.0 | 0.0 | 0.0 | |
| P2.5 | 63.4 | 39.4 | 16.4 | 13.0 | 4.0 | 33.4 | |
| P50.0 | 110.0 | 81.0 | 31.0 | 31.0 | 10.0 | 67.0 | |
| P97.5 | 199.6 | 137.0 | 70.0 | 74.0 | 22.6 | 126.6 | |
| Pmax | 237.0 | 158.0 | 83.0 | 99.0 | 26.0 | 150.0 | |
| 西丰 | 62.0 | 32.0 | 30.0 | 22.2 | 9.3 | 30.6 | |
| s | 22.2 | 11.4 | 12.2 | 13.1 | 4.0 | 11.7 | |
| Pmin | 0.0 | 0.0 | 0.0 | 0.0 | 0.0 | 0.0 | |
| P2.5 | 27.4 | 14.4 | 11.0 | 4.0 | 1.0 | 13.0 | |
| P50.0 | 58.0 | 30.0 | 28.0 | 20.0 | 9.0 | 29.0 | |
| P97.5 | 111.6 | 59.6 | 56.0 | 56.0 | 17.0 | 56.0 | |
| Pmax | 131.0 | 75.0 | 72.0 | 69.0 | 22.0 | 89.0 | |
西丰县日平均气温较低为5.8 ℃,日平均相对湿度接近70.0%,日平均风速较低(2.2 m·s-1)。西丰县呼吸系统疾病日平均住院人数为62.0人,性别比(男:女)为1.1:1.0,住院人数年龄在小于15岁、15~59岁和≥60岁的比重分别为35.7%、15.0%和49.3%。
2.2 呼吸系统住院人数的分布特征
考虑到环境要素对不同年龄段人群的影响存在差异,故对研究期间各年龄段呼吸系统住院人数进行统计分析。由图1可见,两城市不同年龄段呼吸系统疾病住院人数分布类似,2016—2018年呼吸系统住院人数在0~14岁的少儿人群中达到峰值,并随年龄增大逐渐减小;在15~59岁,住院人数分布相对较少;60岁之后,住院人数逐渐增加,北票市和西丰县分别在80岁、65岁左右达到第二个峰值,说明西丰县老年人群患病高峰提前,这可能与西丰县日平均气温比北票市更低有关。由此可见,少年儿童与老年人群是呼吸系统易感人群,需提前注意对呼吸系统疾病的预防。
图1
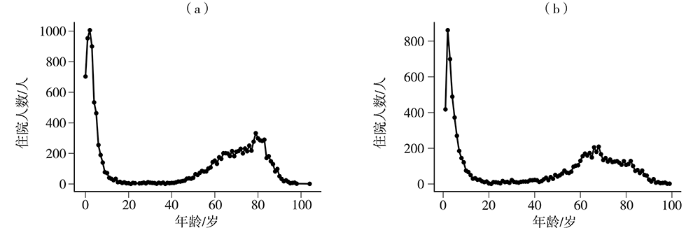
图1
2016—2018年辽宁省北票市(a)和西丰县(b)不同年龄段呼吸系统疾病住院人数分布
Fig.1
The distribution of inpatients with respiratory diseases in different ages in Beipiao (a) and Xifeng (b) of Liaoning Province from 2016 to 2018
图2为2016—2018年辽宁省北票市和西丰县按性别、年龄划分的呼吸系统疾病住院人数月际变化。可以看出,两城市住院人数的月际变化基本呈“U”型,即冬季最多、春季次之、夏季最少。性别与年龄划分的年内变化趋势与总住院人数保持一致,北票市的男性患者在各月份均多于女性患者。而在年龄分组上,两地各月基本上老年组患者居多、少儿组次之、中青年组最少。与北票市不同的是,西丰县3、4月的住院人数比1、2月高,可能因为2016年3月底西丰县出现5~6级大风,而且西丰地区春季冷暖气团交替频繁,气温变化较大,故导致呼吸系统住院人数增加。
图2
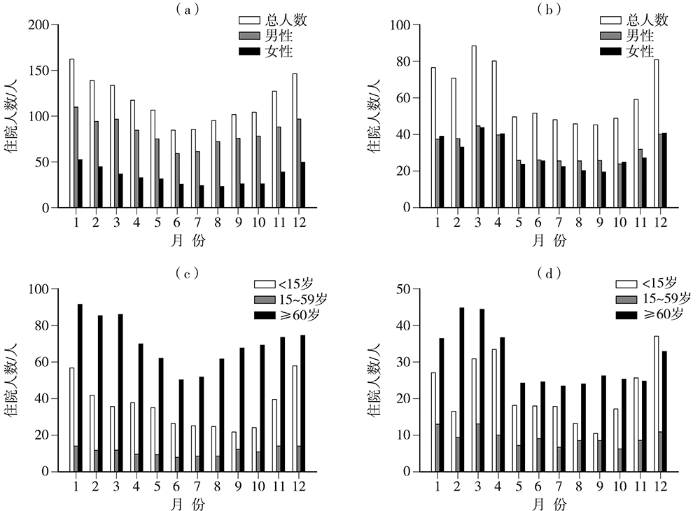
图2
2016—2018年辽宁省北票市(a、c)和西丰县(b、d)按性别(a、b)、年龄(c、d)划分的呼吸系统疾病住院人数月际变化
Fig.2
Monthly variation of inpatients with respiratory diseases by gender (a, b) and age (c, d) in Beipiao (a, c) and Xifeng (b, d) of Liaoning Province from 2016 to 2018
表3 2016—2018年北票市和西丰县不同季节呼吸系统疾病住院人数统计
Tab.3
| 地区 | 季节 | 日数/d | 日数占全年 百分比% | 住院人数/人 | |||||
|---|---|---|---|---|---|---|---|---|---|
| 总人数 | 男性 | 女性 | <15岁 | 15~59岁 | ≥60岁 | ||||
| 北票市 | 春季 | 79 | 21.6 | 106.0 | 74.9 | 31.0 | 34.8 | 9.1 | 62.1 |
| 夏季 | 71 | 19.4 | 88.9 | 65.1 | 23.9 | 25.2 | 8.4 | 55.3 | |
| 秋季 | 57 | 15.6 | 101.3 | 76.2 | 25.0 | 22.3 | 11.1 | 67.9 | |
| 冬季 | 159 | 43.4 | 139.9 | 96.3 | 43.6 | 45.0 | 13.3 | 81.6 | |
| 西丰县 | 春季 | 68 | 18.6 | 54.4 | 27.8 | 26.7 | 20.4 | 8.0 | 26.1 |
| 夏季 | 53 | 14.5 | 48.1 | 25.8 | 22.3 | 17.3 | 7.1 | 23.7 | |
| 秋季 | 47 | 12.8 | 44.4 | 25.2 | 19.2 | 10.2 | 8.8 | 25.5 | |
| 冬季 | 198 | 54.1 | 72.6 | 36.8 | 35.9 | 27.0 | 10.5 | 35.2 | |
2.3 气温对呼吸系统疾病的滞后及累积效应
考虑到气温对疾病存在一定的滞后效应,设置最大滞后日数为15 d,并取气温分布的第2.5(-13.5 ℃)、97.5(27.5 ℃)个百分位数(分别简称“低温点”、“高温点”)讨论冷效应与热效应。图3为两城市高低温点对呼吸系统疾病患病的滞后效应曲线,可见北票市低温对疾病的影响有明显滞后效应,其效应可持续15 d左右,而热效应不明显。西丰县低温点也存在明显的滞后效应,而高温表现出即时性,其效应可持续4 d左右,高温点滞后4 d以后相对风险的显著区间较宽,其原因可能是在研究期间高温天数略少。总体上,两地冷效应对呼吸疾病的影响具明显的滞后性,热效应有即时性,但不显著,这与很多国内外的研究结果一致(赵笑颜,2018; Breitner et al., 2014; Guo et al., 2011; Yi et al., 2015)。
图3
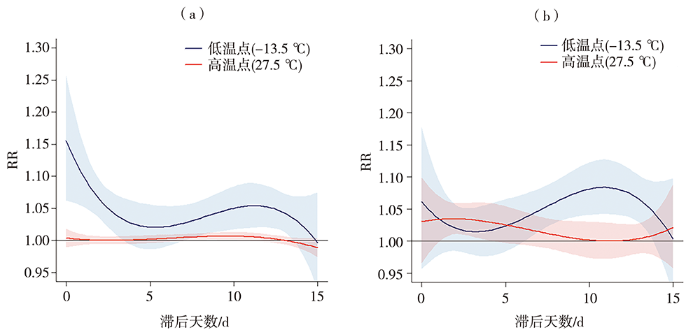
图3
北票市(a)和西丰县(b)低温点和高温点对呼吸系统疾病患病的滞后效应
(彩色填色区代
Fig.3
The lag effect of the low temperature and the high temperature on the incidence of respiratory diseases in Beipiao (a) and Xifeng (b) of Liaoning Province
(The color shaded areas represent the 95% confidence interval)
图4为北票市和西丰县气温滞后15 d对呼吸系统疾病总人群的累积影响。通过模型估算北票市总人群的最适宜气温为26.2 ℃,而西丰县总人群的最适宜气温为22.2 ℃,以最适宜气温作为模型的参考气温,并以此作为冷热效应的分界点。并分别探究各气温段(极端低温、中度低温、中度高温和极端高温)的气温对疾病的影响。两地气温对疾病的累积曲线相似,都呈不规则“N”型分布。即当气温大于最适宜气温时,患病风险会随着气温的升高而增加;而当气温小于最适宜气温时,患病风险会随着气温的降低而增加,北票市和西丰县患病风险峰值分别在-10.0、-14.0 ℃左右,累积RR分别高达2.1(95%CI:1.7~2.3)、2.0(95%CI:1.6~2.4),之后患病风险随气温降低而逐渐减小。分析在极端低温段累积RR会如此变化的成因:首先,因为室外气温越低,人们外出活动越少,且冬季北方室内有供暖,人们久居室内,从而使累积RR逐渐降低;其次,发现累积RR峰值对应的气温范围主要位于换季时期,24 h变温较大,人们不适应气温骤降而导致患病风险增加。总体上,与其他气温段相比,暴露在中度低温段下的患病风险较高,虽然极端高温段也存在一定程度的患病风险,但其置信区间较宽。
图4

图4
北票市(a)和西丰县(b)气温累积滞后15 d对呼吸系统疾病总人群的累积影响和不同气温的发生次数
(两侧虚线分别为气温分布的2.5%和97.5%分位数,而中部虚线为最适宜气温,蓝色、红色曲线分别代表冷效应、热效应的暴露曲线,灰色区域为其95%的置信区间。下同)
Fig.4
Cumulative effect of 15 days temperature lag on the total population of respiratory diseases and occurrence times of different temperature in Beipiao (a) and Xifeng (b) of Liaoning Province
(The dotted lines on both sides are 2.5% and 97.5% quantiles of temperature distribution, respectively, while the middle dotted line is the optimal temperature, blue and red curves represent exposure curves of cold effect and hot effect respectively, and the grey area represents the 95% confidence interval. the same as below)
2.4 气温对各年龄段疾病人群的影响
考虑到气温对各年龄段及不同性别人群的影响可能会有差异,故探究北票市和西丰县平均气温滞后15 d对呼吸系统疾病性别、年龄分层的总体累积影响。由图5可知,就年龄分层而言,北票市少儿组的最适宜气温为22.0 ℃。高低温对少儿人群的患病都有明显影响,其中中度低温段的患病风险最大[在-10.1 ℃的累积RR峰值可达3.2(95%CI:2.5~3.6)],且中度低温段对少儿人群的影响在各年龄段中最显著。在极端高温段相对风险随气温的升高而升高[在最高气温32.0 ℃时的累积RR为2.2(95%CI:1.1~4.0)],且通过α=0.05的显著性检验,说明处于极端高温下也会使少儿人群患病风险增加。中青年组的最适宜气温为24.7 ℃,在低温段中,中青年组的患病风险随气温降低略有增加[在极端低温段累积RR最大为1.4(95%CI:0.8~2.6)],而高温对中青年组的影响并不显著(RR<1.0)。老年组的最适宜气温为26.1 ℃,高低温对老年组都有明显影响,且对低温较为敏感(在极端低温段累积RR最大为1.7(95%CI:1.2~2.6)。就性别划分而言,男性的最适宜气温为25.3 ℃,女性的最适宜气温为26.8 ℃。男女人群累积RR分布相似,均呈现“N”型分布,在中度低温段累积RR最大分别为1.5(95%CI:1.3~1.7)、1.8(95%CI:1.4~2.3)。
图5
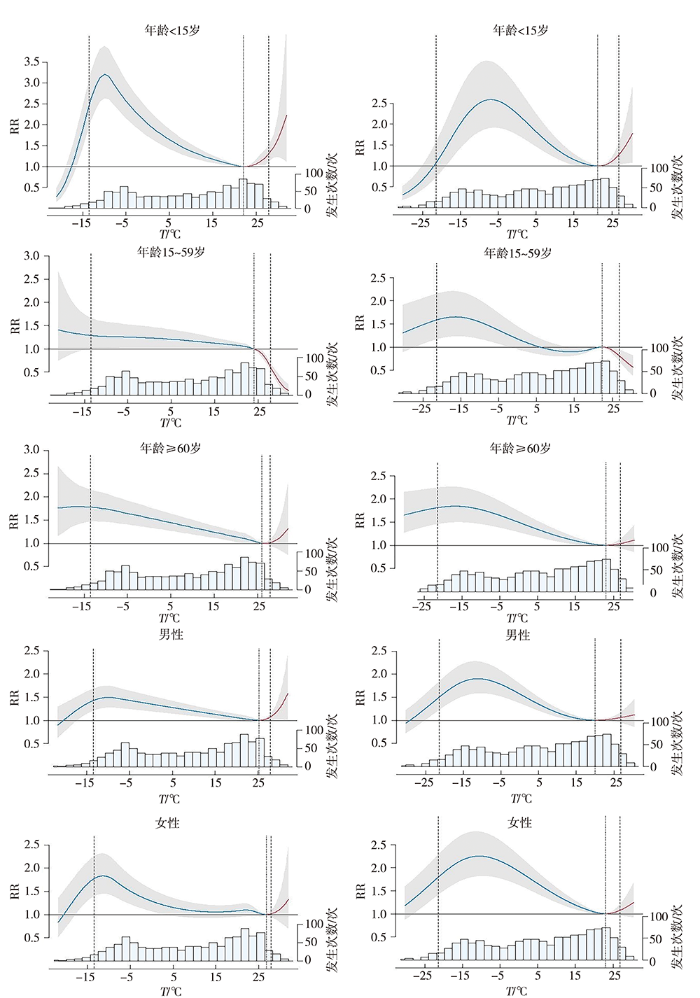
图5
北票市(左)和西丰县(右)平均气温累积滞后15 d对呼吸系统疾病性别、年龄分层的总体累积影响和不同气温的发生次数
Fig.5
Cumulative effect of 15 d lag of mean temperature on respiratory diseases in different gender and age groups and occurrence times of different temperature in Beipiao (the left) and Xifeng (the righ) of Liaoning Province
西丰县少儿组、 中青年组、 老年组、 男性、 女性患者的最适宜气温分别为21.3、 22.3、 23.0、 20.0、 23.0 ℃, 在中度低温段的累积RR峰值分别为2.5(95%CI: 1.9~3.5) 、1.6(95%CI: 1.2~2.2) 、1.8(95%CI: 1.5~2.2)、 1.9(95%CI: 1.5~2.2)、 2.3(95%CI: 1.7~2.6)。 西丰与北票在各分组中的累积RR的总体分布特征十分相似。 综上所述, 两地少儿人群对中度低温段和极端高温段的响应最明显, 尤其中度低温段对患病的影响更大。 而相比中青年组, 老年组对低温更敏感, 高气温段对这两个群体均无明显影响。 两地的男女患者受影响类似, 都对中度低温较为敏感, 且对女性的影响略大于男性。
2.5 气温对呼吸系统疾病的归因风险
表4 列出两地由于特定气温范围导致的呼吸系统疾病住院人数的归因分值及其95%CI。 对于北票市总人群来说, 有27.0% (95%CI:20.3%~32.9%) 的人群患呼吸系统疾病是归因于气温, 其中25.9% (95%CI:19.5%~31.5%) 归因于中度低温, 而归因于极端低温的住院人数只占1.5% (95%CI:0.9%~2.0%) 。 此外, 由于中度高温和极端高温而引起的呼吸系患病风险很小, 且未通过显著性检验。 由性别、 年龄分层的归因风险不相同, 其中少儿、 中青年、 老年、 男性、 女性患者分别有34.3% (95%CI: 28.7%~39.3%) 、 13.7% (95%CI: 2.8%~22.8%) 、 24.2% (95%CI: 16.2%~31.2%) 、 16.7% (95%CI: 9.6%~23.1%) 、 18.1% (95%CI: 6.3%~28.2%) 是由于中度低温而引起的疾病。 显而易见, 少儿人群和老年人群对低温更加敏感。 这是因为少儿人群的免疫系统尚未发育完全, 抵抗力较差, 在低温的环境下更容易患病; 而老年人则是因为身体功能和抵抗力随着年龄的增长而逐渐下降, 自身的体温调节系统也比年轻人差, 导致他们对异常气候的适应能力减弱。 不同年龄段人群对环境的适应能力不同, 故应该根据不同人群制定相应的防护措施。 此外, 老年组与女性患者对极端低温也较敏感, 女性比男性更容易受低温的影响。 西丰县分析结果与北票市类似, 不同的是, 中度低温对西丰中青年组的影响并不显著; 相比北票市女性患者, 西丰县有更大比例的女性患病是归因于中度低温。
表4 2016—2018年北票市和西丰县因气温所致呼吸系统疾病住院的归因分值及其95%的置信区间 单位:%
Tab.4
| 地区 | 不同人群 | 总体气温(95%CI) | 极端低温(95%CI) | 中度低温(95%CI) | 中度高温(95%CI) | 极端高温(95%CI) |
|---|---|---|---|---|---|---|
| 北票市 | 总人群 | 27.0(20.3~32.9)* | 1.5(0.9~2.0)* | 25.9(19.5~31.5)* | 0.0(0.0~0.1) | 0.1(-0.2~0.4) |
| 少儿组 | 36.3(30.0~41.7)* | 0.6(-0.6~1.4) | 34.3(28.7~39.3)* | 0.8(-0.2~1.8) | 0.8(0.4~1.2)* | |
| 中青年组 | 10.4(-1.7~20.2) | 0.2(-1.1~1.2) | 13.7(2.8~22.8)* | -1.1(-1.7~0.5) | -2.6(-3.7~-1.7) | |
| 老年组 | 25.7(17.1~32.9)* | 1.8(1.2~2.4)* | 24.2(16.2~31.2)* | 0.0(-0.1~0.1) | 0.2(-0.3~0.5) | |
| 男性 | 17.8(10.2~24.6)* | 0.9(0.3~1.4)* | 16.7(9.6~23.1)* | 0.1(0.0~0.2)* | 0.4(0.0~0.6)* | |
| 女性 | 19.4(7.2~30.4)* | 1.5(0.7~2.2)* | 18.1(6.3~28.2)* | 0.0(0.0~0.0) | 0.2(-0.3~0.5) | |
| 西丰县 | 总人群 | 29.0(22.1~35.0)* | 0.9(0.2~1.4)* | 28.1(21.5~33.9)* | 0.2(-0.1~0.4) | 0.2(-0.1~0.4) |
| 少儿组 | 37.0(25.5~45.4)* | -0.5(-1.6~0.3) | 36.1(24.8~44.6)* | 0.8(0.2~1.4)* | 0.4(0.0~0.8)* | |
| 中青年组 | 11.4(-2.5~22.4) | 1.0(-0.1~1.9) | 11.7(-1.3~21.9) | -0.5(-0.9~0.1) | -0.8(-1.4~-0.2) | |
| 老年组 | 25.3(17.1~32.3)* | 1.6(1.0~2.2)* | 23.9(16.0~30.7)* | 0.1(-0.2~0.3) | 0.1(-0.2~0.4) | |
| 男性 | 24.7(18.0~30.6)* | 0.6(0.0~1.1)* | 23.9(17.2~29.4)* | 0.3(-0.2~0.7) | 0.1(-0.2~0.4) | |
| 女性 | 34.5(26.6~41.1)* | 1.2(0.5~1.8)* | 33.4(25.8~39.6)* | 0.2(-0.1~0.4) | 0.2(-0.1~0.5) |
注: *表示通过α=0.05的显著性检验。
综上,中度低温导致呼吸系统疾病的患病风险更大,有几个可能原因:首先,归因分值这样的指标不仅由相对风险决定,还取决于气温分布,而像北票、西丰这样的中纬度城市,一年中有大部分时间都是中度低温的天气,人群暴露在中度低温下的时间更长,所以对疾病的贡献更多;其次,低温对呼吸系统疾病的影响可从气温对人体的生理反应来解释,呼吸系统对寒冷的反应是支气管收缩、气管充血、分泌物清除率降低,这些变化都可能会引发呼吸系统疾病,比如哮喘、慢性阻塞性肺疾病等(Giesbrecht, 1995)。本文疾病数据仅来源于两县域城市的两家医院,对辽宁省平均情况的代表性有限。医疗数据的获取存在较大困难,受数据精确性的限制,可能存在潜在患者被遗漏情况。因为中度低温在整个气温分布中的占比较大,从而导致其患病风险也较大,在后续研究中期望对气温段进行更细致的划分,得出更精确的结论。
3 结论
根据辽宁省两县域城市的逐日气象和污染资料以及呼吸系统疾病住院人数,综合得出气温对呼吸系统疾病住院各人群的影响,并确定了敏感人群,主要结论如下:
(1)2016—2018年北票市与西丰县呼吸系统疾病住院人数全年峰值出现在冬春季。患病人群以少儿和老年人群居多。
(2)气温对呼吸系统疾病患病的影响以低温滞后效应为主,其效应可持续15 d左右,而高温存在即时效应但并不十分显著。气温对两地呼吸系统疾病人群的累积风险呈不规则“N”型分布,北票、西丰人群的最适宜气温分别为26.2、22.2 ℃。
(3)北票市和西丰县的患病风险主要以中度低温为主,分别占25.9%(95%CI:19.5%~31.5%)和28.1%(95%CI:21.5%~33.9%)。此外,不同年龄段人群对气温变化的适应能力不同,中度低温对少儿组的影响最大,老年组次之,中青年组最小;而就性别划分而言,女性比男性更容易受低温的影响。
参考文献
河北石家庄地区气温对儿童哮喘病就诊人数的影响
[J].
哮喘是儿童常见的呼吸道慢性炎症疾病,且受天气影响容易复发。为探讨气温对儿童哮喘的影响,提供分众化、针对性的预报服务,采用基于时间序列半参数广义相加模型(GAM),在控制时间趋势、气压、相对湿度等混杂因素影响后,分析2012—2014年石家庄地区气温与0—14岁儿童哮喘就诊人数的暴露—反应关系。结果发现:石家庄儿童哮喘高发年龄为0—6岁(婴幼儿),占76.5%;男性儿童占70.2%,明显多于女性;儿童哮喘就诊总人数冬季最多,其次是春秋季节转换时期,夏季最少;不同年龄段儿童哮喘表现特征有所不同:0—6岁的婴幼儿哮喘受寒冷影响更明显,7—14岁少儿哮喘对炎热反应敏感;日平均气温(T)对儿童哮喘就诊人数的影响指标为:当2.9 ℃<T≤12.8 ℃时,T每上升1 ℃,儿童哮喘发病就诊总人数将增加3‰;男、女不同性别的儿童哮喘受气温影响没有明显差异;0—6岁婴幼儿、7—14岁少儿哮喘受气温的影响不同:当1.7 ℃<T≤14.5 ℃和T>21.0 ℃时,随着T每上升1 ℃,7—14岁少儿哮喘发病就诊人数将增加5‰和4‰,对气温的敏感性高于0—6岁的婴幼儿。
银川市腮腺炎异常流行与大气环流的关系研究
[J].利用2005—2011年银川市逐日腮腺炎病例资料、NCEP/NCAR再分析资料,采取合成分析方法分析银川市腮腺炎的异常流行与大气环流的关系。结果表明:银川市腮腺炎发病人数具有明显的年际变化,最多年是最少年的4.1倍。年内阶段性变化明显,4—7月、11月至次年1月为多发时段;大气环流异常与腮腺炎的发生有一定的联系,腮腺炎发病人数异常偏多年北半球欧亚大陆500 hPa高度距平场全年、11月至次年1月贝加尔湖至我国西北地区东部为负距平区,4—7月我国东北至西北地区东部为负距平区,距平零线均位于西北地区东部附近,冷暖空气活动频繁。而500 hPa温度距平场中各时段的正负距平区域分布与高度场相近;异常偏少年500 hPa高度距平场各时段中蒙古国和我国为正距平区,冷空气活动偏北。而500 hPa温度距平场欧亚大陆中高纬度地区为正距平区,我国西北地区受偏南暖湿气流控制。
银川市腮腺炎流行特征及其与气象因素的关系
[J].利用2005~2011年银川市逐日腮腺炎病例资料、气象资料,采用气候倾向率、趋势系数、相关分析方法分析腮腺炎流行特征及其与气象因素的关系。结果表明:银川市腮腺炎病例数呈波动增多趋势,各月呈“2峰2谷”型规律变化;冬春之交(2~5月)、秋冬之交(9~12月)呈逐渐增多的趋势,夏季(6~8月)冬季(12月至次年2月)呈逐渐减少趋势;银川市兴庆区平均病例数最多,占总病例数的44.4%,灵武市平均病例数最少,只占总病例数的5.0%;1~18岁年龄段腮腺炎病例数占总病例数的92.7%,是主要易感人群,而6~7岁是防控的重点人群;腮腺炎疾病分别与前1~前4周平均最低气压、最大变压、最大变温、平均相对湿度、平均最小相对湿度、平均日照时数等气象因素有极显著的相关关系,可以利用前期气象资料预测腮腺炎病例数,为腮腺炎疾病的防控提供参考。
A new look at the statistical model identification
[J].
Short-term effects of air temperature on mortality and effect modification by air pollution in three cities of Bavaria, Germany: a time-series analysis
[J].
Lag effect of air temperature on the incidence of respiratory diseases in Lanzhou, China
[J].Previous studies have found that ambient temperature was associated with respiratory disease. However, little evidence is available in Lanzhou, a semi-arid region in northwest China, and respiratory disease is not well understood. This study evaluated the risk of outpatient visits for respiratory diseases associated with ambient temperatures from 2007 to 2016 in Lanzhou. We used a distributed lag non-linear model coupled with a generalized additive model to estimate the association between daily temperature and hospital visits for respiratory diseases in age- and sex-specific groups. Over 10 years, 1,042,656 hospital visits were recorded for respiratory disease, the ratio between males and females was 1.21:1. The peak period of onset occurs from November of the current year to March of the following year. Both low and high temperatures were associated with an increased risk of hospital visits for respiratory illness. The results showed that a large temperature decrease was associated with a significant risk for respiratory disease, the maximum effect of a temperature drop was reached at lag 1~2 days, the extreme low temperature (- 16 °C) had the maximum RR at lag 1, and the RR value was 1.082 (95 % CI 1.025-1.142). The high temperatures (23 °C) had maximum RR for respiratory disease on the current day, and the RR value was 1.099 (95 % CI 1.049-1.152). The high temperatures had acute and short-term effects and declined quickly over time, while the effects in low-temperature ranges were persistent over longer lag periods. Females suffered more from cold-associated morbidity than males. The effects of both hot and cold temperatures were greater among adolescents aged 6-14 years. Our study suggests that ambient temperatures are associated with hospital visits for respiratory illness in Lanzhou, particularly for those who are female and young. Caregivers and health practitioners should be made aware of the potential threat posed by cold and hot temperatures.
Mortality attributable to hot and cold ambient temperatures in India:a nationally representative case-crossover study
[J].
Effects of extreme temperatures on mortality and hospitalization in Ho Chi Minh City, Vietnam
[J].
Distributed lag non-linear models
[J].
Mortality risk attributable to high and low ambient temperature: a multicountry observational study
[J].
Attributable risk from distributed lag models
[J].
The respiratory system in a cold environment
[J].Acute or chronic cold exposure elicits several effects on the respiratory system. Pulmonary mechanics are compromised by bronchoconstriction, airway congestion, secretions and decreased mucociliary clearance. These responses are active in cold- or exercise-induced asthma, and are possibly responsible for decreased immune function and protection against airborne pollutants. The primary ventilatory effect of cold air is to decrease baseline ventilation and respiratory chemosensitivity. Although these responses provide significant protection against heat loss in many animals, the effect in humans is minimal. Cold exposure also elicits an increase in pulmonary vascular resistance. This stimulus is synergistic with hypoxia and may mediate pulmonary hypertension and edema at altitude. Chronic exposure to cold environments results in morphological changes such as increased numbers of goblet cells and mucous glands, hypertrophy of airway muscular fascicles and increased muscle layers of terminal arteries and arterioles. These latter two factors may play a role in the symptoms of chronic obstructive pulmonary disease and bronchitis, high altitude pulmonary hypertension and edema, and right heart hypertrophy.
The impact of temperature on mortality in Tianjin, China: a case-crossover design with a distributed lag nonlinear model
[J].
Extreme high temperatures and hospital admissions for respiratory and cardiovascular diseases
[J].Although the association of high temperatures with mortality is well-documented, the association with morbidity has seldom been examined. We assessed the potential impact of hot weather on hospital admissions due to cardiovascular and respiratory diseases in New York City. We also explored whether the weather-disease relationship varies with socio-demographic variables.We investigated effects of temperature and humidity on health by linking the daily cardiovascular and respiratory hospitalization counts with meteorologic conditions during summer, 1991-2004. We used daily mean temperature, mean apparent temperature, and 3-day moving average of apparent temperature as the exposure indicators. Threshold effects for health risks of meteorologic conditions were assessed by log-linear threshold models, after controlling for ozone, day of week, holidays, and long-term trend. Stratified analyses were used to evaluate temperature-demographic interactions.For all 3 exposure indicators, each degree C above the threshold of the temperature-health effect curve (29 degrees C-36 degrees C) was associated with a 2.7%-3.1% increase in same-day hospitalizations due to respiratory diseases, and an increase of 1.4%-3.6% in lagged hospitalizations due to cardiovascular diseases. These increases for respiratory admissions were greater for Hispanic persons (6.1%/ degrees C) and the elderly (4.7%/ degrees C). At high temperatures, admission rates increased for chronic airway obstruction, asthma, ischemic heart disease, and cardiac dysrhythmias, but decreased for hypertension and heart failure.Extreme high temperature appears to increase hospital admissions for cardiovascular and respiratory disorders in New York City. Elderly and Hispanic residents may be particularly vulnerable to the temperature effects on respiratory illnesses.
Cold temperature and low humidity are associated with increased occurrence of respiratory tract infections
[J].
Effects of extreme temperatures on hospital emergency room visits for respiratory diseases in Beijing, China
[J].
Pneumonia hospitalization risk in the elderly attributable to cold and hot temperatures in Hong Kong, China
[J].
Admissible selection of an accurate and parsimonious normal linear regression model
[J].
The impact of heat waves and cold spells on respiratory emergency department visits in Beijing, China
[J].
The association between diurnal temperature range and emergency room admissions for cardiovascular, respiratory, digestive and genitourinary disease among the elderly: a time series study
[J].
Effects of temperature on mortality in Hong Kong: a time series analysis
[J].Although interest in assessing the impacts of hot temperature and mortality in Hong Kong has increased, less evidence on the effect of cold temperature on mortality is available. We examined both the effects of heat and cold temperatures on daily mortality in Hong Kong for the last decade (2002-2011). A quasi-Poisson model combined with a distributed lag non-linear model was used to assess the non-linear and delayed effects of temperatures on cause-specific and age-specific mortality. Non-linear effects of temperature on mortality were identified. The relative risk of non-accidental mortality associated with cold temperature (11.1 °C, 1st percentile of temperature) relative to 19.4 °C (25th percentile of temperature) was 1.17 (95% confidence interval (CI): 1.04, 1.29) for lags 0-13. The relative risk of non-accidental mortality associated with high temperature (31.5 °C, 99th percentile of temperature) relative to 27.8 °C (75th percentile of temperature) was 1.09 (95% CI: 1.03, 1.17) for lags 0-3. In Hong Kong, extreme cold and hot temperatures increased the risk of mortality. The effect of cold lasted longer and greater than that of heat. People older than 75 years were the most vulnerable group to cold temperature, while people aged 65-74 were the most vulnerable group to hot temperature. Our findings may have implications for developing intervention strategies for extreme cold and hot temperatures.

