

引言
山东处于东亚季风区,青藏高原热力强迫是影响东亚季风和中国东部雨带的一个重要因素[7⇓⇓⇓⇓-12]。青藏高原对大气的季节性加热激发了东亚夏季风的爆发[13⇓⇓-16],而春季高原热力强迫的减弱会导致东亚夏季风减弱、雨带南撤[17]。研究发现,青藏高原热力强迫增强,通过2个Rossby波列促使中国东部锋面降水加强[18];当前期5月高原大气热源偏强时,7月中国东北地区主要为反气旋环流形势,导致降水偏少[19];春季高原感热强度减弱,会引起中国华南地区降水量、暴雨强度等大幅增加,华北地区降水量减少[17]。此外,高原上空的南亚高压是一个强大的反气旋系统,在夏季覆盖整个欧亚大陆[20],对中国东部夏季降水产生重大影响[21⇓-23];夏季,丝绸之路遥相关的转变使得高原大气水汽含量增加,进而影响中国东部雨带分布[24]。南亚高压和丝绸之路遥相关的变化很大程度上取决于青藏高原及其周围区域的非绝热加热[24-25]。大气中的非绝热加热组成了全球的大气热源[13]。综上可见,中国东部极端降水事件的发生与大气热力强迫密切相关。为提高山东省区域气候系统综合预报水平和极端天气精细化预报能力,本文利用1979—2018年山东省120个气象站降水观测资料和欧洲中期天气预报中心ERA-Interim再分析资料、美国国家环境预报中心和大气研究中心(National Centers for Environmental Prediction/National Center for Atmospheric Research,NCEP/NACR)再分析资料,分析山东夏季暴雨日数的时空变化特征及与青藏高原热力强迫的联系,并从环流场、南亚高压等环流指数变化的角度探讨春季高原热力强迫影响山东夏季暴雨的可能机制,以期为山东夏季暴雨气候预测与防灾减灾提供一定参考。
1 资料与方法
1.1 资料
选用1979—2018年山东省120个国家地面气象观测站逐日降水量资料和欧洲中期天气预报中心ERA-Interim逐月再分析资料(水平分辨率为1°×1°)以及NCEP/NACR逐6 h再分析资料(水平分辨率为2.5°×2.5°)。文中附图中的山东省行政边界基于山东省自然资源厅标准地图服务网站下载的审图号为鲁SG(2020)019号的标准地图绘制,底图无修改。
1.2 方法
1.2.1 大气视热源计算方法
式中:
1.2.2 三维波作用通量计算方法
式中:
2 山东夏季暴雨气候变化特征
图1
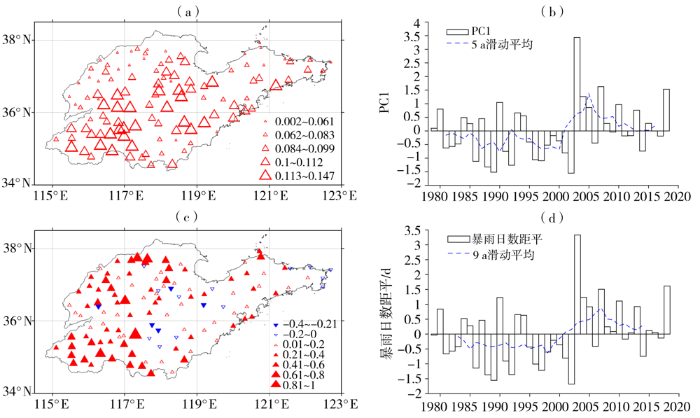
图1
1979—2018年山东夏季暴雨日数的标准化场EOF第一模态空间分布(a)及其时间系数序列(b)以及暴雨日数变化趋势分布[c,单位:d·(10 a)-1]和距平序列(d)
(实心的三角、倒三角通过α=0.05的显著性检验)
Fig.1
Spatial distribution of the first mode of standardized rainstorms days field decomposed by EOF (a) and its time coefficient series (b), and the tendency distribution (c, Unit: d·(10 a)-1) and anomaly series (d)of rainstorms days in summer from 1979 to 2018 in Shandong Province
(The solid triangles and inverted triangles pass the significance test at 0.05 level)
3 高原大气热源与山东夏季暴雨的关系
图2
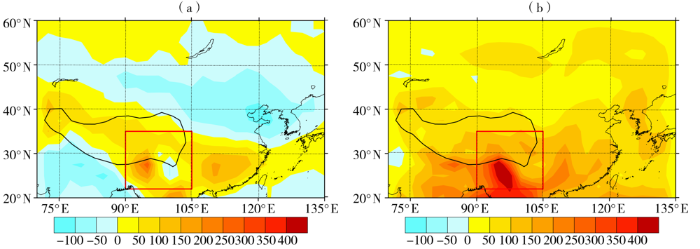
图2
1979—2018年春季(a)、夏季(b)平均大气热源分布(单位:W·m-2)
(黑色线为海拔3000 m以上青藏高原边界,红色方框为大气热源强中心区。下同)
Fig.2
The distribution of mean atmospheric heat source in spring (a) and summer (b) (Unit: W·m-2) (the black line for the Tibetan Plateau boundary with altitude more than 3000 m, and the red box for the strong center of atmospheric heat source. the same as below)
图3

图3
1979—2018年山东夏季暴雨指数与春季(a)、夏季(b)大气热源强度相关系数分布以及春季高原大气热源强度指数时间序列(c)及其与山东夏季暴雨日数相关系数分布(d)
(打点区通过α=0.1的显著性检验。下同;实心三角从小到大分别通过α=0.1、0.05的显著性检验)
Fig.3
The correlation coefficients distribution between summer rainstorm index in Shandong Province and intensity of atmospheric heat source in spring (a) and summer (b), and the time series of atmospheric heat source intensity index over the Tibetan Plateau in spring (c) and its correlation coefficients distribution with summer rainstorm days in Shandong Province (d) from 1979 to 2018
(The dotted areas pass the significance test at 0.1 level. the same as below; the solid triangles from small to large pass the significances tests at 0.1 and 0.05 level, respectively)
为描述青藏高原热力条件变化,定义春季高原大气热源强度指数,即对1979—2018年春季高原大气热源强中心区域(90°E—105°E、22°N—35°N)热源值逐年求平均,然后进行标准化距平处理。从 图3(c)看出,1979—2018年春季高原大气热源强度指数的年代际变化特征明显,1979—1997年除个别年份外均表现为负距平,1998—2010年多数年份为正距平,之后正负距平交替;9 a滑动平均显示,1979—1997年大气热源强度指数逐渐增大,1998—2005年经历显著增大期,2006年后逐渐减小,近2 a再次有增大趋势,这与山东夏季暴雨指数变化具有一致性。因此,计算春季高原大气热源强度指数与山东气象站点夏季暴雨日数的相关系数[图3(d)],发现除鲁东南及半岛部分站点外,山东其余大部分站点夏季暴雨日数与春季高原大气热源强度指数呈显著正相关,表明当春季青藏高原大气热源增强(减弱)时,山东大部地区夏季暴雨日数增多(减少)。
4 春季高原大气热源强度变化影响山东夏季暴雨的环流机制
4.1 环流形势
利用1979—2018年春季高原大气热源强度指数回归夏季环流场。夏季,200 hPa青藏高原上空为显著正高度异常,南亚高压偏强,其中心位于90°E附近,呈中部型,高压中心及其东部脊线位于35°N附近[图4(a)];500 hPa副热带高压西部脊线北抬至28°N附近[图4(b)],雨带位于甘肃南部、四川西部、河南、湖北、山东、河北至东北地区南部,雨带宽约5个纬距[33],山东处于主雨带范围内。另外,500 hPa自西伯利亚东部至中国东北地区为显著负高度异常,日本以东地区为显著正高度异常,表明当春季高原大气热源偏强时,夏季500 hPa中国东北地区易有冷涡生成南下,日本东部的西太平洋副热带高压加强北抬,冷暖气流交汇产生降水。整层水汽通量场上,有来自孟加拉湾、南海及西北太平洋的暖湿水汽输送至山东地区,为山东夏季降水提供有利于的水汽及热力条件。
图4
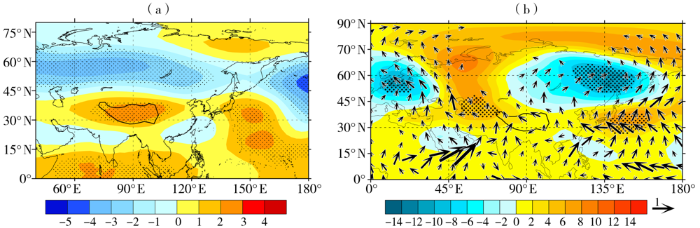
图4
春季高原大气热源强度指数回归的夏季200 hPa位势高度场(a,单位:gpm)和500 hPa位势高度场(填色区,单位:gpm)及整层水汽通量场(矢量,单位:g·cm-1·s-1)(b)
Fig.4
The 200 hPa geopotential height field (a, Unit: gpm), 500 hPa geopotential height (color shaded areas, Unit: gpm)and integrated water vapor flux (vectors, Unit: g·cm-1·s-1) field (b) in summer regressed by spring atmospheric heat source intensity index over the Tibetan Plateau
图5是春季青藏高原大气热源强度指数回归的春季、夏季相对涡度及风场纬向垂直剖面。从图5(a)看出,当春季青藏高原地表加热增强时,同期高原上空对流层中高层表现为正涡度异常,其以上至平流层为负涡度异常,导致500 hPa附近气旋性环流增强形成辐合气流,对流层上部至平流层反气旋性环流增强形成辐散气流。低层辐合、高层辐散,有利于上升运动加强,在水汽充足条件下降水增多,同时降水产生的凝结潜热进一步促使大气热力强迫加强。春季高原大气热力强迫增强对天气和气候的影响可持续到夏季。从夏季35°N—40°N范围平均相对涡度及风场纬向垂直剖面[图5(b)]看出,春季青藏高原地表加热增强有利于夏季高原上空对流层上部至平流层反气旋环流增强,促使南亚高压加强、东扩,山东对流层上部存在负涡度异常区,形成高层反气旋式辐散,而低层伴有不显著的正涡度异常区,形成低层气旋式辐合。低层辐合、高层辐散,致使山东上空上升运动增强,有利于降水增强。
图5

图5
春季高原大气热源强度指数回归的同期沿30°N(a)和夏季35°N—40°N范围(b)相对涡度(填色区,单位:10-5 s-1)及风场(矢量,单位:m·s-1)的纬向垂直剖面
(黑色区为青藏高原,黑色箭头通过α=0.1的显著性检验。下同)
Fig.5
The zonal vertical sections of relative vorticity (color shaded areas, Unit: 10-5 s-1) and wind field (vectors, Unit: m·s-1) along 30°N in the same period (a) and over 35°N-40°N area in summer (b) regressed by atmospheric heat source intensity index over the Tibetan Plateau in spring
(The black area is the Tibetan Plateau, and black arrows pass the significance test at 0.1 level. the same as below)
4.2 南亚高压及丝绸之路遥相关作用机制
选取夏季南亚高压强度指数(South Asia high intensity index,SAH_int)及丝绸之路遥相关指数进行分析。采用夏季200 hPa高度场计算1979—2018年SAH_int[34]。春季高原大气热源强度指数和夏季SAH_int(图略)在年代际变化上存在差异,因此对二者去除趋势后再做分析。将夏季200 hPa经向风距平场EOF分解的第一模态空间分布(解释方差为33.1%)定义为丝绸之路遥相关型,标准化后的时间序列定义为丝绸之路遥相关指数[35⇓-37],其变化影响中国降水分布和雨带移动[38]。从图6(a)看出, 200 hPa上20°N—60°N范围自西向东呈“正、负、正”的丝绸之路遥相关型分布,与夏季副热带西风急流轴的平均位置近乎一致,且与西风急流的南北偏移存在显著相关[38]。从图6(b)看出,丝绸之路遥相关指数具有明显的年代际变化,20世纪初以前指数呈明显下降趋势,2000年以后指数多为负位相,这与山东夏季暴雨指数变化相反。另外,春季青藏高原大气热源强度指数与夏季SAH_int、丝绸之路遥相关指数的相关系数分别为0.28、-0.65,而山东夏季暴雨指数与夏季SAH_int、丝绸之路遥相关指数的相关系数分别为0.38、-0.46,均通过α=0.1的显著性检验,表明春季高原大气热源通过调节夏季南亚高压、大气遥相关等方式影响山东夏季降水,当春季高原大气热源强度指数增大(减小)时,夏季SAH_int增大(减小),丝绸之路遥相关指数减小(增大),山东夏季暴雨增多(减少)。
图6
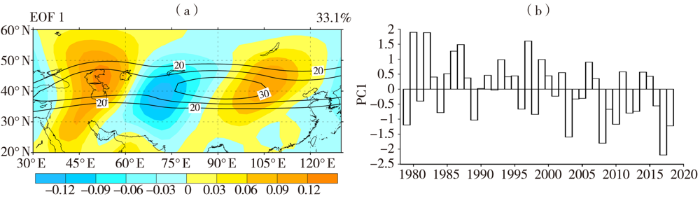
图6
夏季200 hPa平均经向风距平场EOF分解的第一模态空间分布(a,填色区)及其标准化时间系数序列(b)
(黑色等值线表示风速大于等于20 m·s-1的西风急流气候平均位置)
Fig.6
The spatial distribution of the first mode of 200 hPa mean meridional wind anomaly field in summer decomposed by EOF (a, color shaded areas) and its standardized time coefficients series (b)
(the black contours for the climatic average location of westerly jet with wind speed more than or equal to 20 m·s-1)
利用夏季SAH_int回归同期110°E—125°E范围平均相对涡度场和风场(图7)。可以看出,南亚高压变化对环流场的调节作用可以间接影响山东降水,当夏季SAH_int偏大时,20°N—30°N范围有显著负涡度异常,中高层反气旋式环流增强,副热带高压强盛,而40°N以北地区为正涡度异常,气旋式环流增强,低值系统南下易与副热带高压系统相结合,35°N以北的山东地区上升运动加强,有利于降水产生。
图7
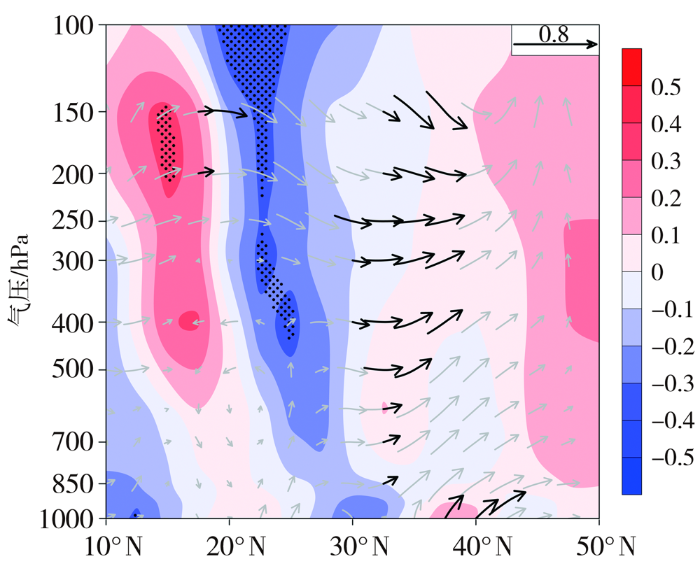
图7
夏季南亚高压强度指数回归的同期110°E—125°E范围平均相对涡度(填色区,单位:10-5 s-1)和风场(矢量,单位:m·s-1)的经向垂直剖面
Fig.7
The meridional vertical section of average relative vorticity (color shaded areas, Unit: 10-5 s-1) and wind field (vectors, Unit: m·s-1) over 110°E-125°E in the same period regressed by SAH_int in summer
由于山东夏季暴雨指数与同期丝绸之路遥相关指数呈显著负相关,故而将图8中各变量乘以负号来表达丝绸之路遥相关偏弱时的环流状况。可以看出,当夏季丝绸之路遥相关指数偏小时, 200 hPa在里海附近、青藏高原以北存在2个相对涡度负异常中心,乌拉尔山附近、贝加尔湖以西以及山东半岛至日本海区域分别存在相对涡度正异常中心,中高纬地区为明显的“正、负、正”交替的异常变化,属于典型的丝绸之路遥相关空间分布型。另外,中纬地区从贝加尔湖以东至山东一带有异常的TN通量自西向东传播,即Rossby波能量频散增强,易形成高空急流,且在江淮北部至华北南部形成急流出口,有利于上升运动加强。当贝加尔湖附近对流层中上层相对涡度正异常(位势高度负异常)增强,并伴随Rossby波能量频散增强时,会引起东北冷涡增强[38]。东北冷涡作为影响山东夏季降水的重要天气系统,其增强将引起山东夏季降水增加。山东至日本上空正涡度异常会促使该区域上升运动加强,进而形成有利的降水形势。
图8
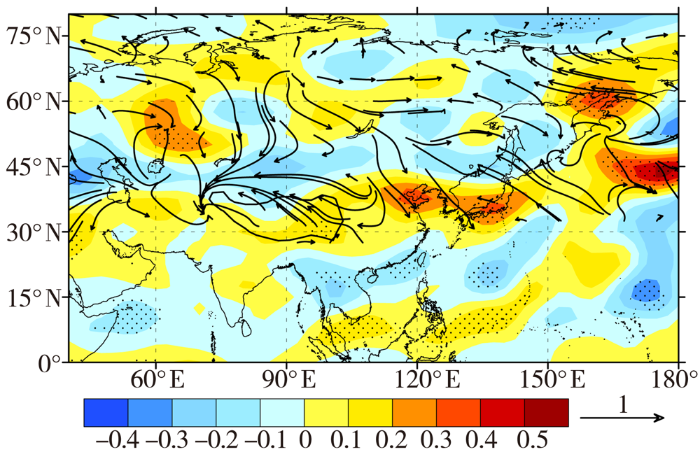
图8
夏季丝绸之路遥相关指数回归的同期低通滤波的200 hPa平均相对涡度(填色区,单位:10-5 s-1)和TN通量(矢量,单位:m2·s-2)
Fig.8
The lowpass filtered mean relative vorticity (color shaded areas, Unit: 10-5 s-1) and TN flux (vectors, Unit: m2·s-2) at 200 hPa in the same period regressed by Silk Road teleconnection correlation index in summer
5 结论
(1)山东夏季暴雨日数的EOF第一模态分布具有空间一致性。1979—2018年山东大部地区夏季暴雨日数呈增加趋势,鲁西南、鲁西北中东部增加趋势显著;2002年以前为暴雨偏少期,1999—2007年经历了显著增加期,21世纪初以来山东暴雨日数整体偏多。
(2)春季大气热源中心位于高原东南部至中南半岛西北部地区,而夏季大气热源中心位置基本未变,但范围和强度均有所增大。当春季高原大气热源增强时,山东大部分地区夏季暴雨日数增多。
(3)春季高原大气热源偏强时,夏季高原上空对流层上部至平流层反气旋环流加强,促使南亚高压加强、东扩,200 hPa南亚高压易呈中部型; 500 hPa东北冷涡易生成南下,日本东部西太平洋副热带高压加强北抬,冷暖气流在山东地区交汇。同时,有明显的水汽输送至山东地区。因此,春季高原大气热源偏强时,夏季山东地区易形成低层辐合、高层辐散的环流配置,有利于降水。
(4)春季高原大气热源通过调节夏季南亚高压、大气遥相关等方式影响山东夏季降水。当春季高原大气热源偏强时,夏季南亚高压增强、丝绸之路遥相关减弱,有利于冷空气南下,并与暖湿空气在山东地区交汇,从而在山东地区形成强降雨。
本文研究发现,山东地区局地热源与同期暴雨存在显著正相关,其机制尚不明确。低空急流向降水区输送强的暖湿平流,从而使得降水过程中不稳定能量得以维持。然而,对山东地区多次暴雨天气个例统计发现,低空急流并不一定是暖平流,因此,还需对降水集中时段大气热源中温度垂直变化项、局地变化项及水平平流项的作用及能量主要来源进一步深入探讨研究。
参考文献
Trends in total precipitation and frequency of daily precipitation extremes over China
[J].
气象局关于印发《中国气象局关于加强生态文明建设气象保障服务工作的意见》的通知(气发[2017]79号)
[J].
Role of the Tibetan Plateau thermal forcing in the summer climate patterns over subtropical Asia
[J].
Relative contributions of the Tibetan Plateau thermal forcing and the Indian Ocean Sea surface temperature basin mode to the interannual variability of the East Asian summer monsoon
[J].
Time-lagged impact of spring sensible heat over the Tibetan Plateau on the summer rainfall anomaly in East China: case studies using the WRF model
[J].
The relation between the Tibetan winter snow and the Asian summer monsoon and rainfall: an observational investigation
[J].
Variability of Tibetan spring snow and its associations with the hemispheric extratropical circulation and East Asian summer monsoon rainfall: an observational investigation
[J].
Trends in summer rainfall over China associated with the Tibetan Plateau sensible heat source during 1980-2008
[J].
Tibetan Plateau warming and precipitation changes in East Asia
[J].
The development and decay of the 100-mb. summertime anticyclone over southern Asia
[J].
Interannual variation of the South Asian high and its relation with Indian and East Asian summer monsoon rainfall
[J].
Impact of East Asian summer monsoon heating on the interannual variation of the South Asian high
[J].
Remotely modulated tropical-North Pacific ocean-atmosphere interactions by the South Asian high
[J].
Impacts of the Silk Road pattern on the interdecadal variations of the atmospheric heat source over the Tibetan Plateau
[J].
The influence of mechanical and thermal forcing by the Tibetan Plateau on Asian climate
[J].
The large-scale circulation and heat sources over the Tibetan Plateau and surrounding areas during the early summer of 1979. Part II: heat and moisture budgets
[J].
Seasonal heating of the Tibetan Plateau and its effects on the evolution of the Asian summer monsoon
[J].
Uncertainties in quantitatively estimating the atmospheric heat source over the Tibetan Plateau
[J].
A formulation of a wave-activity flux for stationary Rossby waves on a zonally varying basic flow
[J].
A formulation of a phase-independent wave-activity flux for stationary and migratory quasigeostrophic eddies on a zonally varying basic flow
[J].
南亚高压中部型与我国雨带分布
[J].
本文通过对1981-1984年6-8月100毫巴资料的分析,提出南亚高压中心位于95°-105°E区域的中部型是高原大气的一个重要环流系统。在此流型控制下,我国主要雨带特征与西部型和东部型有着明显的不同。
Summer monsoon experiment—a review
[J].
Interdecadal variations of the Silk Road pattern
[J].
Connection between the Silk Road pattern in July and the following January temperature over East Asia
[J].

