Journal of Arid Meteorology ›› 2025, Vol. 43 ›› Issue (2): 221-230.DOI: 10.11755/j.issn.1006-7639-2025-02-0221
• Articles • Previous Articles Next Articles
Relationship between atmospheric heat source over the Qinghai-Xizang Plateau and its surrounding area and annual variation of high temperature days in Summer in Sichuan-Chongqing Basin
HUANG Xiaomei1( ), ZHOU Changyan1(), PANG Yishu1,2, YU Haohui3, GAN Weiwei1
- 1. The Climate Center of Sichuan Province, Chengdu 610072, China
2. Heavy Rain and Drought-Flood Disasters in Plateau and Basin Key Laboratory of Sichuan Province, Chengdu 610072, China
3. Meteorological Disaster Prevention Technology Center of Sichuan Province, Chengdu 610072, China
-
Received:2024-07-11Revised:2025-03-06Online:2025-04-30Published:2025-05-13
夏季青藏高原及周边地区大气热源与川渝盆地高温日数年际变化的关系
黄小梅1(), 周长艳1(), 庞轶舒1,2, 于浩慧3, 甘薇薇1
- 1.四川省气候中心,四川 成都 610072
2.高原与盆地暴雨旱涝灾害四川省重点实验室,四川 成都 610072
3.四川省气象灾害防御技术中心,四川 成都 610072
-
通讯作者:周长艳(1979—),女,四川凉山人,研究员,主要从事气候及气候变化研究。E-mail: zcy001124@163.com。 -
作者简介:黄小梅(1987—),女,四川绵阳人,副研究员,主要从事青藏高原气候变化研究。E-mail: hxmlovely@163.com。 -
基金资助:四川省自然科学基金项目(2024NSFSC0066);四川省气象局重点创新团队项目(SCQXTD202402);高原与盆地暴雨旱涝灾害四川省重点实验室科技发展基金项目(2018-青年-07);高原与盆地暴雨旱涝灾害四川省重点实验室科技发展基金项目(SCQXKJYJXZD202404);四川省气象局复盘总结专项(SCQXFPZJ2025-04)
CLC Number:
Cite this article
HUANG Xiaomei, ZHOU Changyan, PANG Yishu, YU Haohui, GAN Weiwei. Relationship between atmospheric heat source over the Qinghai-Xizang Plateau and its surrounding area and annual variation of high temperature days in Summer in Sichuan-Chongqing Basin[J]. Journal of Arid Meteorology, 2025, 43(2): 221-230.
黄小梅, 周长艳, 庞轶舒, 于浩慧, 甘薇薇. 夏季青藏高原及周边地区大气热源与川渝盆地高温日数年际变化的关系[J]. 干旱气象, 2025, 43(2): 221-230.
share this article
Add to citation manager EndNote|Ris|BibTeX
URL: http://www.ghqx.org.cn/EN/10.11755/j.issn.1006-7639-2025-02-0221
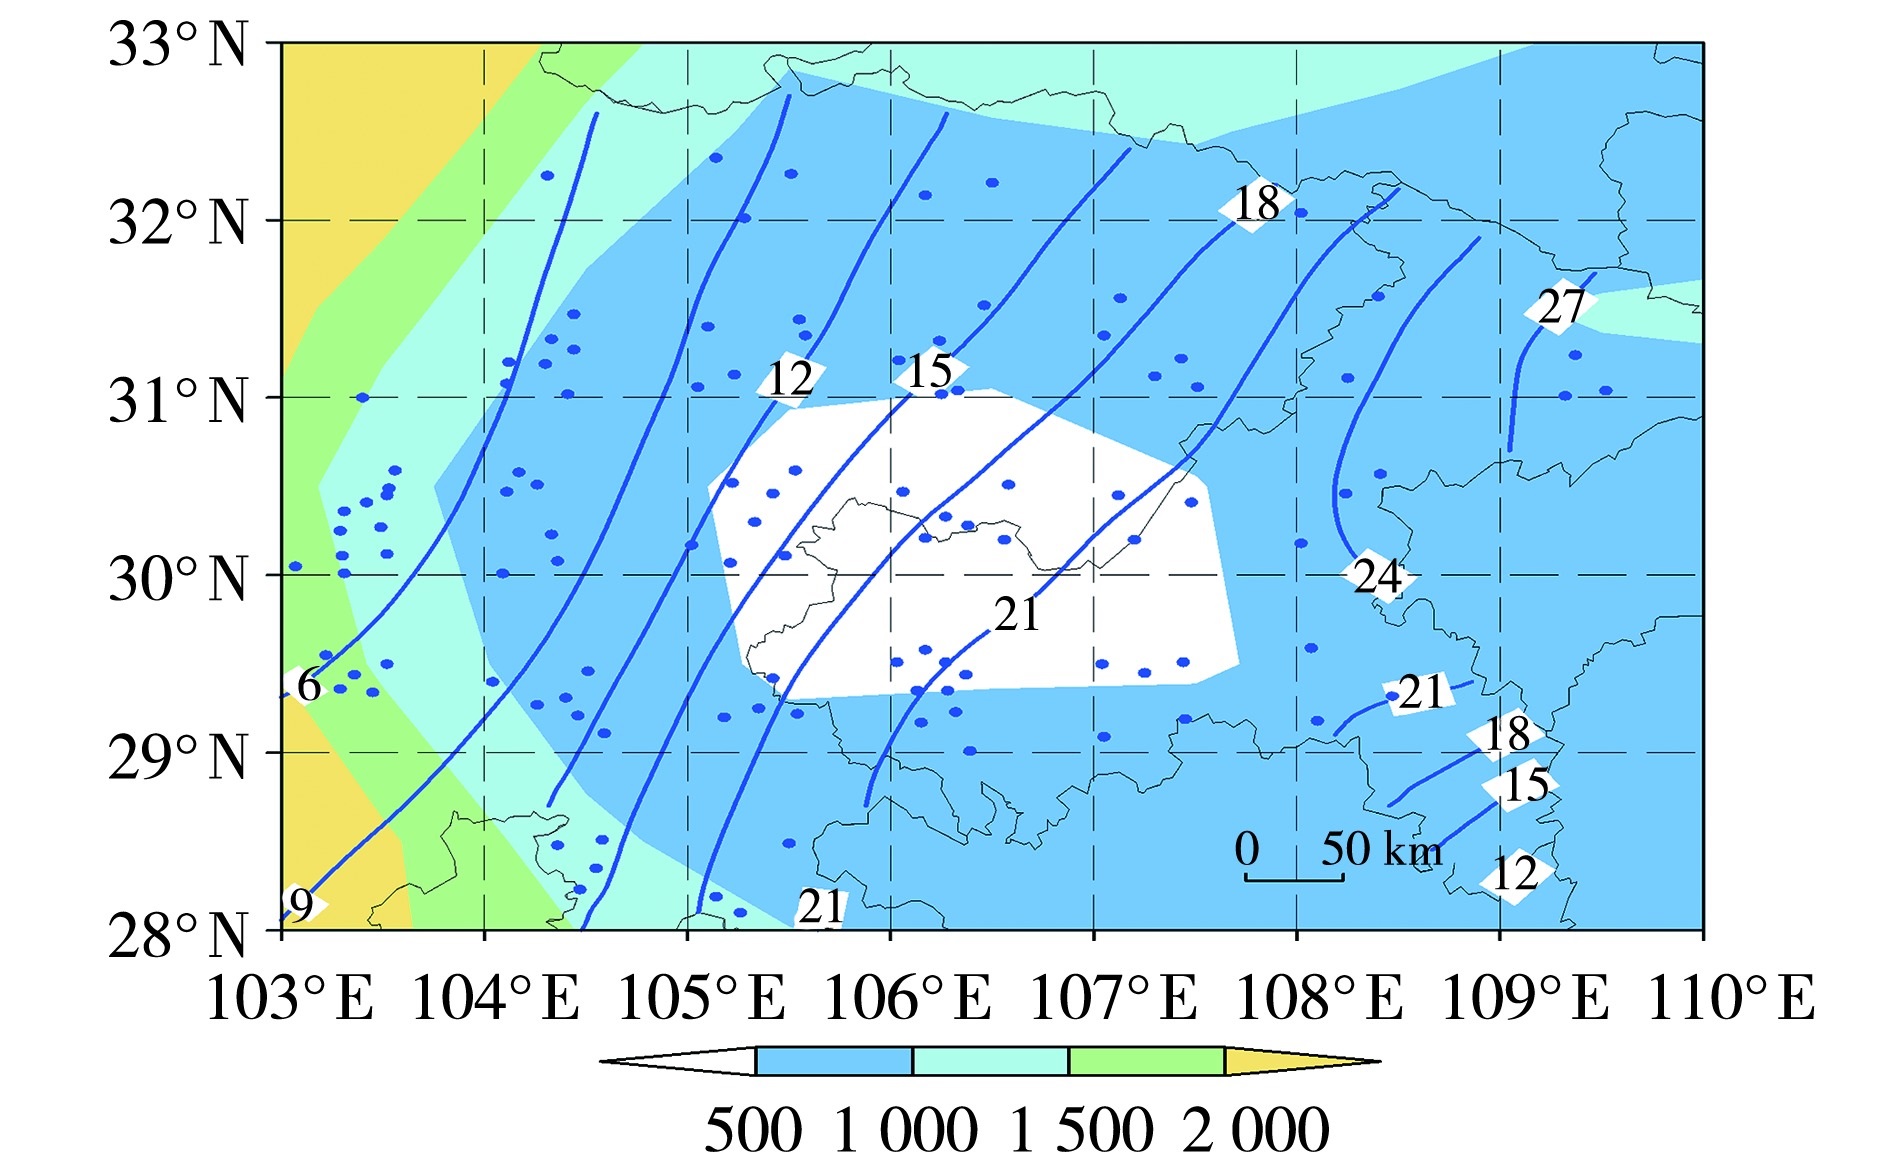
Fig.1 The spatial distribution of topographic height (the color shaded, Unit: m), and the climatological mean high temperature days (isolines, Unit: d) in summer from 1991 to 2020 in the Sichuan-Chongqing Basin (The dots represent the meteorological stations)
Fig.1 The spatial distribution of topographic height (the color shaded, Unit: m), and the climatological mean high temperature days (isolines, Unit: d) in summer from 1991 to 2020 in the Sichuan-Chongqing Basin (The dots represent the meteorological stations)
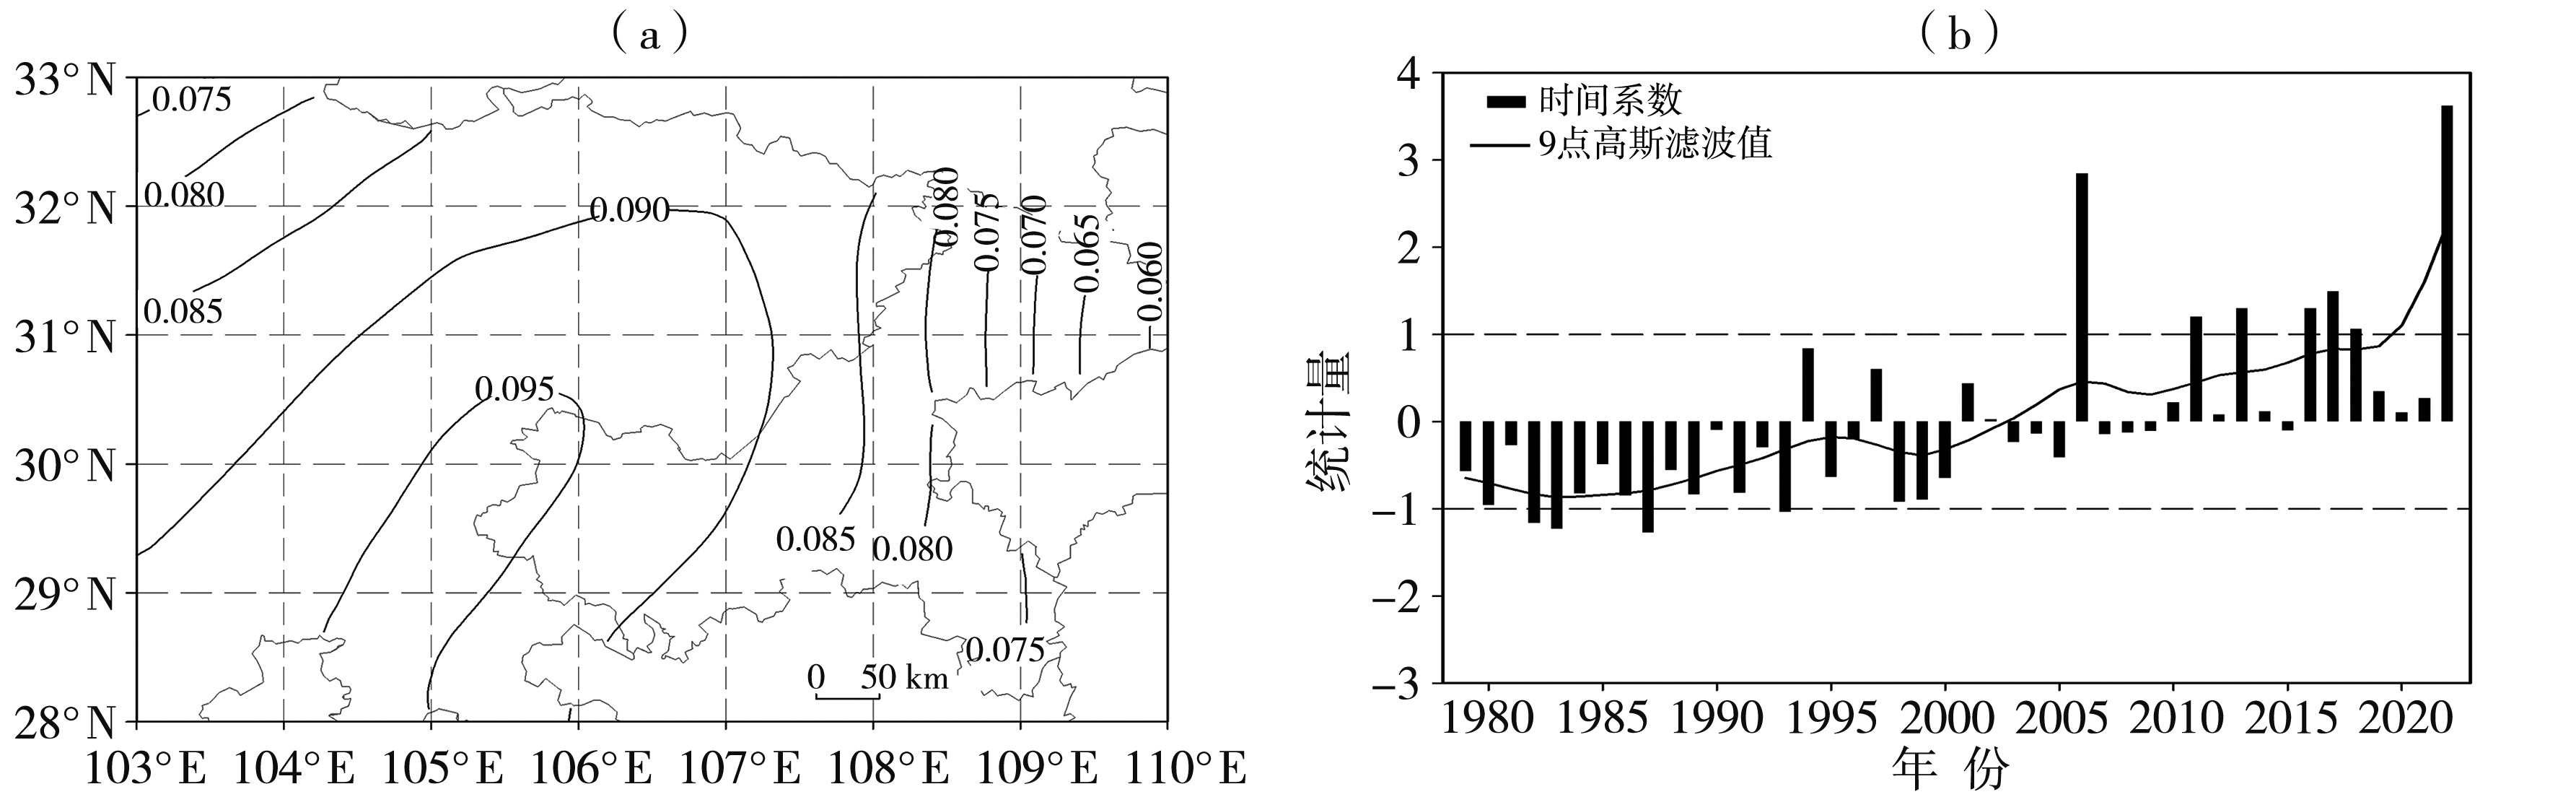
Fig.2 The first mode of EOF decomposition of high temperature days in summer in the Sichuan-Chongqing Basin from 1979 to 2022 (a) and its standardized time coefficient (b)
Fig.2 The first mode of EOF decomposition of high temperature days in summer in the Sichuan-Chongqing Basin from 1979 to 2022 (a) and its standardized time coefficient (b)
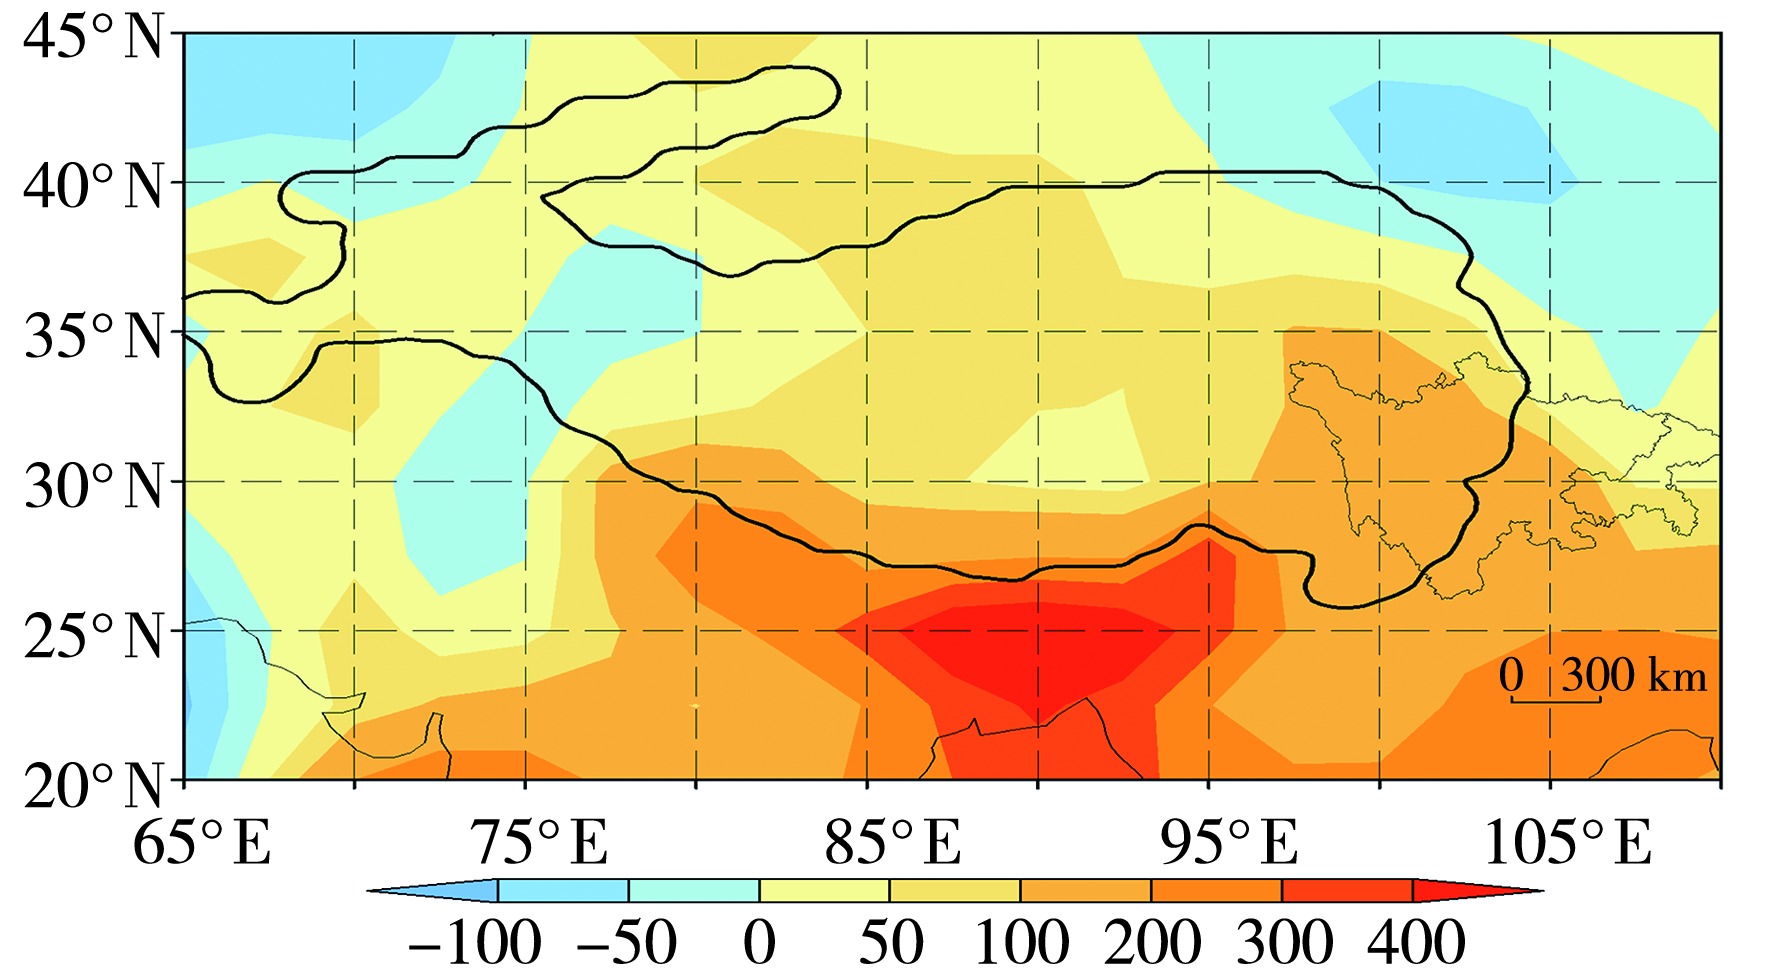
Fig.3 The spatial distribution of climatological mean state of atmospheric heat sources in summer over the Qinghai-Xizang Plateau and its surrounding region (Unit: W·m-2) (The black line is the Qinghai-Xizang Plateau boundary with altitude of 3 000 m)
Fig.3 The spatial distribution of climatological mean state of atmospheric heat sources in summer over the Qinghai-Xizang Plateau and its surrounding region (Unit: W·m-2) (The black line is the Qinghai-Xizang Plateau boundary with altitude of 3 000 m)
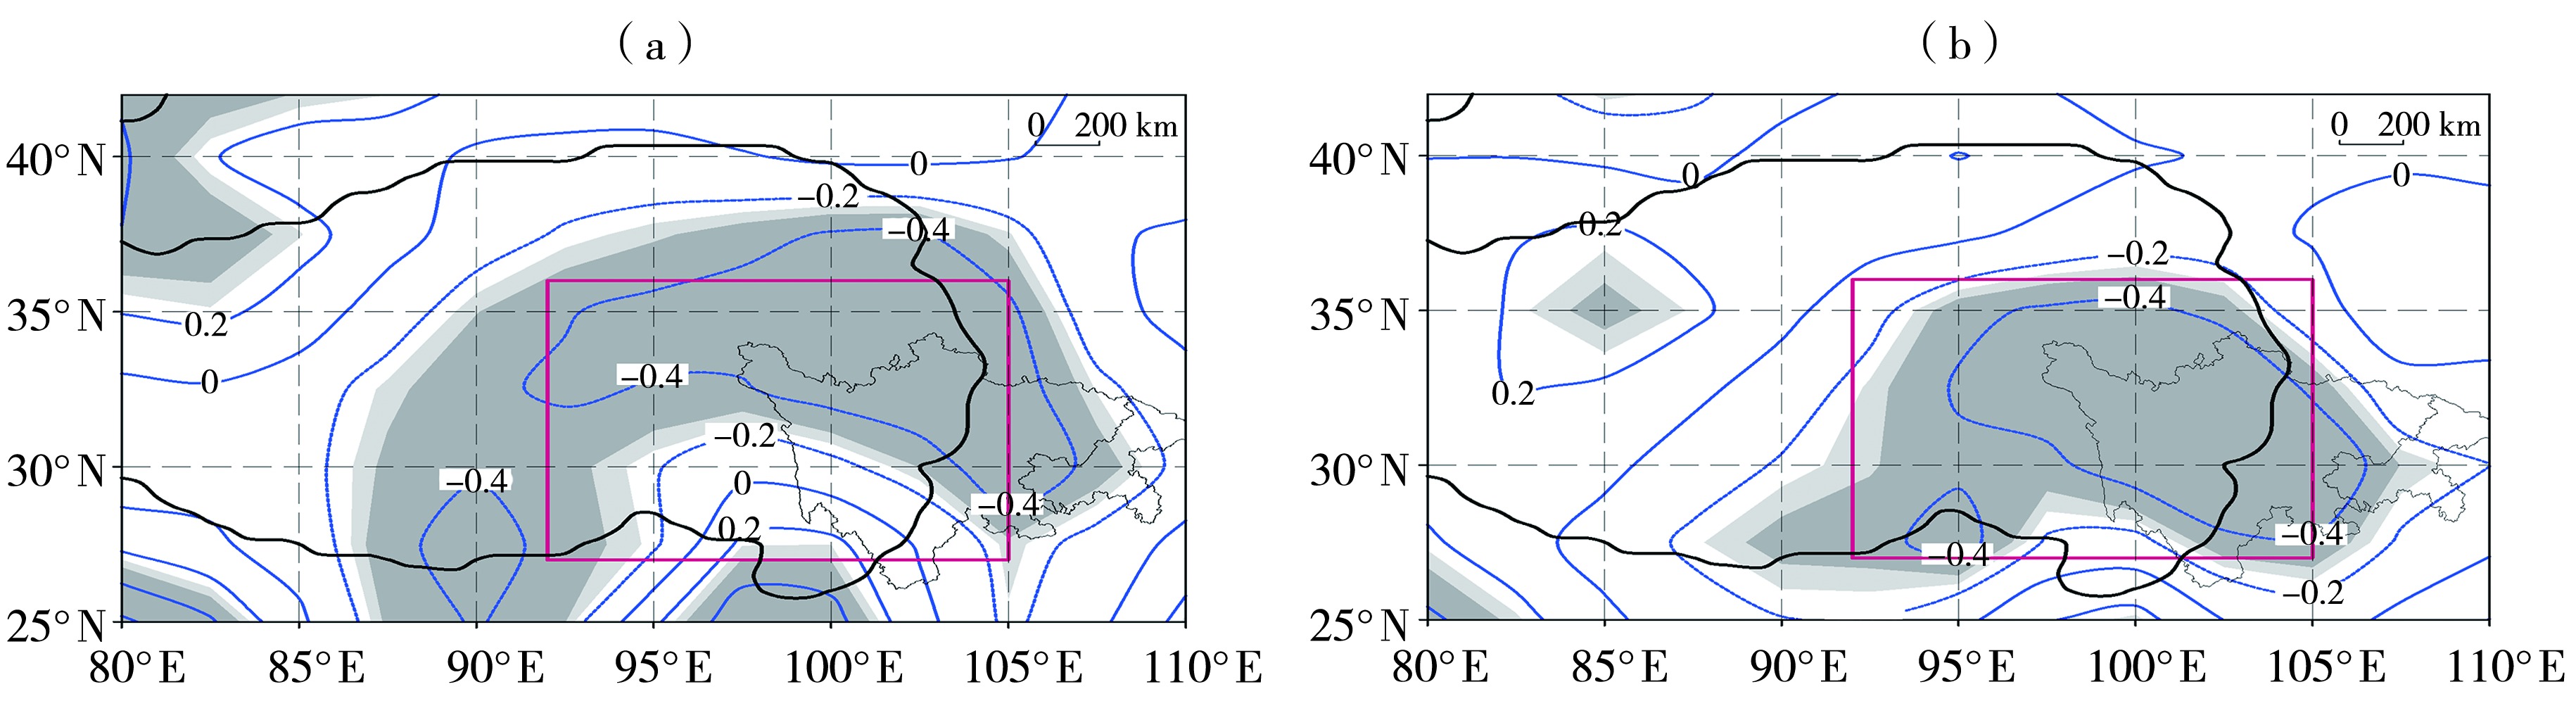
Fig.4 The spatial distribution of the correlation coefficients between the time series of the first EOF mode of high temperature days in summer in Sichuan-Chongqing Basin from 1979 to 2022 and the atmospheric heat sources over the Qinghai-Xizang Plateau and its surrounding areas before (a) and after (b) removing the interdecadal variation trends (The red square frame represents the key regions selected for the calculation of the thermal index of Qinghai-Xizang Plateau, the dark and light shadows indicate the confidence level of 95% and 90%, respectively)
Fig.4 The spatial distribution of the correlation coefficients between the time series of the first EOF mode of high temperature days in summer in Sichuan-Chongqing Basin from 1979 to 2022 and the atmospheric heat sources over the Qinghai-Xizang Plateau and its surrounding areas before (a) and after (b) removing the interdecadal variation trends (The red square frame represents the key regions selected for the calculation of the thermal index of Qinghai-Xizang Plateau, the dark and light shadows indicate the confidence level of 95% and 90%, respectively)
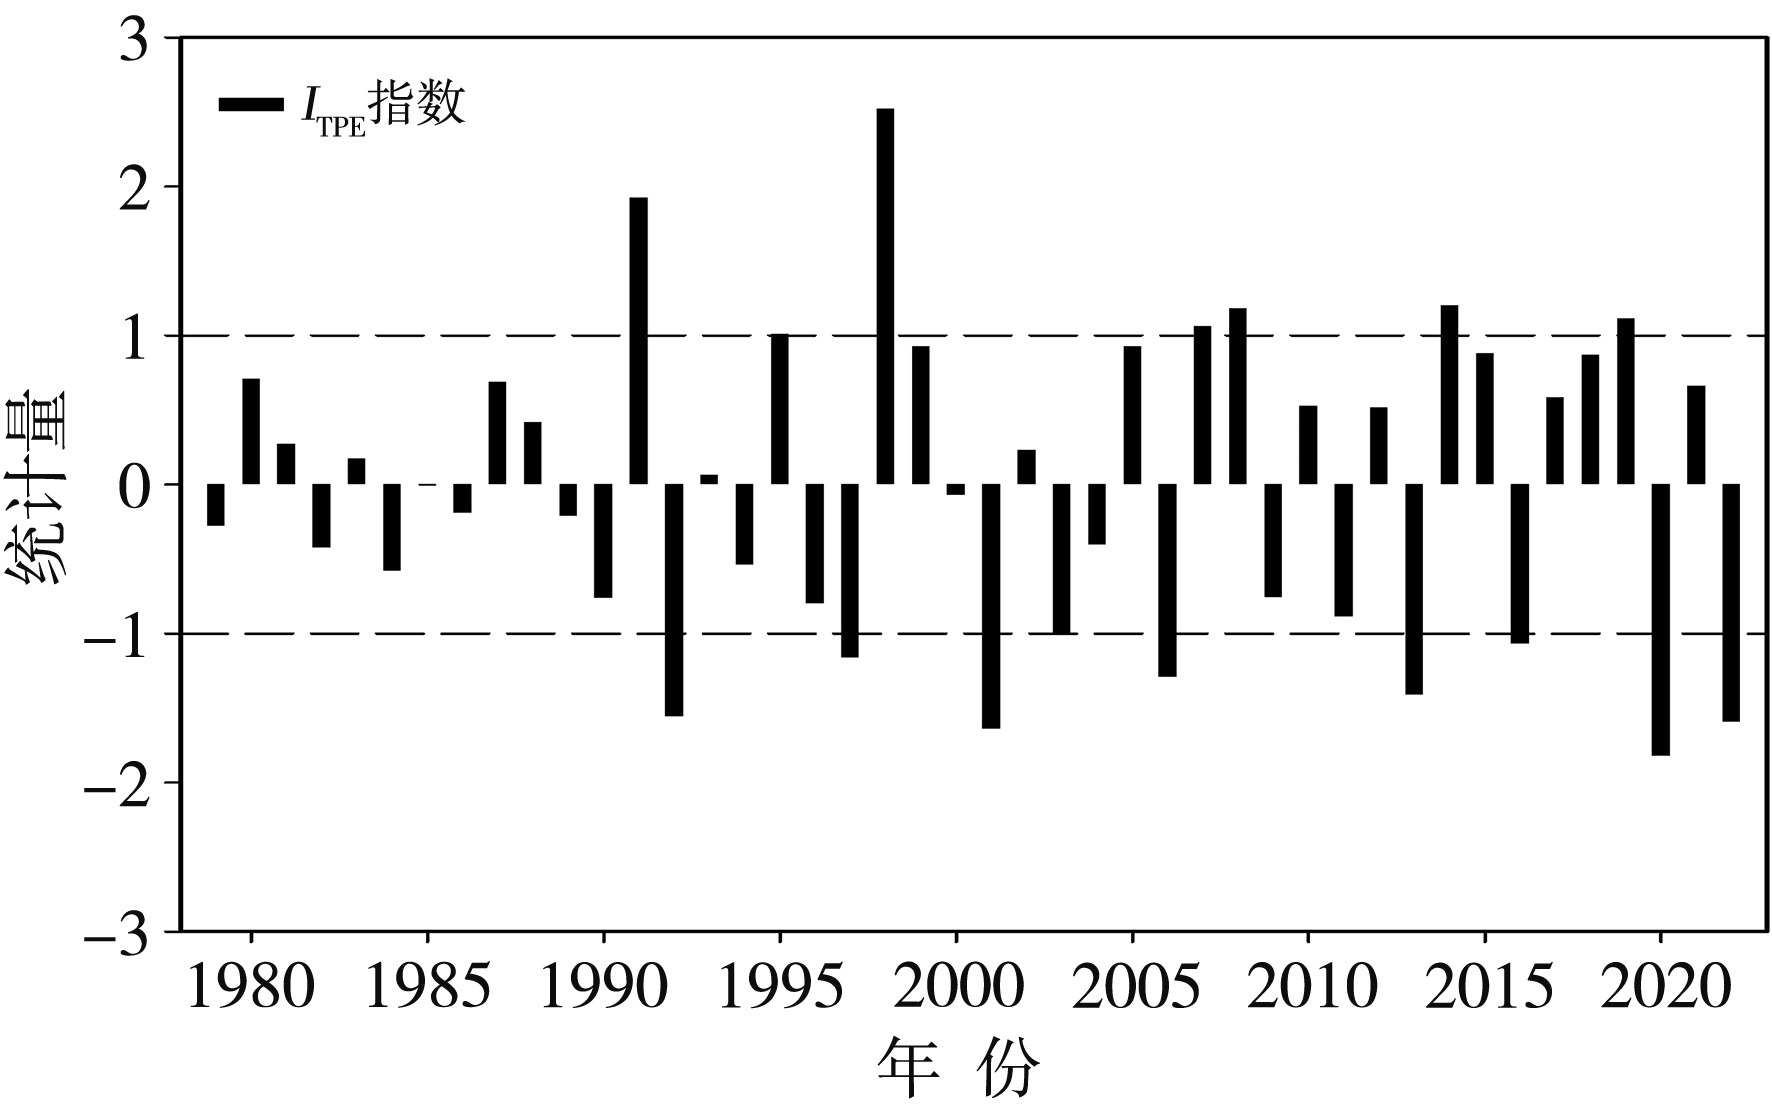
Fig.5 The inter-annual variation of the standardized ITPE from 1979 to 2022
Fig.5 The inter-annual variation of the standardized ITPE from 1979 to 2022
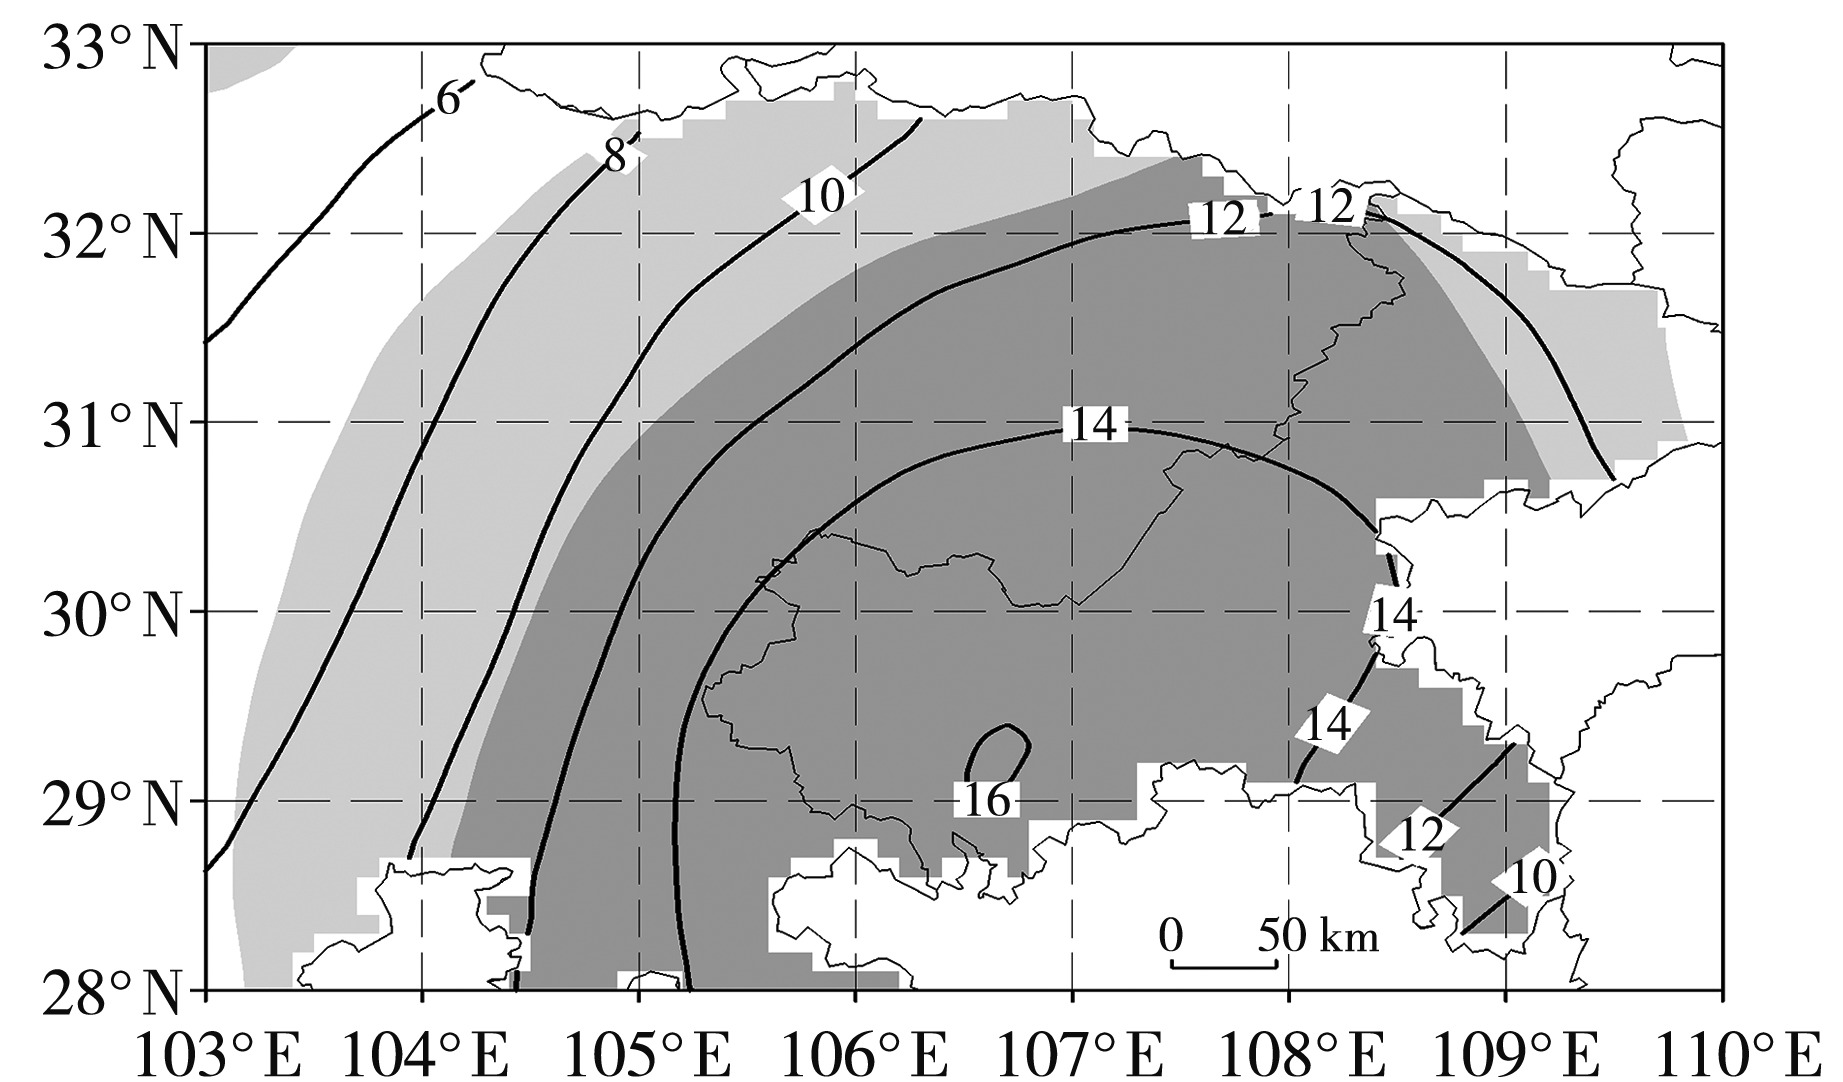
Fig.6 Composite difference field of high temperature days anomaly in summer over Sichuan-Chongqing Basin in the years with low and high thermal index of Qinghai-Xizang Plateau (Unit: d) (The dark and light shadows indicate the confidence level of 95% and 90%, respectively, the same as below)
Fig.6 Composite difference field of high temperature days anomaly in summer over Sichuan-Chongqing Basin in the years with low and high thermal index of Qinghai-Xizang Plateau (Unit: d) (The dark and light shadows indicate the confidence level of 95% and 90%, respectively, the same as below)
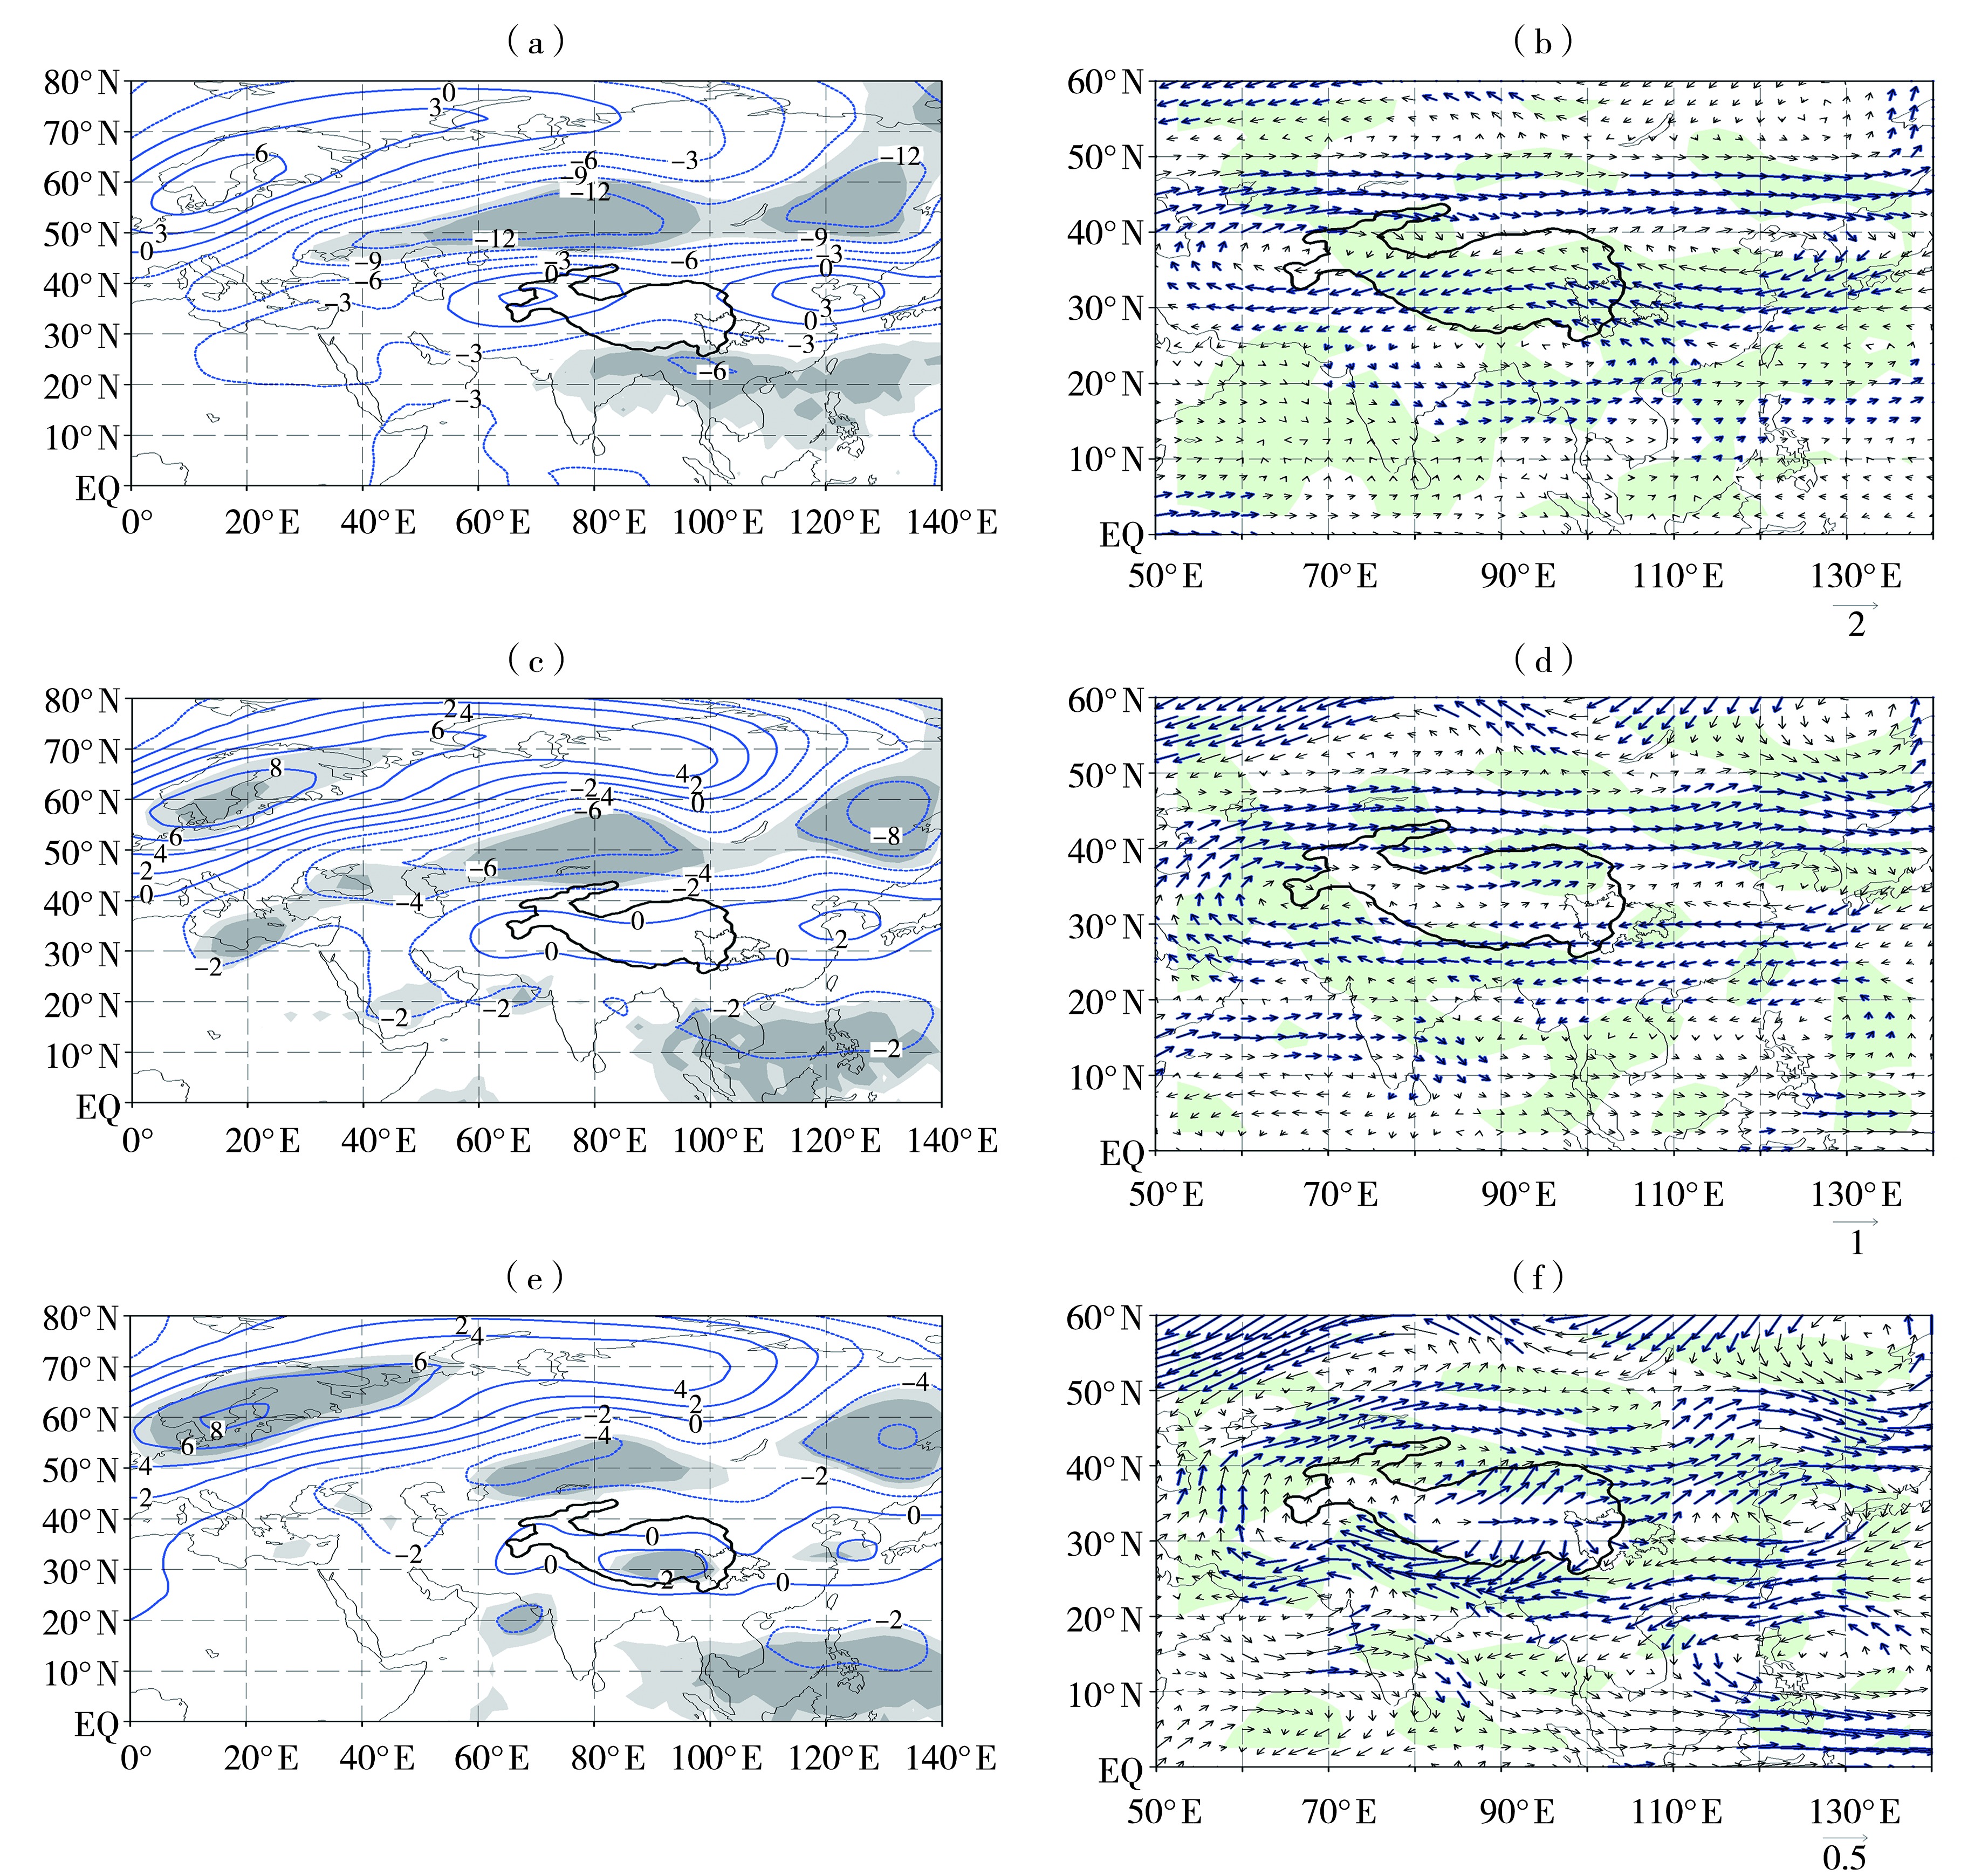
Fig.7 The geopotential height field (contours, Unit: gpm) (a, c, e), wind field (arrows, Unit: m·s-1) (b, d, f) at 200 hPa (a, b), 500 hPa (c, d), 700 hPa (e, f) in the same period regressed by using the negative ITPE in summer from 1979 to 2022 (The confidence level of blue arrows is 90%, and the green shaded represents the convergence zone)
Fig.7 The geopotential height field (contours, Unit: gpm) (a, c, e), wind field (arrows, Unit: m·s-1) (b, d, f) at 200 hPa (a, b), 500 hPa (c, d), 700 hPa (e, f) in the same period regressed by using the negative ITPE in summer from 1979 to 2022 (The confidence level of blue arrows is 90%, and the green shaded represents the convergence zone)
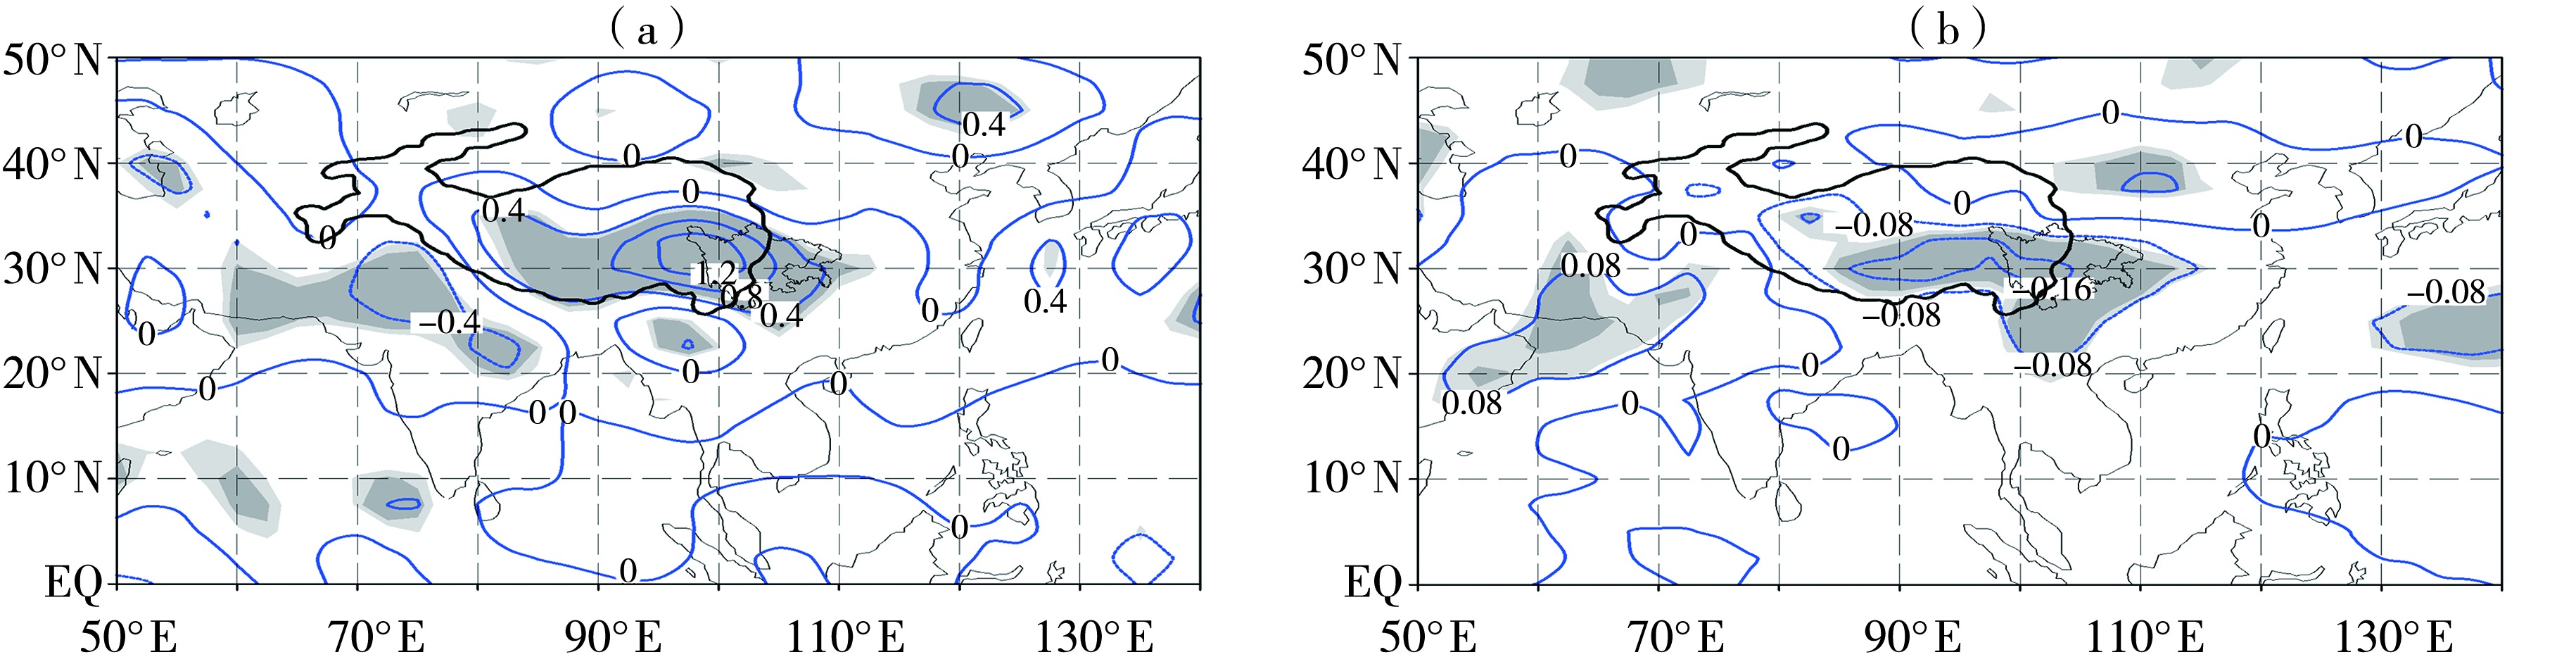
Fig.8 The vertical velocity field (a,Unit: Pa·s-1, the vertical velocity ω multiplied by 100) and specific humidity field (b, Unit: g·kg-1) at 500 hPa in the same period regressed by using the negative ITPE in summer from 1979 to 2022
Fig.8 The vertical velocity field (a,Unit: Pa·s-1, the vertical velocity ω multiplied by 100) and specific humidity field (b, Unit: g·kg-1) at 500 hPa in the same period regressed by using the negative ITPE in summer from 1979 to 2022
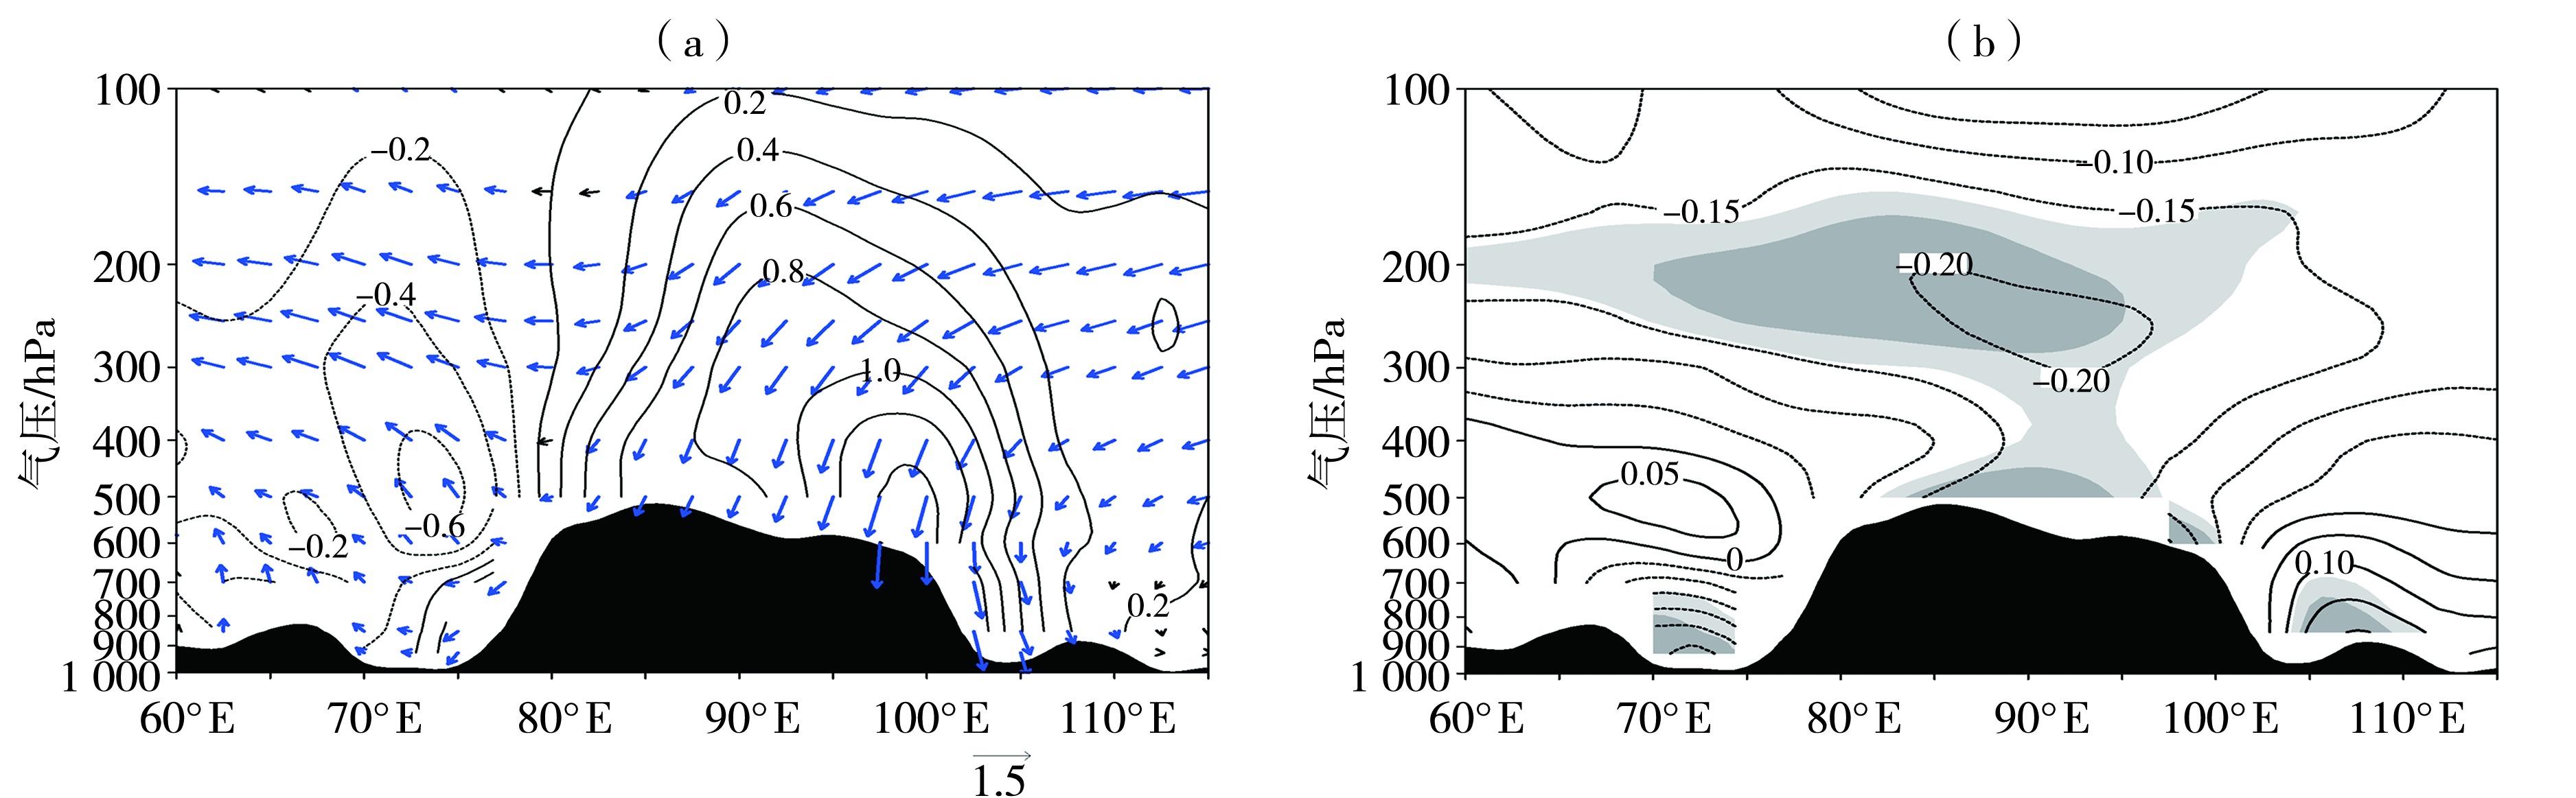
Fig.9 The longitude-height sections of the vertical velocity anomalies (contours, Unit: Pa·s-1), wind field anomalies (arrows, Unit: m·s-1) (a) and temperature anomaly fields (b, Unit: °C) averaged over 28°N-40°N in the same period regressed by using the negative ITPE in summer from 1979 to 2022 (The confidence level of blue arrows is 90%, the same as below )
Fig.9 The longitude-height sections of the vertical velocity anomalies (contours, Unit: Pa·s-1), wind field anomalies (arrows, Unit: m·s-1) (a) and temperature anomaly fields (b, Unit: °C) averaged over 28°N-40°N in the same period regressed by using the negative ITPE in summer from 1979 to 2022 (The confidence level of blue arrows is 90%, the same as below )
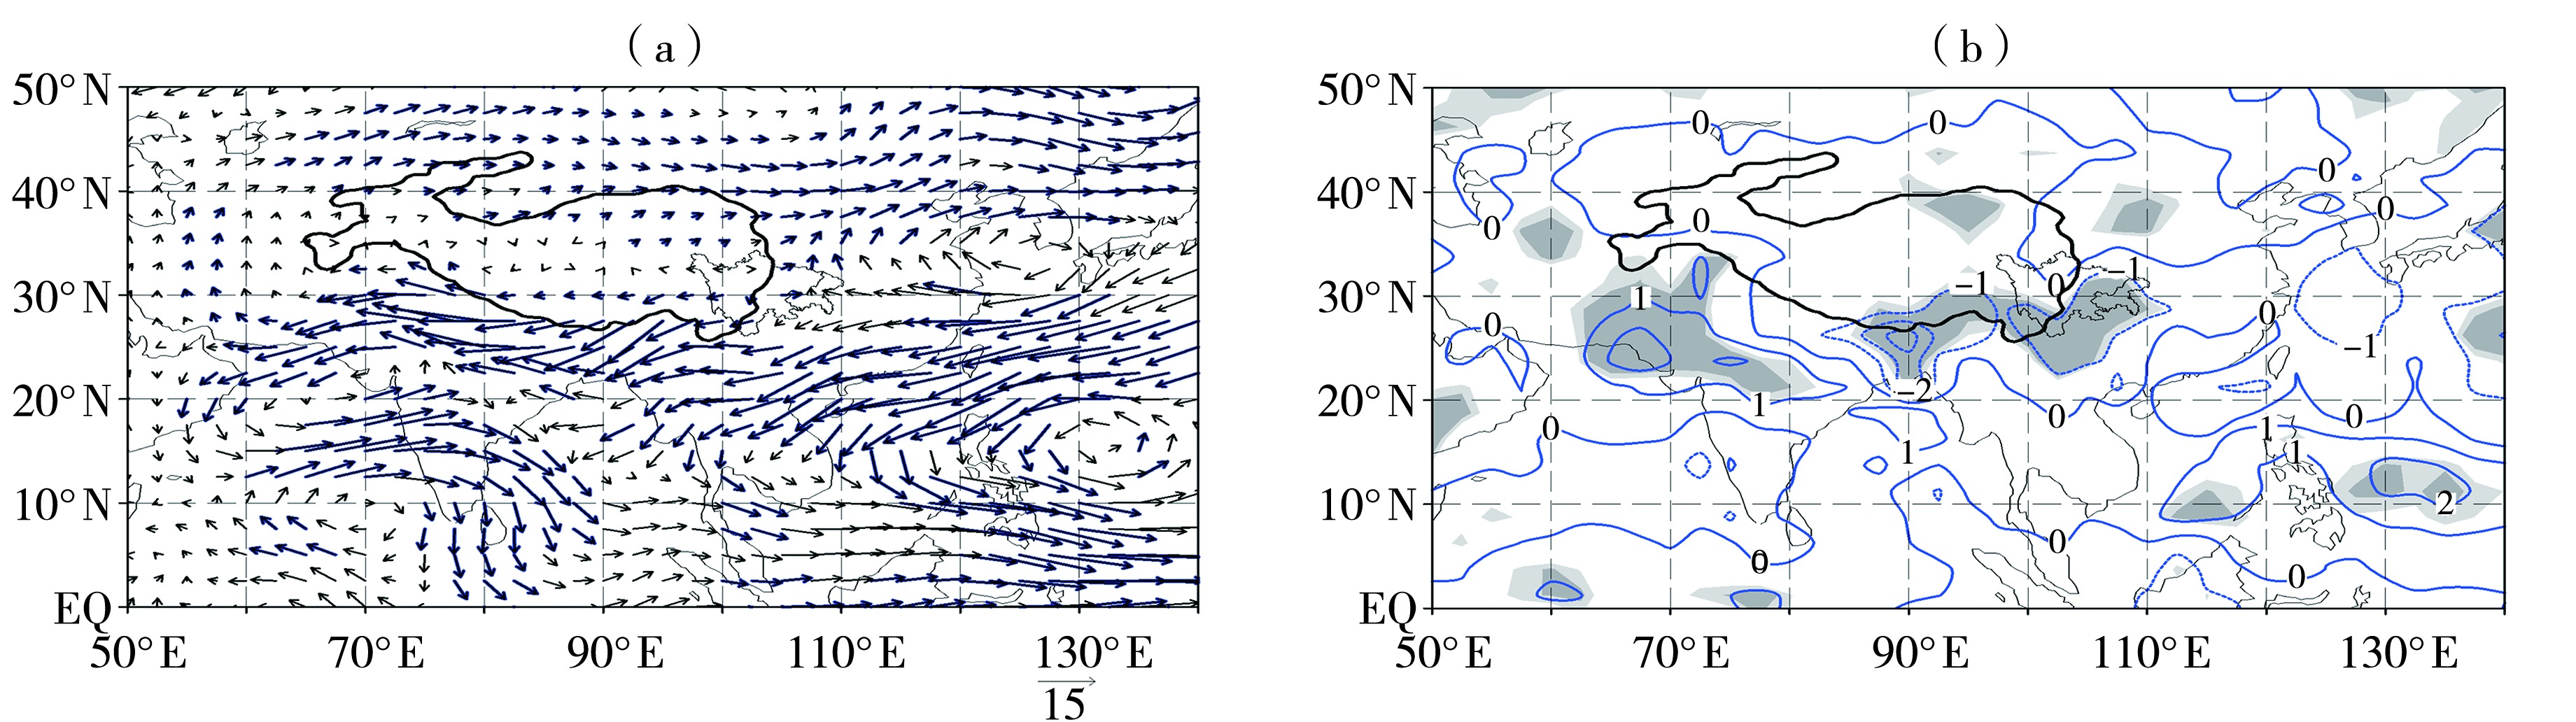
Fig.10 The vertically integrated water vapour flux of the whole layer (a, Unit: g·cm-2·s-1) and GPCP precipitation (b, Unit: mm·day-1) in the same period regressed by using the negative ITPE in summer from 1979 to 2022
Fig.10 The vertically integrated water vapour flux of the whole layer (a, Unit: g·cm-2·s-1) and GPCP precipitation (b, Unit: mm·day-1) in the same period regressed by using the negative ITPE in summer from 1979 to 2022

Fig.11 The average total cloud cover (a, Unit: %) and the downward solar shortwave radiation fluxes (b, Unit: W·m-2) regressed by using the negative ITPE in summer from 1979 to 2022
Fig.11 The average total cloud cover (a, Unit: %) and the downward solar shortwave radiation fluxes (b, Unit: W·m-2) regressed by using the negative ITPE in summer from 1979 to 2022
| [1] | 岑思弦, 陈文, 胡鹏, 等, 2021. 南亚高压演变过程及其变异机制研究进展[J]. 高原气象, 40(6):1304-1 317. |
| [2] | 岑思弦, 巩远发, 赖欣, 2014. 青藏高原及其周围地区大气热源对川渝盆地夏季降水的影响[J]. 高原气象, 33(5): 1 182-1 189. |
| [3] | 陈丹, 周长艳, 齐冬梅, 2019. 夏季青藏高原及周边大气热源与四川盆地暴雨的关系[J]. 高原气象, 38(6): 1 149-1 157. |
| [4] |
陈笑笑, 黄治勇, 秦鹏程, 等, 2024. 长江中游夏季高温异常的大气环流和海温特征[J]. 干旱气象, 42(4): 553-562.
DOI |
| [5] |
崔洋, 常倬林, 余莲, 等, 2017. 青藏高原春季地表非绝热加热异常对东亚夏季风强度的影响[J]. 干旱气象, 35(1): 1-11.
DOI |
| [6] | 段安民, 张萍, 2022. 青藏高原大气热源年际变率及其驱动因子[J]. 大气科学, 46(2): 455-472. |
| [7] | 范旭燕, 李跃清, 2022. 夏季青藏高原热源对下游降水影响的研究进展[J]. 高原山地气象研究, 42(4): 60-66. |
| [8] | 高洁, 肖红茹, 郭善云, 2023. 2022年夏季四川持续高温干旱特征及成因分析[J]. 沙漠与绿洲气象, 17(5): 118-126. |
| [9] | 刘屹岷, 吴国雄, 宇如聪, 等, 2001. 热力适应、过流、频散和副高Ⅱ.水平非均匀加热与能量频散[J]. 大气科学, 25(3):317-328. |
| [10] | 罗连升, 段春锋, 毕云, 等, 2016. 春季青藏高原大气热源与长江中下游盛夏高温的关系[J]. 气象科学, 36(5): 614-621. |
| [11] | 罗小青, 徐建军, 2019. 青藏高原大气热源及其估算的不确定性因素[J]. 气候变化研究进展, 15(1):33-40. |
| [12] | 齐冬梅, 李跃清, 李英, 等, 2010. 夏季青藏高原东部大气热源变化及其对相邻区域气候的影响[J]. 干旱气象, 28(2):113-120. |
| [13] | 孙蕊, 邓彪, 王顺久, 等, 2023. 2022年夏季四川省区域性高温和干旱过程监测评估[J]. 高原山地气象研究, 43(2): 72-80. |
| [14] |
孙昭萱, 张强, 孙蕊, 等, 2022. 2022年西南地区极端高温干旱特征及其主要影响[J]. 干旱气象, 40(5): 764-770.
DOI |
| [15] | 谭子渊, 2023. 青藏高原对周边地区极端天气气候的影响[D]. 兰州: 兰州大学. |
| [16] | 王美蓉, 郭栋, 钟珊珊, 2019. 多源资料在青藏高原大气热源计算中的适用性分析[J]. 气象, 45(12): 1 718-1 726. |
| [17] | 王婷, 蒋兴文, 衡志炜, 等, 2024. 土地利用类型影响四川盆地一次高温过程的模拟研究[J]. 高原山地气象研究, 44(3): 17-27. |
| [18] | 王政明, 李国平, 2023. 基于热源作用的青藏高原东坡一次夜间暴雨的诊断分析[J]. 沙漠与绿洲气象, 17(1): 96-103. |
| [19] | 魏凤英, 2007. 现代气候统计诊断与预测技术[M]. 2版. 北京: 气象出版社: 37-38. |
| [20] | 温敏, 施晓晖, 2006. 1998年夏季西太副高活动与凝结潜热加热的关系[J]. 高原气象, 25 (4): 616-623. |
| [21] | 吴国雄, 刘屹岷, 等何编,, 2018. 青藏高原感热气泵影响亚洲夏季风的机制[J]. 大气科学, 42(3): 488-504. |
| [22] | 吴遥, 唐红玉, 蒋兴文, 等, 2019. 重庆市一次特强区域性高温天气过程诊断[J]. 干旱气象, 37(5):817-826. |
| [23] |
杨静坤, 李谢辉, 雷沁雅, 等, 2024. 四川省极端气温事件与城镇化发展的关联影响[J]. 干旱气象, 42(5): 744-754.
DOI |
| [24] | 姚秀萍, 张硕, 闫丽朱, 2019. 青藏高原大气热源及其影响的研究进展[J]. 大气科学学报, 42(5):641-651. |
| [25] |
张琪, 李跃清, 任景轩, 2018. 青藏高原东侧不同云类对气温变化影响的初步分析[J]. 高原气象, 37(3): 734-746.
DOI |
| [26] | 张小军, 马学谦, 田建兵, 2017. 1961—2015年青海省总云量时空变化特征及影响因子[J]. 干旱气象, 35(4):626-633. |
| [27] | 张镇宏, 蔡景就, 乔云亭, 等, 2019. 青藏高原夏季大气视热源与中国东部降水的关系的年代际变化[J]. 大气科学, 43(5): 990-1 004. |
| [28] |
郑丽君, 肖安, 李浙华, 2024. 江西大气整层可降水量特征及其与暴雨的关系[J]. 干旱气象, 42(5): 755-766
DOI |
| [29] | 周秋雪, 冯良敏, 陈朝平, 等, 2024. 2022年四川省复杂地形下持续性极端高温特征与模式误差分析[J]. 高原山地气象研究, 44(3): 102-108. |
| [30] | 周长艳, 张顺谦, 齐冬梅, 等, 2013. 近50年四川高温变化特征及其影响[J]. 高原气象, 32(6):1720-1 728. |
| [31] | ADLER R F, HUFFMAN G J, CHANG A, et al, 2003. The version-2 global precipitation climatology project (GPCP) monthly precipitation analysis (1979-Present)[J]. Journal of Hydrometeorology, 4(6): 1 147-1 167. |
| [32] | CHANG F L, LI Z Q, 2005. A near-global climatology of single-layer and overlapped clouds and their optical properties retrieved from Terra/MODIS data using a new algorithm[J]. Journal of Climate, 18(22): 4 752-4 771. |
| [33] | DUAN A M, WANG M R, LEI Y H, et al, 2013. Trends in summer rainfall over China associated with the Tibetan Plateau sensible heat source during 1980-2008[J]. Journal of Climate, 26(1): 261-275. |
| [34] | DUAN A M, WU G X, 2005. Role of the Tibetan Plateau thermal forcing in the summer climate patterns over subtropical Asia[J]. Climate Dynamics, 24(7): 793-807. |
| [35] | HUANG X M, ZHANG T T, JIANG X W, et al, 2021. Interannual variability of mid-summer heat wave frequency over the Sichuan Basin[J]. International Journal of Climatology, 41(10): 5 036-5 050. |
| [36] | KALNAY E, KANAMITSU M, KISTLER R, et al, 1996. The NCEP/NCAR 40-year reanalysis project[J]. Bulletin of American Meteorological Society, 77: 437-471. |
| [37] | LAI X, GONG Y, 2017. Relationship between atmospheric heat source over the Tibetan Plateau and precipitation in the Sichuan-Chongqing region during summer[J]. Journal of Meteorological Research, 31(3): 555-566. |
| [38] | WANG B, BAO Q, HOSKINS B, et al, 2008. Tibetan Plateau warming and precipitation changes in East Asia[J]. Geophysical Research Letters, 35(14): L14702. DOI:10.1029/2008gl034330. |
| [39] | WU G X, DUAN A M, LIU Y M, et al, 2015. Tibetan Plateau climate dynamics: Recent research progress and outlook[J]. National Science Review, 2(1): 100-116. |
| [40] | YANAI M, ESBENSEN S, CHU J H, 1973. Determination of bulk properties of tropical cloud clusters from large-scale heat and moisture budgets[J]. Journal of the Atmospheric Sciences, 30(4): 611-627. |
| Viewed | ||||||
|
Full text |
|
|||||
|
Abstract |
|
|||||