Journal of Arid Meteorology ›› 2025, Vol. 43 ›› Issue (1): 41-53.DOI: 10.11755/j.issn.1006-7639-2025-01-0041
• Articles • Previous Articles Next Articles
Characteristics of low-level wind during typical sudden precipitation processes at the northern foot of Qinling Mountains in midsummer
LIU Jiahuimin1,2( ), LI Ming1,2(), OUYANG Yu1,2, JI Qing1,2, WANG Qingxia3, LI Wenyao1,2, LI Hanyu4
- 1. Shaanxi Meteorological Observatory,Xi’an 710014,China
2. Key Laboratory of Eco-Environment and Meteorology for the Qinling Mountains and Loess Plateau,Xi’an 710016,China
3. Hunan Meteorological Observatory,Changsha 410118,China
4. Baoji Meteorological Bureau of Shaanxi Province,Baoji 721006,Shaanxi,China
-
Received:2024-03-04Revised:2024-05-27Online:2025-02-28Published:2025-03-14
秦岭北麓盛夏典型突发性降水过程中低层风特征
刘嘉慧敏1,2(), 李明1,2(), 欧阳雨1,2, 吉庆1,2, 王青霞3, 李文耀1,2, 李涵钰4
- 1.陕西省气象台,陕西 西安 710014
2.秦岭和黄土高原生态环境气象重点实验室,陕西 西安 710016
3.湖南省气象台,湖南 长沙 410118
4.陕西省宝鸡市气象局,陕西 宝鸡 721006
-
通讯作者:李明(1974—),男,硕士,正高级工程师,主要从事灾害性天气预报研究。E-mail:467665085@qq.com。 -
作者简介:刘嘉慧敏(1989—),女,硕士,高级工程师,主要从事灾害性天气预报研究。E-mail:857392276@qq.com。 -
基金资助:中国气象局复盘总结专项(FPZJ2024-131);秦岭和黄土高原生态环境气象重点实验室重点课题项目(2023K-2);中国气象局创新发展专项(CXFZ2025Q020);中国气象局气象能力提升联合研究专项重点项目(24NLTSZ003)
CLC Number:
Cite this article
LIU Jiahuimin, LI Ming, OUYANG Yu, JI Qing, WANG Qingxia, LI Wenyao, LI Hanyu. Characteristics of low-level wind during typical sudden precipitation processes at the northern foot of Qinling Mountains in midsummer[J]. Journal of Arid Meteorology, 2025, 43(1): 41-53.
刘嘉慧敏, 李明, 欧阳雨, 吉庆, 王青霞, 李文耀, 李涵钰. 秦岭北麓盛夏典型突发性降水过程中低层风特征[J]. 干旱气象, 2025, 43(1): 41-53.
share this article
Add to citation manager EndNote|Ris|BibTeX
URL: http://www.ghqx.org.cn/EN/10.11755/j.issn.1006-7639-2025-01-0041

Fig.1 Schematic diagram of the study area (The red triangle represents the location of Chang’an Station; the color shaded is for terrain,Unit: m)
Fig.1 Schematic diagram of the study area (The red triangle represents the location of Chang’an Station; the color shaded is for terrain,Unit: m)
Tab.1 Wind profile radar parameters at Chang’an Station
| 类别 | 参数值 |
|---|---|
| 测量范围 | 水平风速:0~60 m·s-1;垂直风速:±20 m·s-1;风向:0~360° |
| 高度分辨率 | 60、120、240 m |
| 时间分辨率 | 3波束≤6 min,5波束≤0 min(单位观测时间1 min) |
| 径向速度分辨率 | ≤0.2 m·s-1 |
| 风速测量精度 | ≤1.5 m·s-1 |
| 风向测量精度 | ≤10° |
Tab.1 Wind profile radar parameters at Chang’an Station
| 类别 | 参数值 |
|---|---|
| 测量范围 | 水平风速:0~60 m·s-1;垂直风速:±20 m·s-1;风向:0~360° |
| 高度分辨率 | 60、120、240 m |
| 时间分辨率 | 3波束≤6 min,5波束≤0 min(单位观测时间1 min) |
| 径向速度分辨率 | ≤0.2 m·s-1 |
| 风速测量精度 | ≤1.5 m·s-1 |
| 风向测量精度 | ≤10° |

Fig.2 The spatial distribution of 24 h precipitation (color dots, Unit: mm) at different stations at the northern foot of Qinling Mountains from 20:00 on 5 to 20:00 on 6 August 2023 (a), from 20:00 on 12 to 20:00 on 13 July 2023 (c) and from 08:00 on 3 to 08:00 on 4 August 2022 (e), and the evolution of hourly precipitation at Chang’an Station from 08:00 to 17:00 on 6 August 2023 (b), from 20:00 on 12 to 13:00 on 13 July 2023 (d), from 16:00 to 23:00 on 4 August 2022 (f)
Fig.2 The spatial distribution of 24 h precipitation (color dots, Unit: mm) at different stations at the northern foot of Qinling Mountains from 20:00 on 5 to 20:00 on 6 August 2023 (a), from 20:00 on 12 to 20:00 on 13 July 2023 (c) and from 08:00 on 3 to 08:00 on 4 August 2022 (e), and the evolution of hourly precipitation at Chang’an Station from 08:00 to 17:00 on 6 August 2023 (b), from 20:00 on 12 to 13:00 on 13 July 2023 (d), from 16:00 to 23:00 on 4 August 2022 (f)

Fig.3 The 500 hPa geopotential height field (contours, Unit: gpm), temperature difference between 850 hPa and 500 hPa (the color shaded, Unit: ℃) and 700 hPa wind field (wind vectors, Unit: m·s-1) at 08:00 on 6 August 2023 (a), 20:00 on 12 July 2023 (b), 14:00 on 3 August 2022 (c)
Fig.3 The 500 hPa geopotential height field (contours, Unit: gpm), temperature difference between 850 hPa and 500 hPa (the color shaded, Unit: ℃) and 700 hPa wind field (wind vectors, Unit: m·s-1) at 08:00 on 6 August 2023 (a), 20:00 on 12 July 2023 (b), 14:00 on 3 August 2022 (c)
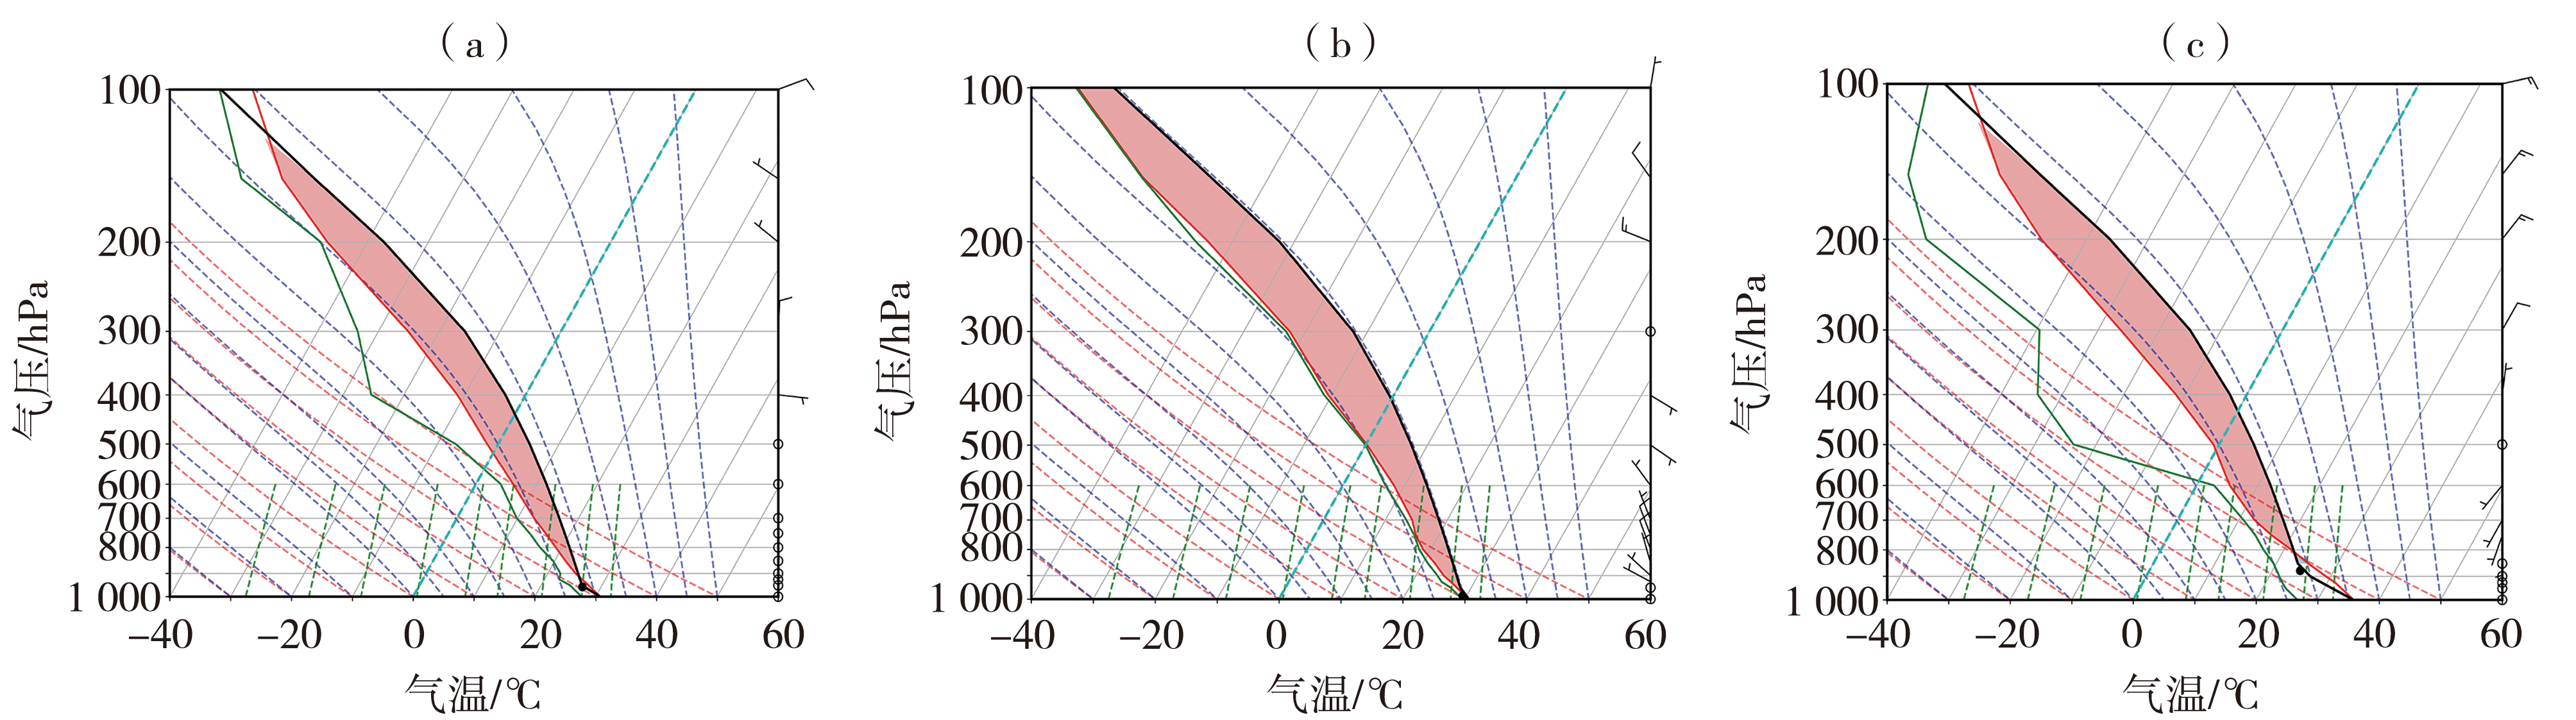
Fig.4 The T-ln P diagram of Chang’an sounding Station at 08:00 on 6 August 2023 (a),20:00 on 12 July 2023 (b),14:00 on 3 August 2022 (c) (The black solid line represents the temperature curve,the green solid line represents the equal saturated mixing ratio curve,and the red line represents stratification curve)
Fig.4 The T-ln P diagram of Chang’an sounding Station at 08:00 on 6 August 2023 (a),20:00 on 12 July 2023 (b),14:00 on 3 August 2022 (c) (The black solid line represents the temperature curve,the green solid line represents the equal saturated mixing ratio curve,and the red line represents stratification curve)
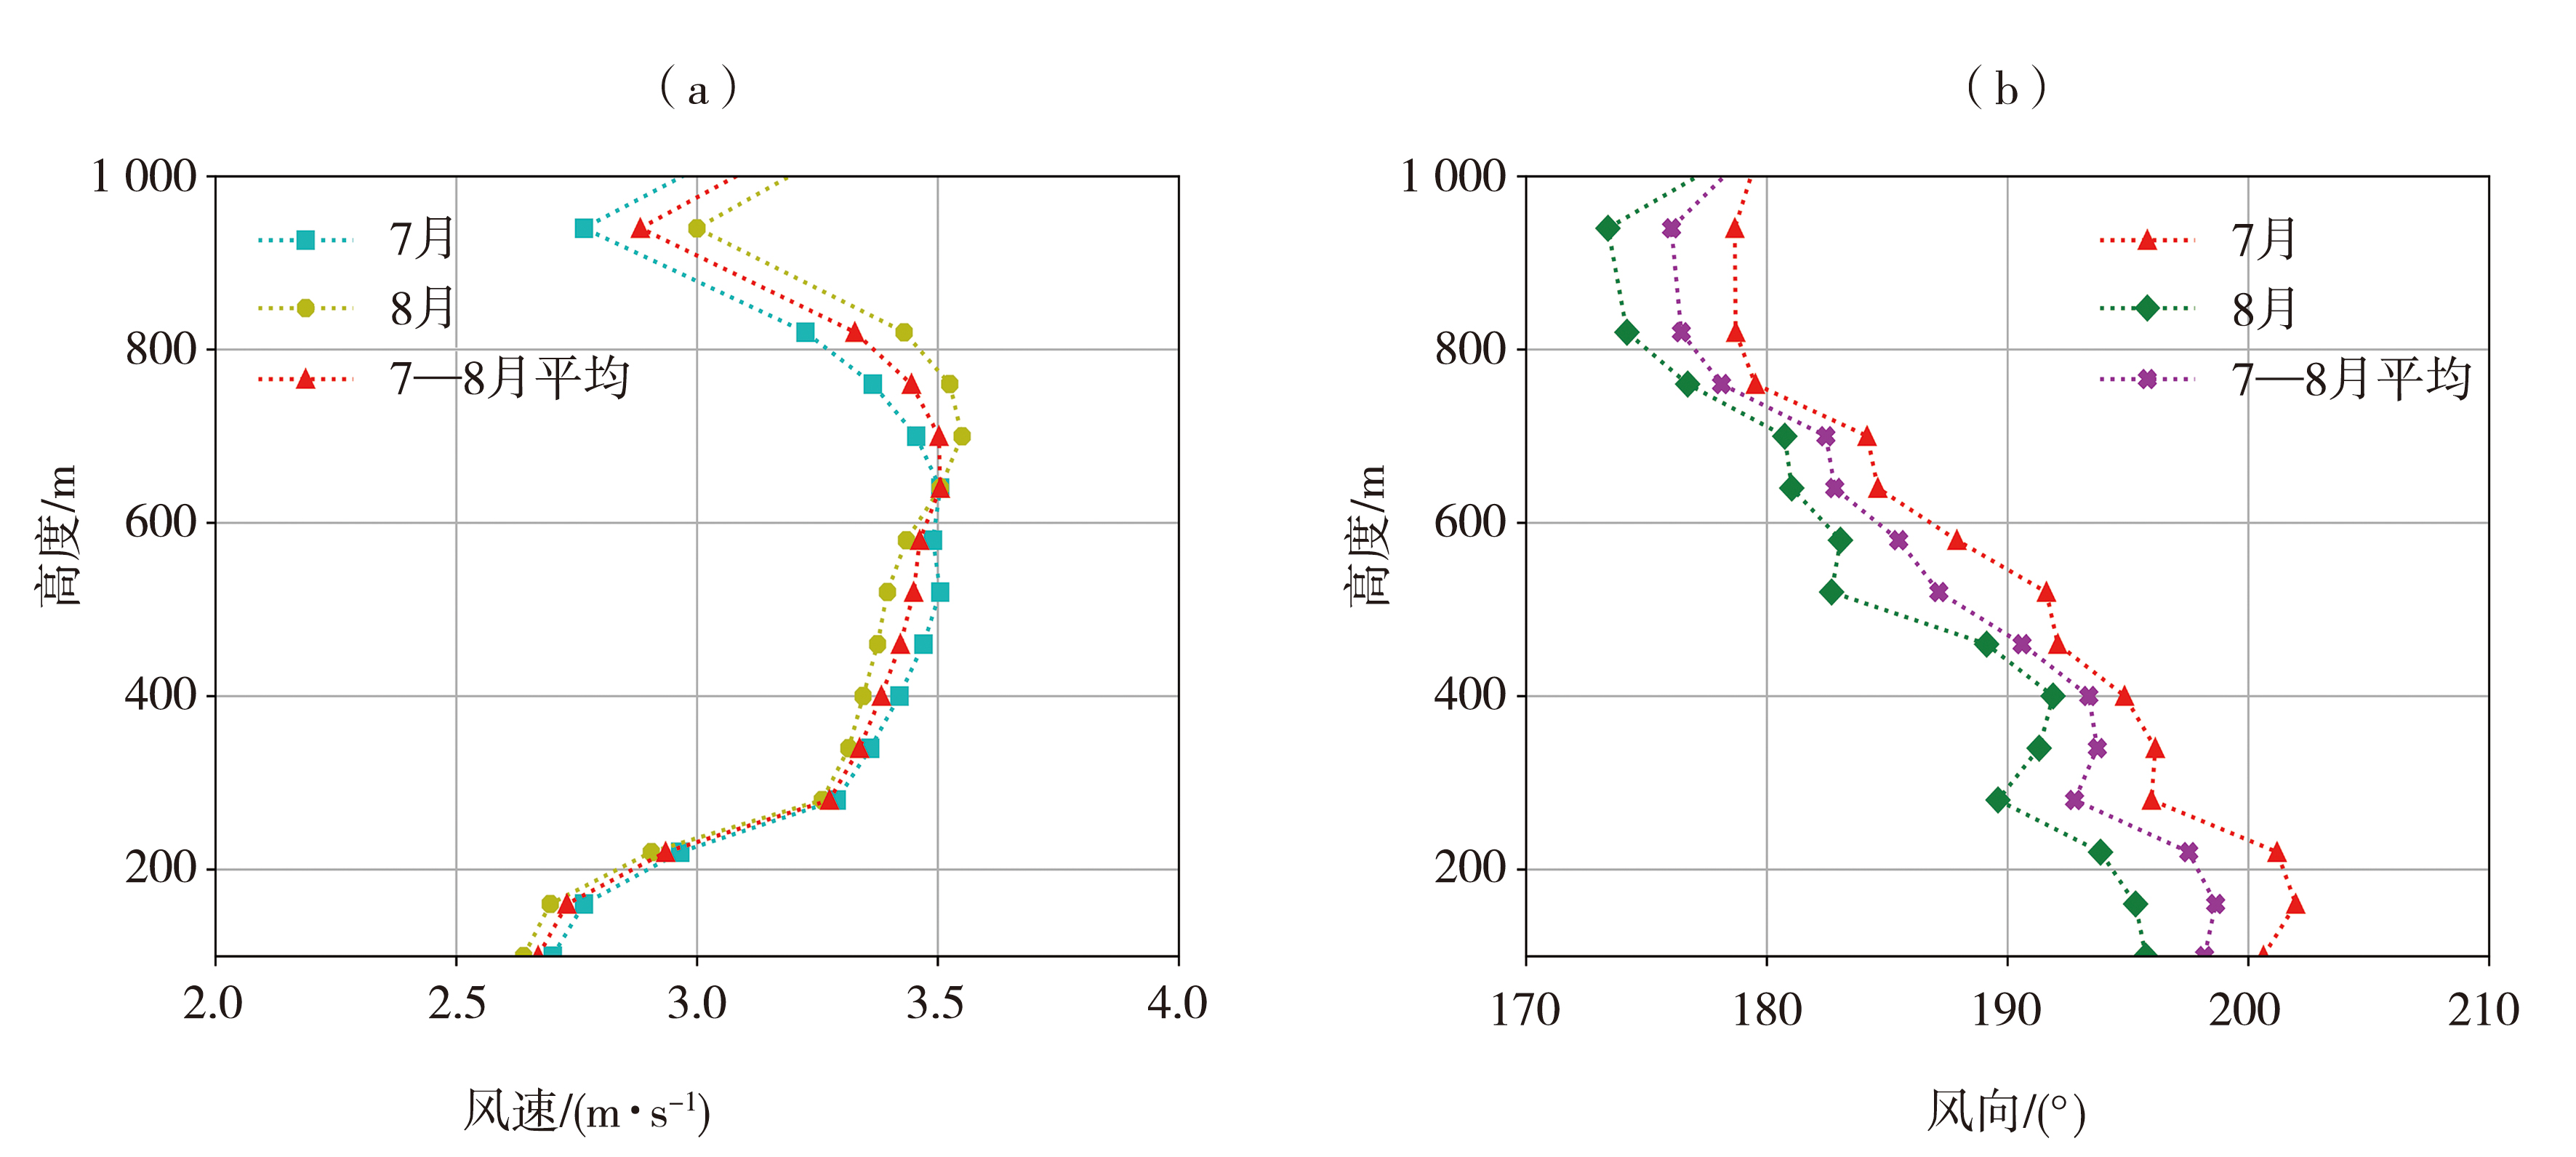
Fig.5 The variation of average wind speed (a) and wind direction (b) with height in the low layer over Chang'an Station from July to August during 2021-2023
Fig.5 The variation of average wind speed (a) and wind direction (b) with height in the low layer over Chang'an Station from July to August during 2021-2023

Fig.6 Hourly variation of horizontal wind speed (a),wind vectors (b) in lower layer over Chang'an Station from July to August during 2021-2023 (Unit: m·s-1)
Fig.6 Hourly variation of horizontal wind speed (a),wind vectors (b) in lower layer over Chang'an Station from July to August during 2021-2023 (Unit: m·s-1)

Fig.7 Hourly variation of the low layer wind (wind vectors, Unit: m·s-1), precipitation (green column) (a, c, e) and surface 3 h pressure change, air temperature, dew point temperature and temperature change in the past 24 h (b, d, f) at Chang’an Station during Process I (a, b), Process Ⅱ (c, d) and Process Ⅲ (e, f)
Fig.7 Hourly variation of the low layer wind (wind vectors, Unit: m·s-1), precipitation (green column) (a, c, e) and surface 3 h pressure change, air temperature, dew point temperature and temperature change in the past 24 h (b, d, f) at Chang’an Station during Process I (a, b), Process Ⅱ (c, d) and Process Ⅲ (e, f)

Fig.8 The composite reflectivity factor (Unit: dBZ) from Xi’an Doppler radar at different times during Process I (a, b, c), Process Ⅱ (d, e, f) and Process Ⅲ (g, h i)
Fig.8 The composite reflectivity factor (Unit: dBZ) from Xi’an Doppler radar at different times during Process I (a, b, c), Process Ⅱ (d, e, f) and Process Ⅲ (g, h i)

Fig.9 The spatial distribution of potential pseudo-equivalent temperature (isolines, Unit: K) and frontogenesis function (the color shaded, Unit: 10-9 K·m-1·s-1) at 925 hPa over Chang’an and surrounding areas (a, c, e), the longitude-height sections of the potential pseudo-equivalent temperature (isolines, Unit: K), frontogenesis function (the color shaded, Unit: 10-9 K·m-1·s-1) and wind field (wind vectors, Unit: m·s-1) along the latitude of the precipitation center (b, d, f) at 10:00 on 6 August 2023 (a, b), 19:00 on 12 July 2023 (c, d), 17:00 on 3 August 2022 (e, f) (The red box represents the frontogenetical area at the northern foot of Qinling Mountains, the gray shaded for terrain)
Fig.9 The spatial distribution of potential pseudo-equivalent temperature (isolines, Unit: K) and frontogenesis function (the color shaded, Unit: 10-9 K·m-1·s-1) at 925 hPa over Chang’an and surrounding areas (a, c, e), the longitude-height sections of the potential pseudo-equivalent temperature (isolines, Unit: K), frontogenesis function (the color shaded, Unit: 10-9 K·m-1·s-1) and wind field (wind vectors, Unit: m·s-1) along the latitude of the precipitation center (b, d, f) at 10:00 on 6 August 2023 (a, b), 19:00 on 12 July 2023 (c, d), 17:00 on 3 August 2022 (e, f) (The red box represents the frontogenetical area at the northern foot of Qinling Mountains, the gray shaded for terrain)

Fig.10 The spatial distribution of wind field (wind vectors,Unit: m·s-1) and horizontal divergence (black dotted lines,only showing the values less than 0,Unit: 10-5s-1) at 925 hPa over Chang’an and surrounding areas at 10:00 on 6 August 2023 (a),19:00 on 12 July 2023 (b),17:00 on 3 August 2022 (c)
Fig.10 The spatial distribution of wind field (wind vectors,Unit: m·s-1) and horizontal divergence (black dotted lines,only showing the values less than 0,Unit: 10-5s-1) at 925 hPa over Chang’an and surrounding areas at 10:00 on 6 August 2023 (a),19:00 on 12 July 2023 (b),17:00 on 3 August 2022 (c)

Fig.11 Time-height sections of horizontal divergence (the color shaded,Unit: 10-5s-1) and vertical velocity (isolines,Unit: Pa·s-1) along the heavy precipitation center from 06:00 to 14:00 on 6 August 2023 (a),from 12:00 on 12 to 14:00 on 13 July 2023 (b),from 08:00 to 24:00 on 3 August 2022 (c)
Fig.11 Time-height sections of horizontal divergence (the color shaded,Unit: 10-5s-1) and vertical velocity (isolines,Unit: Pa·s-1) along the heavy precipitation center from 06:00 to 14:00 on 6 August 2023 (a),from 12:00 on 12 to 14:00 on 13 July 2023 (b),from 08:00 to 24:00 on 3 August 2022 (c)

Fig.12 The conceptual model of sudden precipitation caused by low layer westerly (a) and easterly (b) cold air intrusion at the northern foot of Qinling Mountain in midsummer (the color shaded for altitude,Unit: m)
Fig.12 The conceptual model of sudden precipitation caused by low layer westerly (a) and easterly (b) cold air intrusion at the northern foot of Qinling Mountain in midsummer (the color shaded for altitude,Unit: m)
| [1] | 陈光宇, 陈勇明, 沈杭锋, 等, 2023. 2018年1月杭州市连续雨雪过程中雨雪转换气象条件分析[J]. 气象与环境科学, 46(2): 67-75. |
| [2] | 陈立波, 许凌轩, 张佳婷, 等, 2024. 风廓线雷达资料在典型天气过程预报预警中的应用[J]. 高原山地气象研究, 44(3): 85-94. |
| [3] | 陈小婷, 赵强, 高宇星, 等, 2023. 秦岭北麓两次下山雷暴不同演变特征分析[J]. 气象, 49(8): 932-945. |
| [4] |
蔡新玲, 蔡依晅, 叶殿秀, 等, 2025. 1981—2020年陕西省暖季不同历时强降水时空变化特征[J]. 干旱区地理, 48(1):1-10.
DOI |
| [5] |
傅朝, 刘维成, 宋兴宇, 等, 2022. 西北干旱区一次极端暴雨局地性增强的对流环境特征[J]. 干旱气象, 40(6): 909-921.
DOI |
| [6] |
苟阿宁, 吴翠红, 王玉娟, 等, 2022. 基于风廓线雷达的湖北梅雨期暴雨中小尺度特征[J]. 干旱气象, 40(1): 84-94.
DOI |
| [7] | 花丛, 刘超, 张恒德, 2017. 风廓线雷达资料在北京秋季雾霾天气过程分析中的应用[J]. 气象科技, 45(5): 870-875. |
| [8] | 刘胜男, 冯典, 郭大梅, 等, 2023. 秦岭山区东麓一次短时强降水特征及成因分析[J]. 中低纬山地气象, 47(1):82-89. |
| [9] | 雷蕾, 孙继松, 王华, 等, 2014. 偏东风冷空气与地形相互作用背景下北京局地强降水成因分析[J]. 暴雨灾害, 33(4): 325-332. |
| [10] | 李明, 2017. 基于ECMWF细网格模式的短时强降水客观概率预报方法研究[J]. 热带气象学报, 33(6): 812-821. |
| [11] | 毛文茜, 肖霞, 张文煜, 等, 2022. 风廓线雷达探测模式组合应用分析[J]. 干旱气象, 40(6): 1 092-1 098. |
| [12] | 钱卓蕾, 沈哲文, 左骏, 2024. 秋台风“梅花”造成浙江极端降水成因分析[J]. 海洋预报, 41(2): 104-116. |
| [13] | 王楠, 赵强, 井宇, 等, 2018. 秦岭北麓一次冷锋触发的短时强降水成因分析[J]. 高原气象, 37(5): 1 277-1 288. |
| [14] | 王晓芳, 李山山, 汪小康, 等, 2022. 秦巴山脉“4·23”区域性暴雨的若干异常特征[J]. 气象, 48(3): 345-356. |
| [15] | 吴古会, 彭芳, 李彦霖, 等, 2024. 贵州一次短历时极端暴雨的形成过程及机理分析[J]. 高原山地气象研究, 44(3): 38-47. |
| [16] |
武麦凤, 乔舒婷, 郭大梅, 等, 2025. 秦岭山脉南北麓暴雨触发条件对比分析[J]. 高原气象, 44(1):178-190.
DOI |
| [17] | 肖玮, 傅朝, 徐丽丽, 等, 2021. 陇东南汛前期2次斜压锋生类短时强降水过程动力特征对比[J]. 干旱气象, 39(4): 641-651. |
| [18] | 杨柳, 赵俊虎, 毛明策, 等, 2024. CMIP6模式对中国北方季风区盛夏降水的模拟能力评估[J]. 气候与环境研究, 29(5): 549-562. |
| [19] |
张百平, 2019. 中国南北过渡带研究的十大科学问题[J]. 地理科学进展, 38(3): 305-311.
DOI |
| [20] | 张东方, 张涛, 成青燕, 等, 2023. 一次弱天气背景下极端短时强降水过程的风廓线雷达分析[J]. 高原山地气象研究, 43(3): 99-105. |
| [21] |
张宏芳, 潘留杰, 陈昊明, 等, 2020. 秦岭及周边地区暖季降水日变化及其成因分析[J]. 高原气象, 39(5): 935-946.
DOI |
| [22] | 张文龙, 崔晓鹏, 黄荣, 2014. 复杂地形下北京雷暴新生地点变化的加密观测研究[J]. 大气科学, 38(5): 825-837. |
| [23] |
张寅, 樊超, 赵娜, 等, 2017. 长安风廓线雷达测风资料的可靠性验证[J]. 干旱气象, 35(3): 507-515.
DOI |
| [24] |
赵强, 王楠, 高星星, 等, 2021. 西安连续两天短时暴雨的对流条件及触发机制对比分析[J]. 高原气象, 40(4): 801-814.
DOI |
| [25] |
邹倩, 左春艳, 吴政谦, 等, 2024. 基于多源观测资料研究重庆地区一次风雹过程[J]. 干旱气象, 42(4): 598-610.
DOI |
| [26] | MAY P T, JAMESON A R, KEENAN T D, et al, 2001. A comparison between polarimetric radar and wind profiler observations of precipitation in tropical showers[J]. Journal of Applied Meteorology, 40(10): 1 702-1 717. |
| [27] | MAY P T, JAMESON A R, KEENAN T D, et al, 2002. Combined wind profiler/polarimetric radar studies of the vertical motion and microphysical characteristics of tropical sea-breeze thunderstorms[J]. Monthly Weather Review, 130(9): 2 228-2 239. |
| [28] | PAN L J, ZHANG H F, LIU J, et al, 2022. Comparative analysis of SCMOC and models rainstorm forecasting performance in Qinling Mountains and their surrounding areas[J]. Atmosphere, 13(5): 705. DOI:10.3390/atmos13050705. |
| [29] | ZHANG H F, PAN L J, 2022. Diagnostic analysis of multimodel rainstorm forecast for cases based on MODE method[J]. Atmosphere, 13(7): 1 047. DOI:10.3390/atmos13071047. |
| [30] | ZHAO J H, ZHANG H, ZUO J Q, et al, 2022. Oceanic drivers and empirical prediction of interannual rainfall variability in late summer over Northeast China[J]. Climate Dynamics, 58(3): 861-878. |
| [31] | ZHAO J H, ZHOU J, XIONG K G, et al, 2020. Relationship between tropical Indian Ocean SSTA in spring and precipitation of Northeast China in late summer[J]. Journal of Meteorological Research, 33(6): 1 060-1 074. |
| [1] | MAVLAN Kader, LIU Xinhua, LI Yunxiang, GUAN Wenjuan. Analysis of basic characteristics of low-level wind shear in the arid regions of northwest China [J]. Journal of Arid Meteorology, 2024, 42(3): 347-356. |
| [2] | WU Dan,LI Meiqi,GUO Rui,JIA Xiaowei,LIU Hao,LIU Quan. Low-level Wind Shear and Its Weather Situation at Shijiazhuang Zhengding International Airport from 2014 to 2017 [J]. Journal of Arid Meteorology, 2021, 39(5): 775-784. |
| [3] | ZHANG Kaijun, FU Longyan, LI Lanqian, SHAO Aimei. Comparison of Two Lidarbased Alerting Algorithms for Low-level Wind Shear [J]. Journal of Arid Meteorology, 2021, 39(4): 652-661. |
| [4] | MA Li, GUO Yuanyuan, WANG Xiaoli, QIU Guiqiang, QIAO Yu, WANG Chendi. Variation Tendency of Cyclonic Wind Shear in Low-level and Its Causes in North China During 1955-2014 [J]. Journal of Arid Meteorology, 2019, 37(2): 243-251. |
| [5] | JIAO Min, LI Ji, WANG Yang, WANG Ying, HUANG Yan. Large-scale Circulation Characteristics of Anomalous Less Rainfall in Liaoning Province in Midsummer of 2014 [J]. Journal of Arid Meteorology, 2018, 36(5): 751-757. |
| [6] | ZHOU Houfu, DIAO Xiuguang, ZHAO Qian, LI Yaodong, XIA Wenmei. Cause Analysis of a Continuous Downburst Weather [J]. Journal of Arid Meteorology, 2017, 35(4): 641-648. |
| Viewed | ||||||
|
Full text |
|
|||||
|
Abstract |
|
|||||