Journal of Arid Meteorology ›› 2023, Vol. 41 ›› Issue (6): 952-960.DOI: 10.11755/j.issn.1006-7639(2023)-06-0952
• Articles • Previous Articles Next Articles
The response of influenza-like illnesses to short-term weather variability intensity and risk early warning
ZHAO Xiaofang1,2,3( ), FANG Sida1,2,3(), LEI Xiaomei4, LIU Min1,2,3, YU Xiao5, XU Hui4
- 1. Wuhan Regional Climate Center, Wuhan 430074, China
2. Three Gorges National Climatological Observatory, Yichang 443002, Hubei, China
3. Key Open Laboratory of Basin Heavy Rainfall, CMA, Wuhan 430205, China
4. Tongji Hospital, Tongji Medical College, Huazhong University of Science and Technology, Wuhan 430030, China
5. Hubei Provincial Center for Disease Control and Prevention, Wuhan 430070, China
-
Received:2022-11-23Revised:2023-06-16Online:2023-12-31Published:2024-01-10
流感发病对短期天气变化强度的响应及风险预警研究
赵小芳1,2,3(), 方思达1,2,3(), 雷小妹4, 刘敏1,2,3, 余晓5, 徐慧4
- 1.武汉区域气候中心,湖北 武汉 430074
2.三峡国家气候观象台,湖北 宜昌 443002
3.中国气象局流域强降水重点开放实验室,湖北 武汉 430205
4.华中科技大学同济医学院附属同济医院,湖北 武汉 430030
5.湖北省疾病预防控制中心,湖北 武汉 430070
-
通讯作者:方思达(1987—),男,内蒙古赤峰人,高级工程师,主要从事气候与人体健康研究。E-mail:421208920@qq.com 。 -
作者简介:赵小芳(1995—),女,湖北孝感人,工程师,主要从事气象灾害风险评估研究。E-mail:zhaoxf1995@163.com。 -
基金资助:2022年湖北省自然科学基金创新发展联合基金项目(2022CFD127);2021年中国气象局创新发展专项(CXFZ2021J57);2021年湖北省低碳试点专项资金共同资助
CLC Number:
Cite this article
ZHAO Xiaofang, FANG Sida, LEI Xiaomei, LIU Min, YU Xiao, XU Hui. The response of influenza-like illnesses to short-term weather variability intensity and risk early warning[J]. Journal of Arid Meteorology, 2023, 41(6): 952-960.
赵小芳, 方思达, 雷小妹, 刘敏, 余晓, 徐慧. 流感发病对短期天气变化强度的响应及风险预警研究[J]. 干旱气象, 2023, 41(6): 952-960.
share this article
Add to citation manager EndNote|Ris|BibTeX
URL: http://www.ghqx.org.cn/EN/10.11755/j.issn.1006-7639(2023)-06-0952
Tab.1 Summary of influenza surveillance sentinel hospitals in Hubei Province
| 序号 | 哨点医院名称 | 代表地区 |
|---|---|---|
| 1 | 鄂州市中心医院 | 鄂州 |
| 2 | 恩施州中心医院 | 恩施 |
| 3 | 黄冈市中心医院 | 黄冈 |
| 4 | 黄石市第二医院 | 黄石 |
| 5 | 黄石市中心医院(中心院区) | 黄石 |
| 6 | 荆门市第一人民医院 | 荆门 |
| 7 | 荆州市第二人民医院 | 荆州 |
| 8 | 十堰市人民医院 | 十堰 |
| 9 | 十堰市太和医院 | 十堰 |
| 10 | 松滋市人民医院 | 荆州 |
| 11 | 随州市中心医院 | 随州 |
| 12 | 武汉儿童医院 | 武汉 |
| 13 | 武汉市一医院 | 武汉 |
| 14 | 咸宁市中心医院 | 咸宁 |
| 15 | 襄阳市第一人民医院 | 襄阳 |
| 16 | 襄阳市中心医院 | 襄阳 |
| 17 | 孝感市中心医院 | 孝感 |
| 18 | 宜昌市第二人民医院 | 宜昌 |
| 19 | 宜昌市中心人民医院 | 宜昌 |
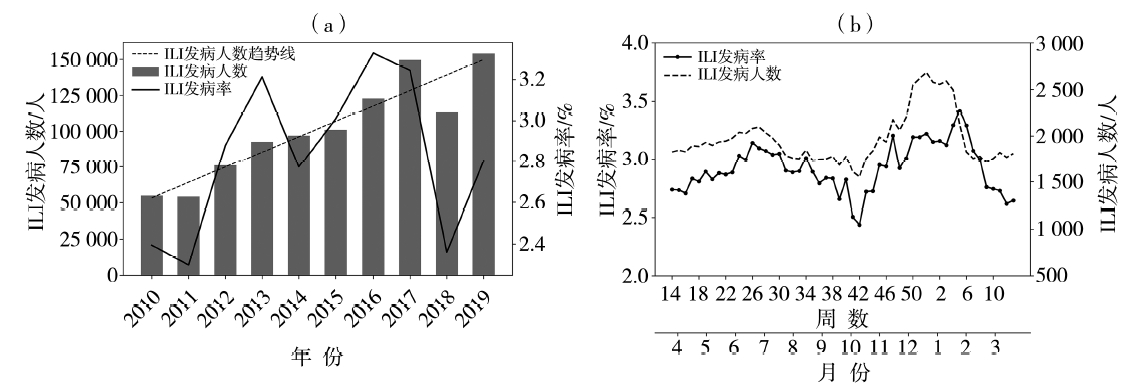
Fig.1 The inter-annual (a) and intra-annual (b) variation of number and morbidity of ILI from 2010 to 2019 in Hubei Province
Fig.1 The inter-annual (a) and intra-annual (b) variation of number and morbidity of ILI from 2010 to 2019 in Hubei Province
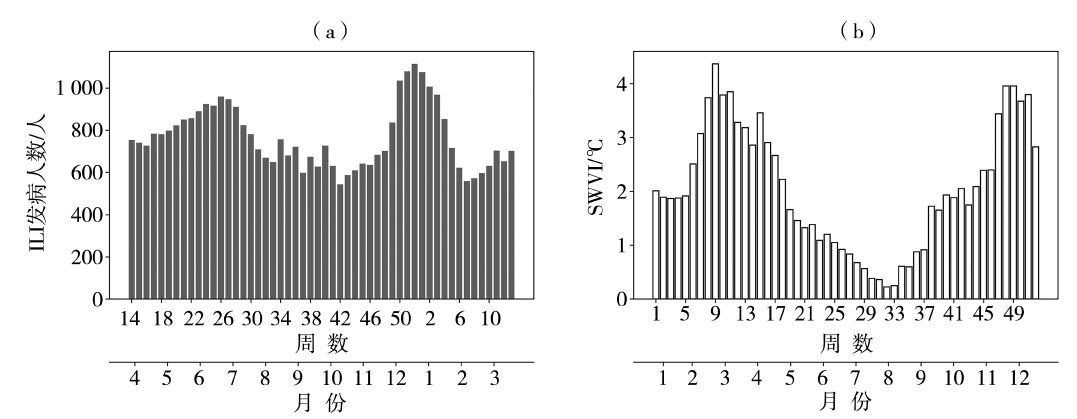
Fig.2 The intra-annual variation of number of ILI cases (a) and index of short-term weather variability intensity (b) in Wuhan during 2009-2019
Fig.2 The intra-annual variation of number of ILI cases (a) and index of short-term weather variability intensity (b) in Wuhan during 2009-2019
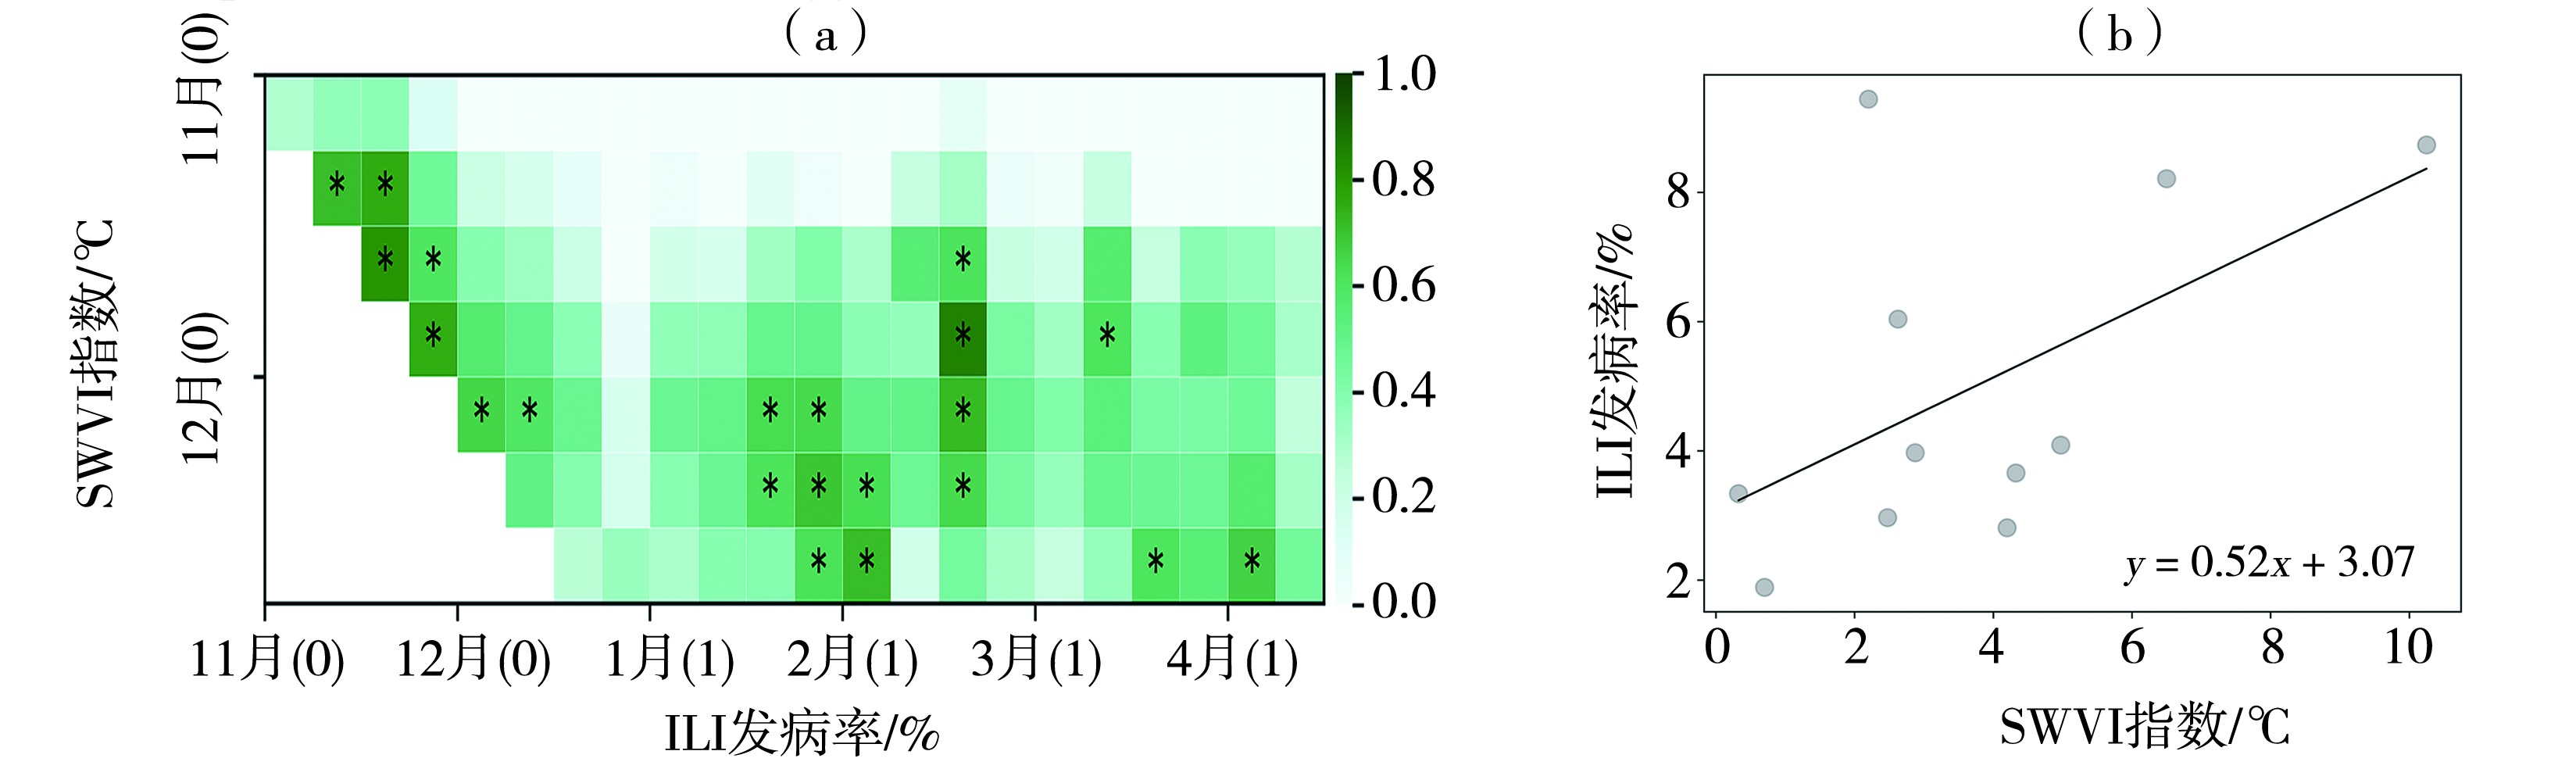
Fig.3 The lag correlation between ILI morbidity and SWVI index (a, 0 represents the current year, 1 represents the next year; the asterisks pass the significant test at α=0.05), and the scatter plot between average SWVI index from November to December and maximum ILI morbidity during November to March of the following year (b) in Wuhan during 2009-2020
Fig.3 The lag correlation between ILI morbidity and SWVI index (a, 0 represents the current year, 1 represents the next year; the asterisks pass the significant test at α=0.05), and the scatter plot between average SWVI index from November to December and maximum ILI morbidity during November to March of the following year (b) in Wuhan during 2009-2020
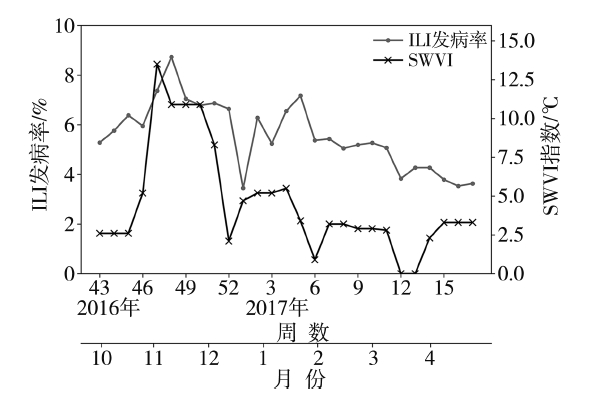
Fig.4 The weekly variation of SWVI and ILI morbidity during influenza outbreak from the 43rd week in 2016 to the 16th week in 2017 in Wuhan
Fig.4 The weekly variation of SWVI and ILI morbidity during influenza outbreak from the 43rd week in 2016 to the 16th week in 2017 in Wuhan

Fig.5 The exposure response relationship between SWVI index and ILI morbidity with a lag of 0 (a) and 2 (b) weeks (a, b), and the lag effect of SWVI index on ILI morbidity (c, d) at the 5th quantile (c, 0.0 ℃) and the 95th quantile (d, 8.0℃) in Wuhan during 2009-2020 (The black solid line is the relative risk, the oblique line areas represent the 95% confidence interval)
Fig.5 The exposure response relationship between SWVI index and ILI morbidity with a lag of 0 (a) and 2 (b) weeks (a, b), and the lag effect of SWVI index on ILI morbidity (c, d) at the 5th quantile (c, 0.0 ℃) and the 95th quantile (d, 8.0℃) in Wuhan during 2009-2020 (The black solid line is the relative risk, the oblique line areas represent the 95% confidence interval)
Tab.2 The relative risks and 95% confidence interval of ILI morbidity caused by SWVI index with different quantiles in Wuhan during 2009-2020
| 滞后时间 | 第5个百分位数(0.0 ℃) | 第95个百分位数(8.0 ℃) |
|---|---|---|
| 滞后0周 | 1.058(0.918~1.219) | 1.117(1.051~1.187)* |
| 滞后1周 | 1.033(0.971~1.099) | 1.043(1.020~1.067)* |
| 滞后2周 | 1.020(0.947~1.099) | 1.016(0.986~1.046) |
| 滞后3周 | 1.013(0.951~1.078) | 1.016(0.988~1.039) |
| 滞后4周 | 1.007(0.960~1.057) | 1.023(1.003~1.043)* |
| 滞后5周 | 1.001(0.948~1.056) | 1.035(1.013~1.058)* |
| 滞后6周 | 0.993(0.936~1.054) | 1.043(1.018~1.068)* |
| 滞后7周 | 0.983(0.933~1.037) | 1.044(1.021~1.066)* |
| 滞后8周 | 0.974(0.929~1.022) | 1.037(1.018~1.056)* |
| 滞后9周 | 0.968(0.909~1.031) | 1.028(1.004~1.053)* |
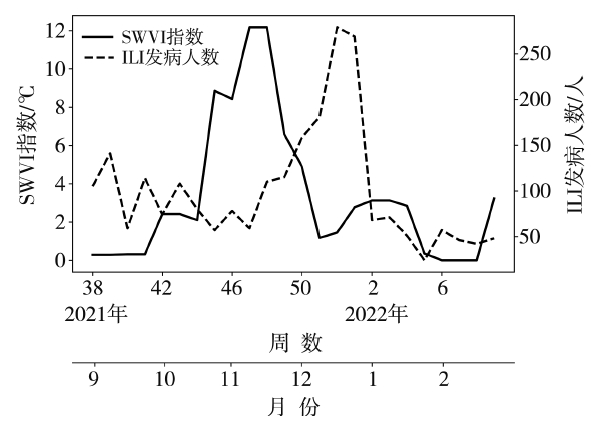
Fig.6 The weekly variation of SWVI index and number of ILI in Wuhan from the 38th week in 2021 to the 9th week in 2022
Fig.6 The weekly variation of SWVI index and number of ILI in Wuhan from the 38th week in 2021 to the 9th week in 2022
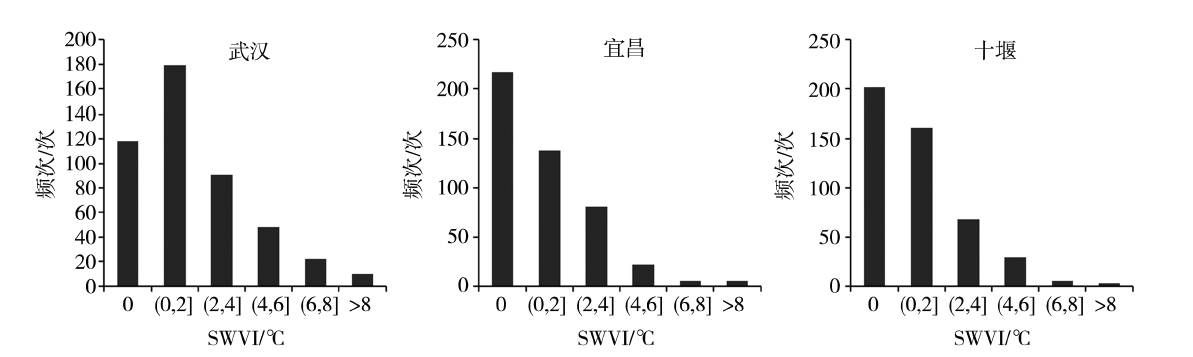
Fig.7 The distribution of occurrence frequency of SWVI index with different grades in typical cities in Hubei from 2009 to 2020
Fig.7 The distribution of occurrence frequency of SWVI index with different grades in typical cities in Hubei from 2009 to 2020
Tab.3 The level classification of ILI incidence risk based on SWVI index
| SWVI指数阈值/℃ | 划分依据 | 预警等级 |
|---|---|---|
| SWVI=0.0 | 无天气波动 | 低 |
| 0.0<SWVI≤5.6 | 模型阈值,SWVI指数对流感发病风险无显著影响 | 较低 |
| 5.6<SWVI<8.0 | SWVI指数的第95个百分位数,流感发病风险增加 | 较高 |
| SWVI≥8.0 | 流感发病风险大幅增加 | 高 |
Tab.3 The level classification of ILI incidence risk based on SWVI index
| SWVI指数阈值/℃ | 划分依据 | 预警等级 |
|---|---|---|
| SWVI=0.0 | 无天气波动 | 低 |
| 0.0<SWVI≤5.6 | 模型阈值,SWVI指数对流感发病风险无显著影响 | 较低 |
| 5.6<SWVI<8.0 | SWVI指数的第95个百分位数,流感发病风险增加 | 较高 |
| SWVI≥8.0 | 流感发病风险大幅增加 | 高 |
| [1] | 陈思齐, 俞敏, 周脉耕, 等, 2021. 基于体感温度-寿命损失年暴露反应关系确定体感温度的健康风险预警阈值研究[J]. 中华流行病学杂志, 42(8): 1 445-1 452. |
| [2] | 邓源, 任翔, 郭玉清, 等, 2023. 2008—2020年我国北方15个城市流感与气象因素的关联性研究[J]. 中华流行病学杂志, 44(5): 765-771. |
| [3] | 方道奎, 周国宏, 冯锦姝, 等, 2019. 深圳市高温热浪健康风险指数的建立和应用评估[J]. 环境卫生学杂志, 9(1): 14-18. |
| [4] | 付之鸥, 鲍昌俊, 李中杰, 等, 2020. 基于“大数据”的流感预警研究进展[J]. 中华流行病学杂志, 41(6): 975-980. |
| [5] |
范进进, 秦鹏程, 史瑞琴, 等, 2022. 气候变化背景下湖北省高温干旱复合灾害变化特征[J]. 干旱气象, 40(5): 780-790.
DOI |
| [6] | 黄照, 刘涛, 许燕君, 等, 2018. 基于死亡数据用DLNM构建气象健康指数[J]. 环境卫生学杂志, 8(5): 368-373. |
| [7] | 黄开龙, 林锦春, 马盼, 等, 2021. 气象条件对深圳市罗湖区上呼吸道感染就诊人数的影响[J]. 干旱气象, 39(6): 995-1 005. |
| [8] | 李瑞盈, 张一博, 杨佳, 等, 2019. 秦皇岛气象因素对儿童下呼吸道疾病就诊人数影响及预测研究[J]. 干旱气象, 37(3): 460-466. |
| [9] | 卢晶晶, 吕劲文, 钱峥, 2016. 宁波市高温中暑气象等级评定方法研究[J]. 气象与环境学报, 32(4): 91-97. |
| [10] | 李国栋, 张俊华, 焦耿军, 等, 2013. 气候变化对传染病爆发流行的影响研究进展[J]. 生态学报, 33(21): 6 762-6 773. |
| [11] | 蒙丽君, 胡国清, 姚梦, 等, 2022. 环境气象因素对新型冠状病毒肺炎传播影响的研究进展[J]. 环境与职业医学, 39(3): 348-352. |
| [12] | 马盼, 王馨梓, 张莉, 等, 2022. 深圳流感发病的气象诱因及预测建模研究[J]. 气象学报, 80(3): 421-432. |
| [13] |
马蕾, 赵蔚, 杨柳, 等, 2023. 宁夏“星空旅游”气候资源适宜度评估[J]. 干旱气象, 41(2): 309-317.
DOI |
| [14] | 秦康, 张业武, 张鹏, 等, 2019. 中国大陆三种流感监测数据的时效性比较[J]. 中华疾病控制杂志, 23(4): 387-391. |
| [15] |
殷宁潞, 李俊林, 洪也, 等, 2023. 辽宁省两县域城市气温对呼吸系统疾病住院人数的影响[J]. 干旱气象, 41(1): 132-142.
DOI |
| [16] | 徐静, 刘华悦, 靳甜甜, 等, 2021. 气温对秦皇岛市儿童呼吸系统疾病的影响[J]. 干旱气象, 39(2): 326-332. |
| [17] | 曾舸, 黄超洋, 王小磊, 等, 2022. 2017—2020年湖南省哨点监测流感样病例流行特征[J]. 实用预防医学, 29(11): 1 342-1 345. |
| [18] | 周艳丽, 张海艳, 王珺, 等, 2021. 北京市东城区流感样病例与气象因素的相关性分析[J]. 中国公共卫生管理, 37(5): 650-653. |
| [19] | 祝寒松, 王明斋, 谢忠杭, 等, 2019. 厦门市流行性感冒发病与气象因素影响[J]. 中国公共卫生, 35(10): 1 404-1 409. |
| [20] | AKAIKE H, 1974. A new look at the statistical model identification[J]. IEEE Transactions on Automatic Control, 19(6): 716-723. |
| [21] | AXELSEN J B, YAARI R, GRENFELL B T, et al, 2014. Multiannual forecasting of seasonal influenza dynamics reveals climatic and evolutionary drivers[J]. Proceedings of the National Academy of Sciences of the United States of America, 111(26): 9 538-9 542. |
| [22] | BRESEE J, HAYDEN F G, 2013. Epidemic influenza-responding to the expected but unpredictable[J]. The New England Journal of Medicine, 368(7): 589-592. |
| [23] |
CAINI S, SPREEUWENBERG P, DONKER G, et al, 2018. Climatic factors and long-term trends of influenza-like illness rates in The Netherlands, 1970-2016[J]. Environmental Research, 167: 307-313.
DOI PMID |
| [24] | CANNELL J J, ZASLOFF M, GARLAND C F, et al, 2008. On the epidemiology of influenza[J]. Journal of Virology, 5(1): 29-29. |
| [25] |
CARDER M, MCNAMEE R, BEVERLAND I, et al, 2005. The lagged effect of cold temperature and wind chill on cardiorespiratory mortality in Scotland[J]. Occupational and Environmental Medicine, 62(10): 702-710.
PMID |
| [26] | DU M, ZHU H, YIN X, et al, 2022. Exploration of influenza incidence prediction model based on meteorological factors in Lanzhou, China, 2014-2017[J]. PLoS One, 17(12), e0277045. DOI:10.1371/journal.pone.0277045. |
| [27] | FIELLER E C, HARTLEY H O, PEARSON E S, 1957. Tests for rank correlation coefficients. i[J]. Biometrika, 44(3/4): 470-481. |
| [28] | GUO Y, BARNETT A G, YU W, et al, 2011. A large change in temperature between neighbouring days increases the risk of mortality[J]. PLoS One, 6(2), e16511. DOI:10.1371/journal.pone.0016511. |
| [29] |
GASPARRINI A, 2011. Distributed lag linear and non-linear models in R: the package dlnm[J]. Journal of Statistical Software, 43(8): 1-20.
PMID |
| [30] |
GUO Q Z, DONG Z Q, ZENG W L, et al, 2019. The effects of meteorological factors on influenza among children in Guangzhou, China[J]. Influenza and Other Respiratory Viruses, 13(2): 166-175.
DOI PMID |
| [31] | KANG Y T, TANG H S, JIANG L L, et al, 2020. Air temperature variability and high-sensitivity C reactive protein in a general population of China[J]. Science of the Total Environment, 749, 141588. DOI:10.1016/j.scitotenv.2020.141588. |
| [32] |
LIU Z D, ZHANG J, ZHANG Y, et al, 2019. Effects and interaction of meteorological factors on influenza: based on the surveillance data in Shaoyang, China[J]. Environmental Research, 172: 326-332.
DOI PMID |
| [33] | LOWEN A C, MUBAREKA S, STEEL J, et al, 2007. Influenza virus transmission is dependent on relative humidity and temperature[J]. PLoS Pathogens, 3(10): 1 470-1 476. |
| [34] | LIU Q, TAN Z M, SUN J, et al, 2020. Changing rapid weather variability increases influenza epidemic risk in a warming climate[J]. Environmental Research Letters, 15(4), 044004. DOI:10.1088/1748-9326/ab70bc. |
| [35] | SPIGA R, BATTON H M, Sarazin M, 2016. Predicting fluctuating rates of hospitalizations in relation to influenza epidemics and meteorological factors[J]. PLoS One, 11(6), e0157492. DOI:10.1371/journal.pone.0157492. |
| [36] |
SCHNEIDER A, SCHUH A, MAETZEL F K, et al, 2008. Weather-induced ischemia and arrhythmia in patients undergoing cardiac rehabilitation: another difference between men and women[J]. International Journal of Biometeorology, 52(6): 535-547.
DOI PMID |
| [37] | VICEDO-CABRERA A M, FORSBERG B, TOBIAS A, et al, 2016. Associations of inter-and intraday temperature change with mortality[J]. American Journal of Epidemiology, 183(4): 286-293. |
| [38] |
ZHU H, CHEN S, LU W, et al, 2022. Study on the influence of meteorological factors on influenza in different regions and predictions based on an LSTM algorithm[J]. BMC Public Health, 22(1), 2335. DOI:10.1186/s12889-022-14299-y.
PMID |
| [39] | ZHANG K, ROOD R B, MICHAILIDIS G, et al, 2012. Comparing exposure metrics for classifying ‘dangerous heat’ in heat wave and health warning systems[J]. Environment International, 46: 23-29. |
| [1] | HAO Lisheng, HE Liye, MA Ning, HAO Yuqian. Relationship between interannual variability of El Niño events and summer droughts in North China [J]. Journal of Arid Meteorology, 2023, 41(6): 829-840. |
| [2] | MA Siyuan, JIN Yan, ZHANG Si, WANG Chuqin, MA Zhimin. Different impacts of El Niño/Southern Oscillation events on autumn meteorological drought in Yunnan Province [J]. Journal of Arid Meteorology, 2023, 41(6): 860-872. |
| [3] | LI Shuping, QUAN Wenjie, WANG Zheng, CHEN Yizhuo, SU Tao, YAN Pengcheng. Evaluation of the ability of BCC-CSM2-MR global climate model in simulating precipitation and temperature in East Asia [J]. Journal of Arid Meteorology, 2023, 41(6): 984-996. |
| [4] | GUO Yingxiang, FENG Xiaoli, LIU Chang, SHEN Hongyan, CHEN Haicun, LI Moyu. Characteristics of heavy snowfall in the Qinghai-Tibetan Plateau in early and late winter during 1961-2021 [J]. Journal of Arid Meteorology, 2023, 41(5): 723-733. |
| [5] | ZHANG Qiang, YANG Jinhu, MA Pengli, YUE Ping, YU Haipeng, YANG Zesu, WANG Pengling, DUAN Xinyu, LIU Xiaoyun, ZHU Biao, ZHANG Hongli, LU Guoyang, WANG Youheng, LIU Weiping, LIN Jinjin, LIU Liwei, YAN Xinyang. The enhancement and eastward expansion of climate warming and humidification, formation mechanism and important environmental impacts in Northwest China [J]. Journal of Arid Meteorology, 2023, 41(3): 351-358. |
| [6] | GUO Jingyan, XIAO Dong. Changes of summer water vapor in Bengal region and its linkage with the interdecadal Pacific oscillation [J]. Journal of Arid Meteorology, 2023, 41(3): 380-389. |
| [7] | KANG Hengyuan, LIU Yulian, ZHOU Heling, YUAN Fang. Heterogeneity characteristics and influencing factors of summer precipitation in Heilongjiang Province [J]. Journal of Arid Meteorology, 2023, 41(2): 268-278. |
| [8] | ZHANG Wen, MA Yang, WANG Suyan, WANG Dai, LI Xin. Circulation characteristics of drought-flood transition from spring to summer over the east region of Northwest China and its relationship with Atlantic sea surface temperature [J]. Journal of Arid Meteorology, 2023, 41(1): 14-24. |
| [9] | MA Yang, CUI Yang, ZHANG Wen, LI Xin. Projection of the future temperature changes of Yellow River Basin Ningxia section based on CMIP6 models [J]. Journal of Arid Meteorology, 2023, 41(1): 43-53. |
| [10] | LIU Lei, LI Luan, ZHANG Li, SUN Dabing, ZHANG Xiaoyi. Construction of temperature series and its decadal characteristics from 1880 to 2020 in Wuhu of Anhui Province [J]. Journal of Arid Meteorology, 2022, 40(5): 831-839. |
| [11] | LOU Dejun, LI Yongsheng, WANG Yongguang, CHEN Chen, ZHANG Jian. Preliminary study on the causes of extremely less precipitation in Heilongjiang Province in July 2020 [J]. Journal of Arid Meteorology, 2022, 40(3): 396-405. |
| [12] | CEHN Xiaochen, TANG Zhenfei, CHEN Xikuan, ZHENG Chaoyu, LI Xinxin, YANG Ting. Projection of extreme temperature in Fujian based on CMIP6 output [J]. Journal of Arid Meteorology, 2022, 40(3): 415-423. |
| [13] | XU Weiping, MENG Xiangxin, GU Weizong, BO Zhongkai. Relationship between extremely low temperature in spring in Shandong Province and North Atlantic SST in preceding winter [J]. Journal of Arid Meteorology, 2022, 40(2): 202-211. |
| [14] | CHEN Ying, ZHANG Dongfeng, WANG Lin, LIU Yueli, WANG Dayong. Estimation of climate change in the 21st century in North China by RegCM4 [J]. Journal of Arid Meteorology, 2022, 40(1): 1-10. |
| [15] | WANG Min, YIN Yixing, CHEN Xiaoyang, GUO Yang, XU Mei, LUO Chuanjun. Changing characteristics of meteorological drought in Tianjin for almost one century based on standardized precipitation evapotranspiration index [J]. Journal of Arid Meteorology, 2022, 40(1): 11-21. |
| Viewed | ||||||
|
Full text |
|
|||||
|
Abstract |
|
|||||