Journal of Arid Meteorology ›› 2023, Vol. 41 ›› Issue (2): 268-278.DOI: 10.11755/j.issn.1006-7639(2023)-02-0268
• Articles • Previous Articles Next Articles
Heterogeneity characteristics and influencing factors of summer precipitation in Heilongjiang Province
KANG Hengyuan1,2( ), LIU Yulian3(), ZHOU Heling4, YUAN Fang5
- 1. Harbin Meteorological Bureau of Heilongjiang Province, Harbin 150001, China
2. College of Electronics and Information Engineering, Nanjing University of Information Science & Technology, Nanjing 210044, China
3. Heilongjiang Climate Center, Harbin 150030, China
4. Langfang Meteorological Bureau of Hebei Province, Langfang 131001, Hebei, China
5. Training Centre, CMA, Hubei Branch, Wuhan 430074, China
-
Received:2022-03-21Revised:2022-07-19Online:2023-04-30Published:2023-05-09
黑龙江省夏季降水非均匀性特征及其影响因素
- 1.黑龙江省哈尔滨市气象局,黑龙江 哈尔滨 150001
2.南京信息工程大学电子与信息工程学院,江苏 南京 210044
3.黑龙江省气候中心,黑龙江 哈尔滨 150030
4.河北省廊坊市气象局,河北 廊坊 131001
5.中国气象局气象干部培训学院湖北分院,湖北 武汉 430074
-
通讯作者:刘玉莲(1974—),女,黑龙江兰西人,正高级工程师,主要从事区域气候变化研究。E-mail:18973598@qq.com。 -
作者简介:康恒元(1970—),男,黑龙江望奎人,高级工程师,主要从事气象网络与数据挖掘。E-mail:627362835@qq.com。 -
基金资助:国家重点研发计划项目(2018YFA0605603);国家自然科学基金项目(41771067);黑龙江省自然科学基金项目(LH2019D013);及中国气象局气候变化专项项目(CCSF201842);及中国气象局气候变化专项项目(CCSF201910);及中国气象局气候变化专项项目(CCSF202013)
CLC Number:
Cite this article
KANG Hengyuan, LIU Yulian, ZHOU Heling, YUAN Fang. Heterogeneity characteristics and influencing factors of summer precipitation in Heilongjiang Province[J]. Journal of Arid Meteorology, 2023, 41(2): 268-278.
康恒元, 刘玉莲, 周贺玲, 袁芳. 黑龙江省夏季降水非均匀性特征及其影响因素[J]. 干旱气象, 2023, 41(2): 268-278.
share this article
Add to citation manager EndNote|Ris|BibTeX
URL: http://www.ghqx.org.cn/EN/10.11755/j.issn.1006-7639(2023)-02-0268
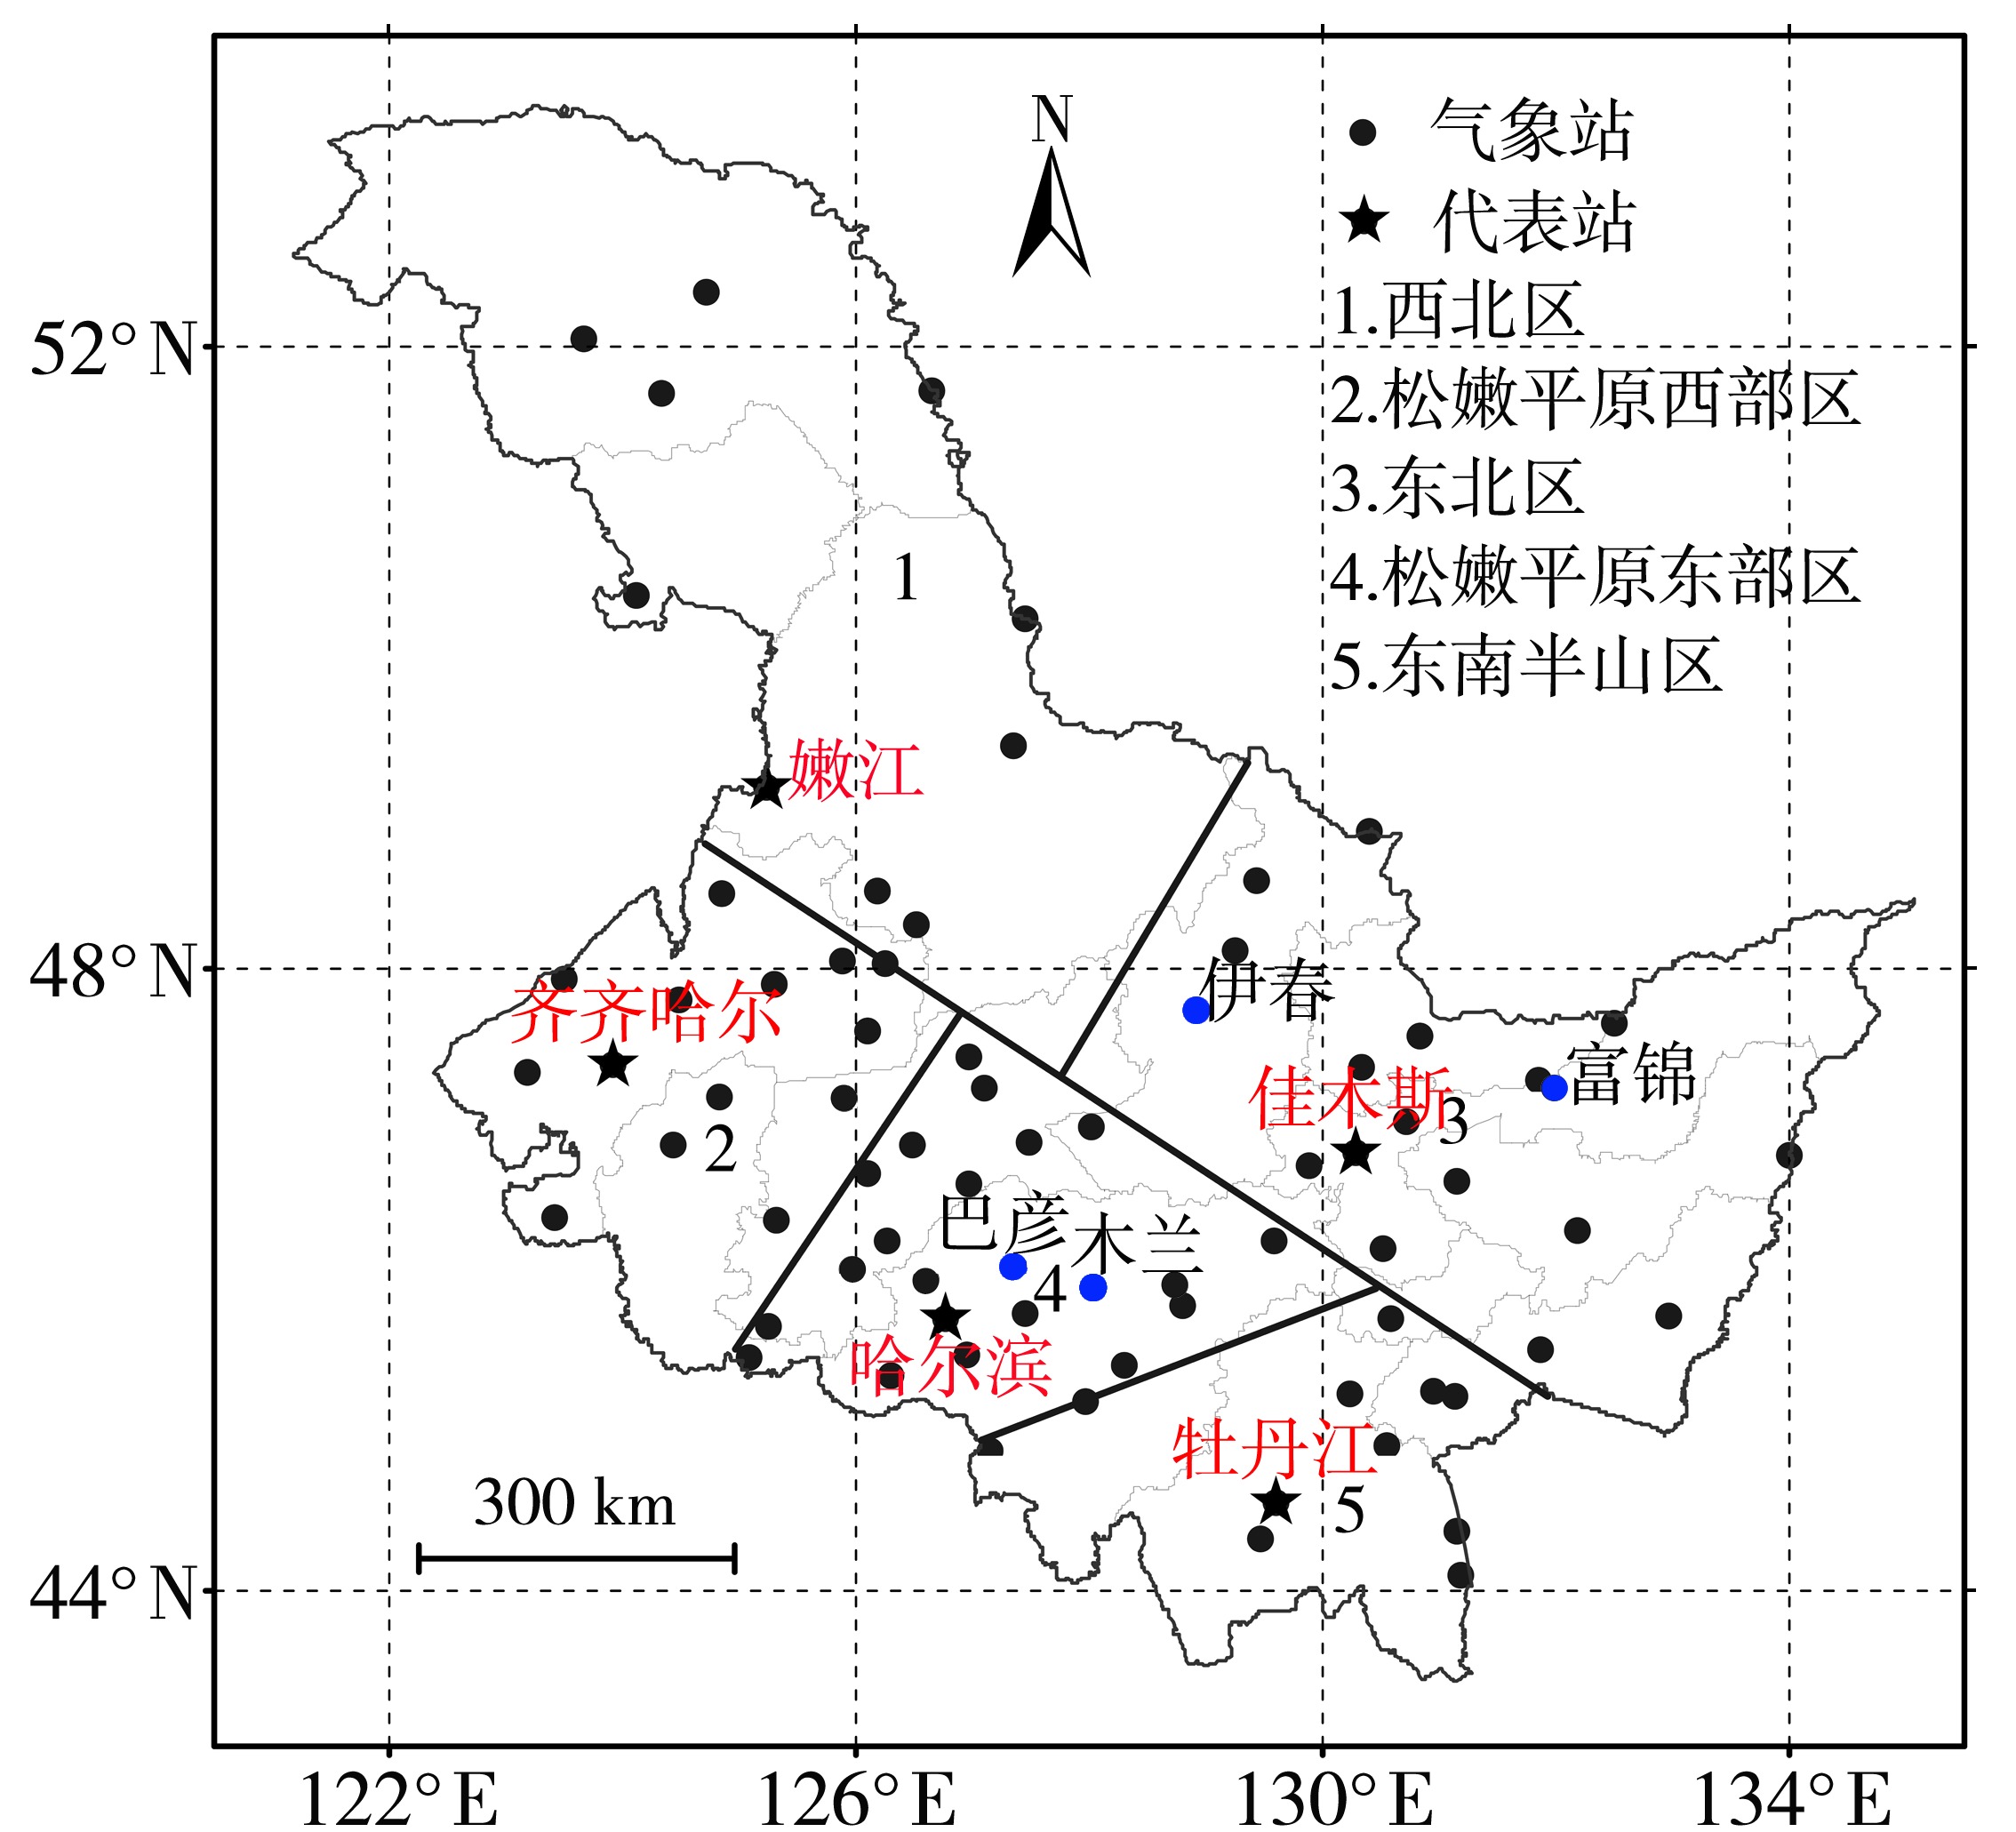
Fig.1 The distribution of meteorological observation stations and the climatic zoning and corresponding representative stations in Heilongjiang Province
Fig.1 The distribution of meteorological observation stations and the climatic zoning and corresponding representative stations in Heilongjiang Province
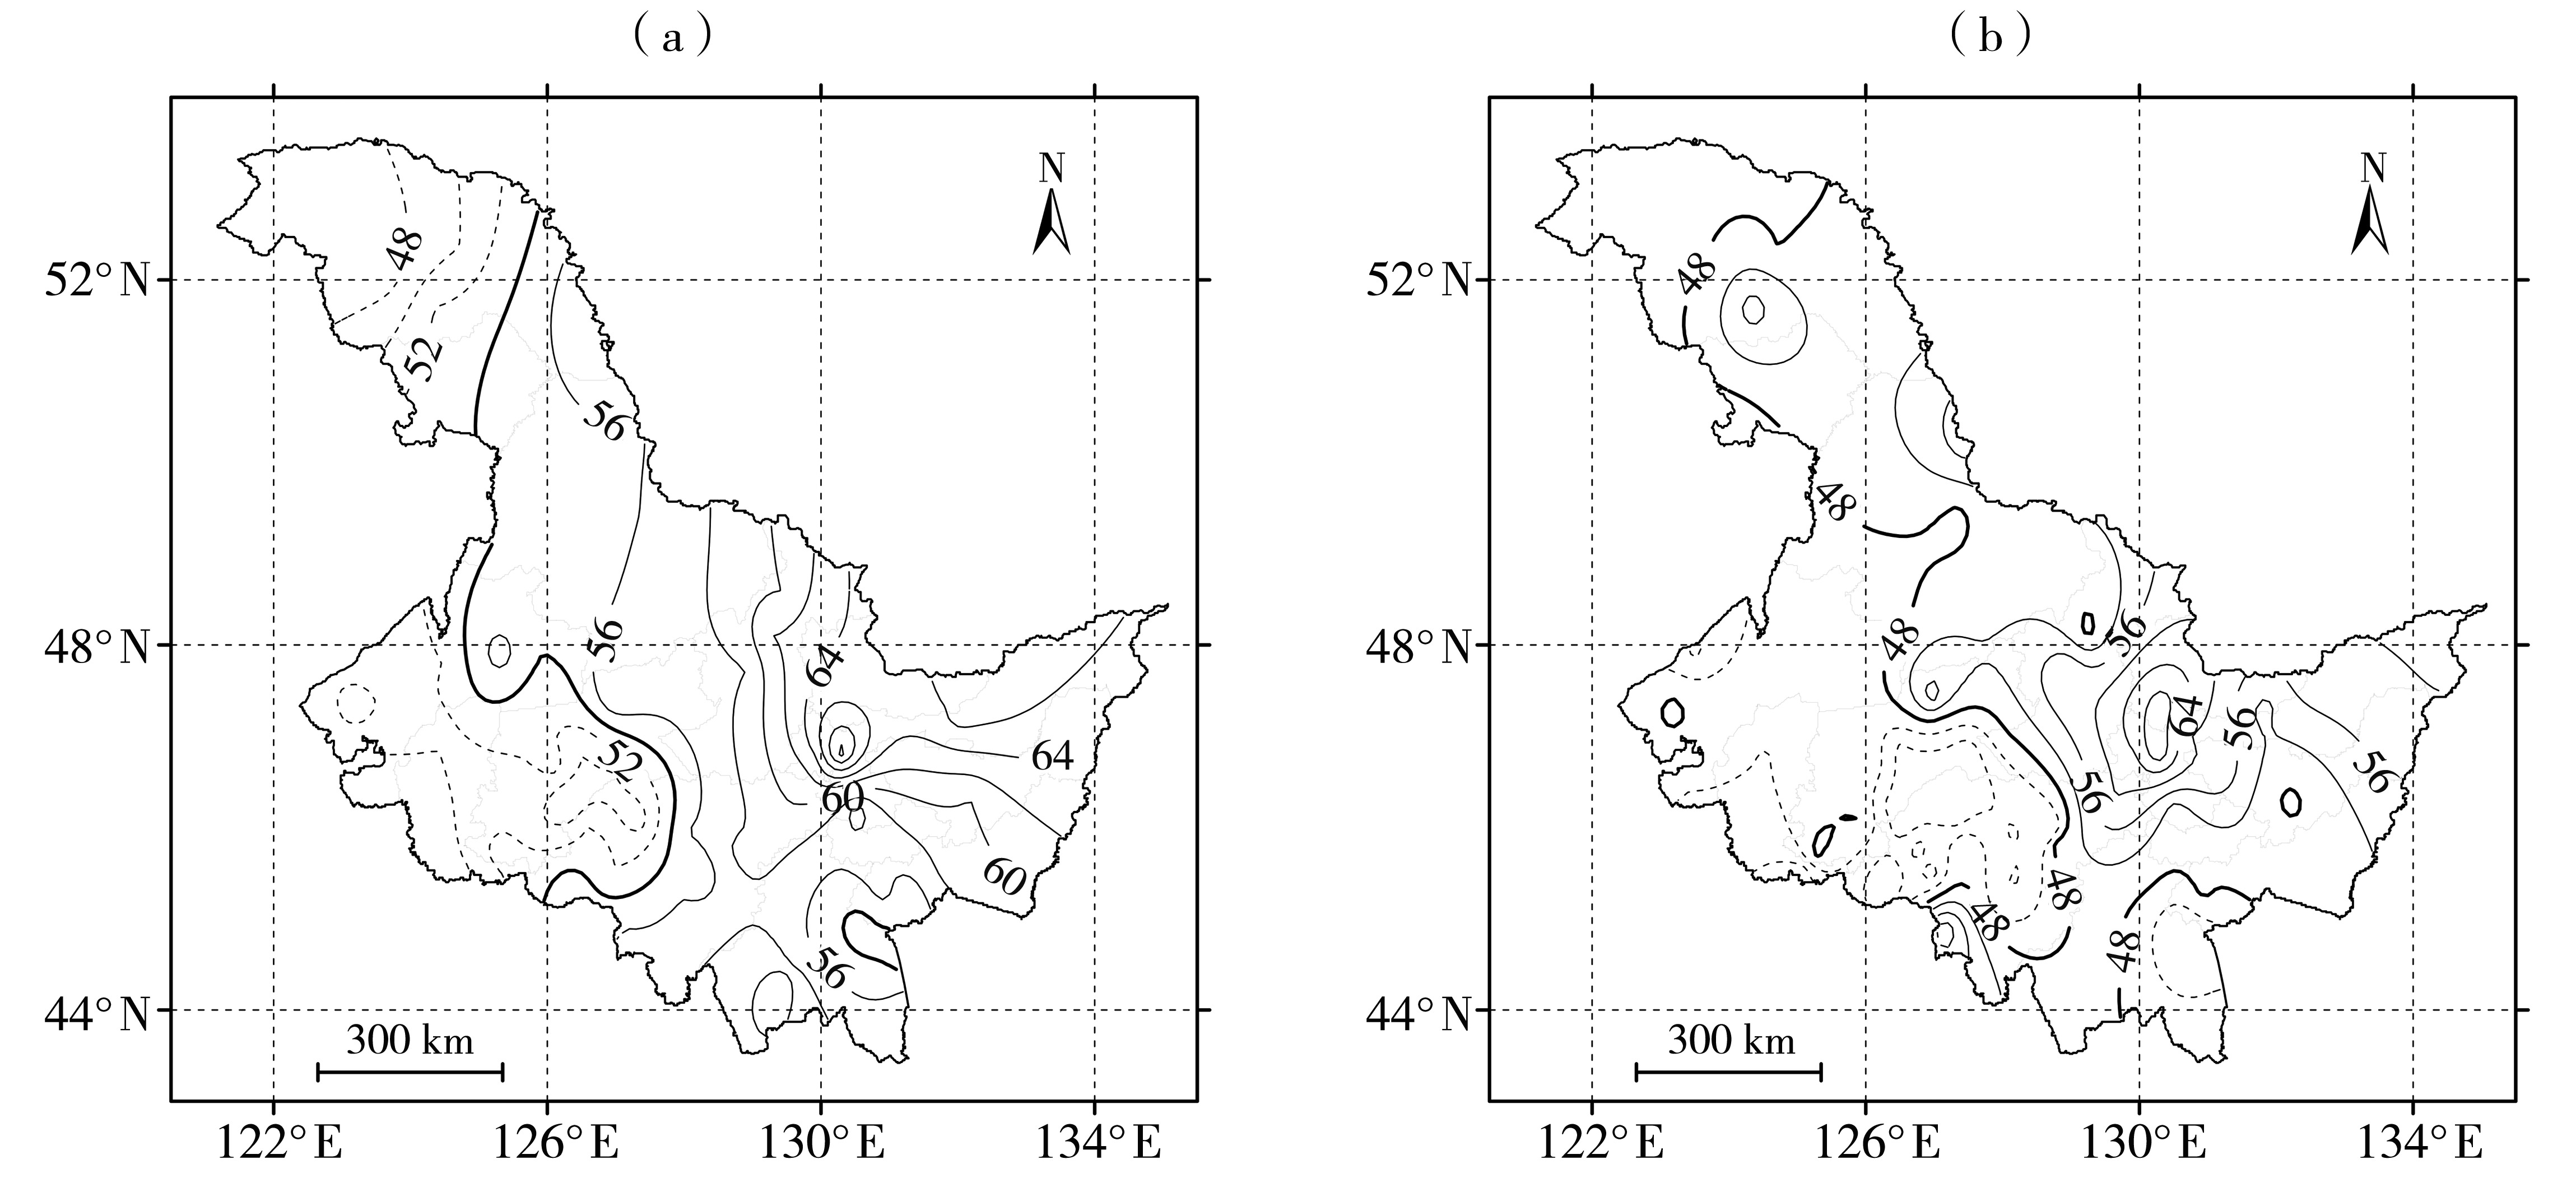
Fig.2 Spatial distribution of average summer PCP in Heilongjiang Province from 1981 to 2010 based on vector method (a) and sliding method (b) (The thick solid isoline is mean value line, while the values of the solid and dotted isolines are more than and less than the mean value, respectively. the same as below)
Fig.2 Spatial distribution of average summer PCP in Heilongjiang Province from 1981 to 2010 based on vector method (a) and sliding method (b) (The thick solid isoline is mean value line, while the values of the solid and dotted isolines are more than and less than the mean value, respectively. the same as below)

Fig.3 The mean daily precipitation series and PCP calculated by different methods in summer in Shuangcheng (a) and Wuchang (b) of Heilongjiang Province from 1981 to 2010
Fig.3 The mean daily precipitation series and PCP calculated by different methods in summer in Shuangcheng (a) and Wuchang (b) of Heilongjiang Province from 1981 to 2010

Fig.4 Spatial distribution of average summer PCD in Heilongjiang Province from 1981 to 2010 based on different method (a) vector method,(b) Q method,(c) PCI method,(d) sliding ratio,(e) SUN method
Fig.4 Spatial distribution of average summer PCD in Heilongjiang Province from 1981 to 2010 based on different method (a) vector method,(b) Q method,(c) PCI method,(d) sliding ratio,(e) SUN method
Tab.1 Related statistics between summer PCDs calculated by different methods
| 方法 | 相关系数和 | 显著正相关占比/% |
|---|---|---|
| 矢量法 | 161.2 | 57.0 |
| Q | 138.2 | 63.8 |
| PCI | 149.8 | 67.3 |
| 滑动占比 | 175.3 | 74.0 |
| SUN | 121.0 | 60.5 |
Tab.1 Related statistics between summer PCDs calculated by different methods
| 方法 | 相关系数和 | 显著正相关占比/% |
|---|---|---|
| 矢量法 | 161.2 | 57.0 |
| Q | 138.2 | 63.8 |
| PCI | 149.8 | 67.3 |
| 滑动占比 | 175.3 | 74.0 |
| SUN | 121.0 | 60.5 |
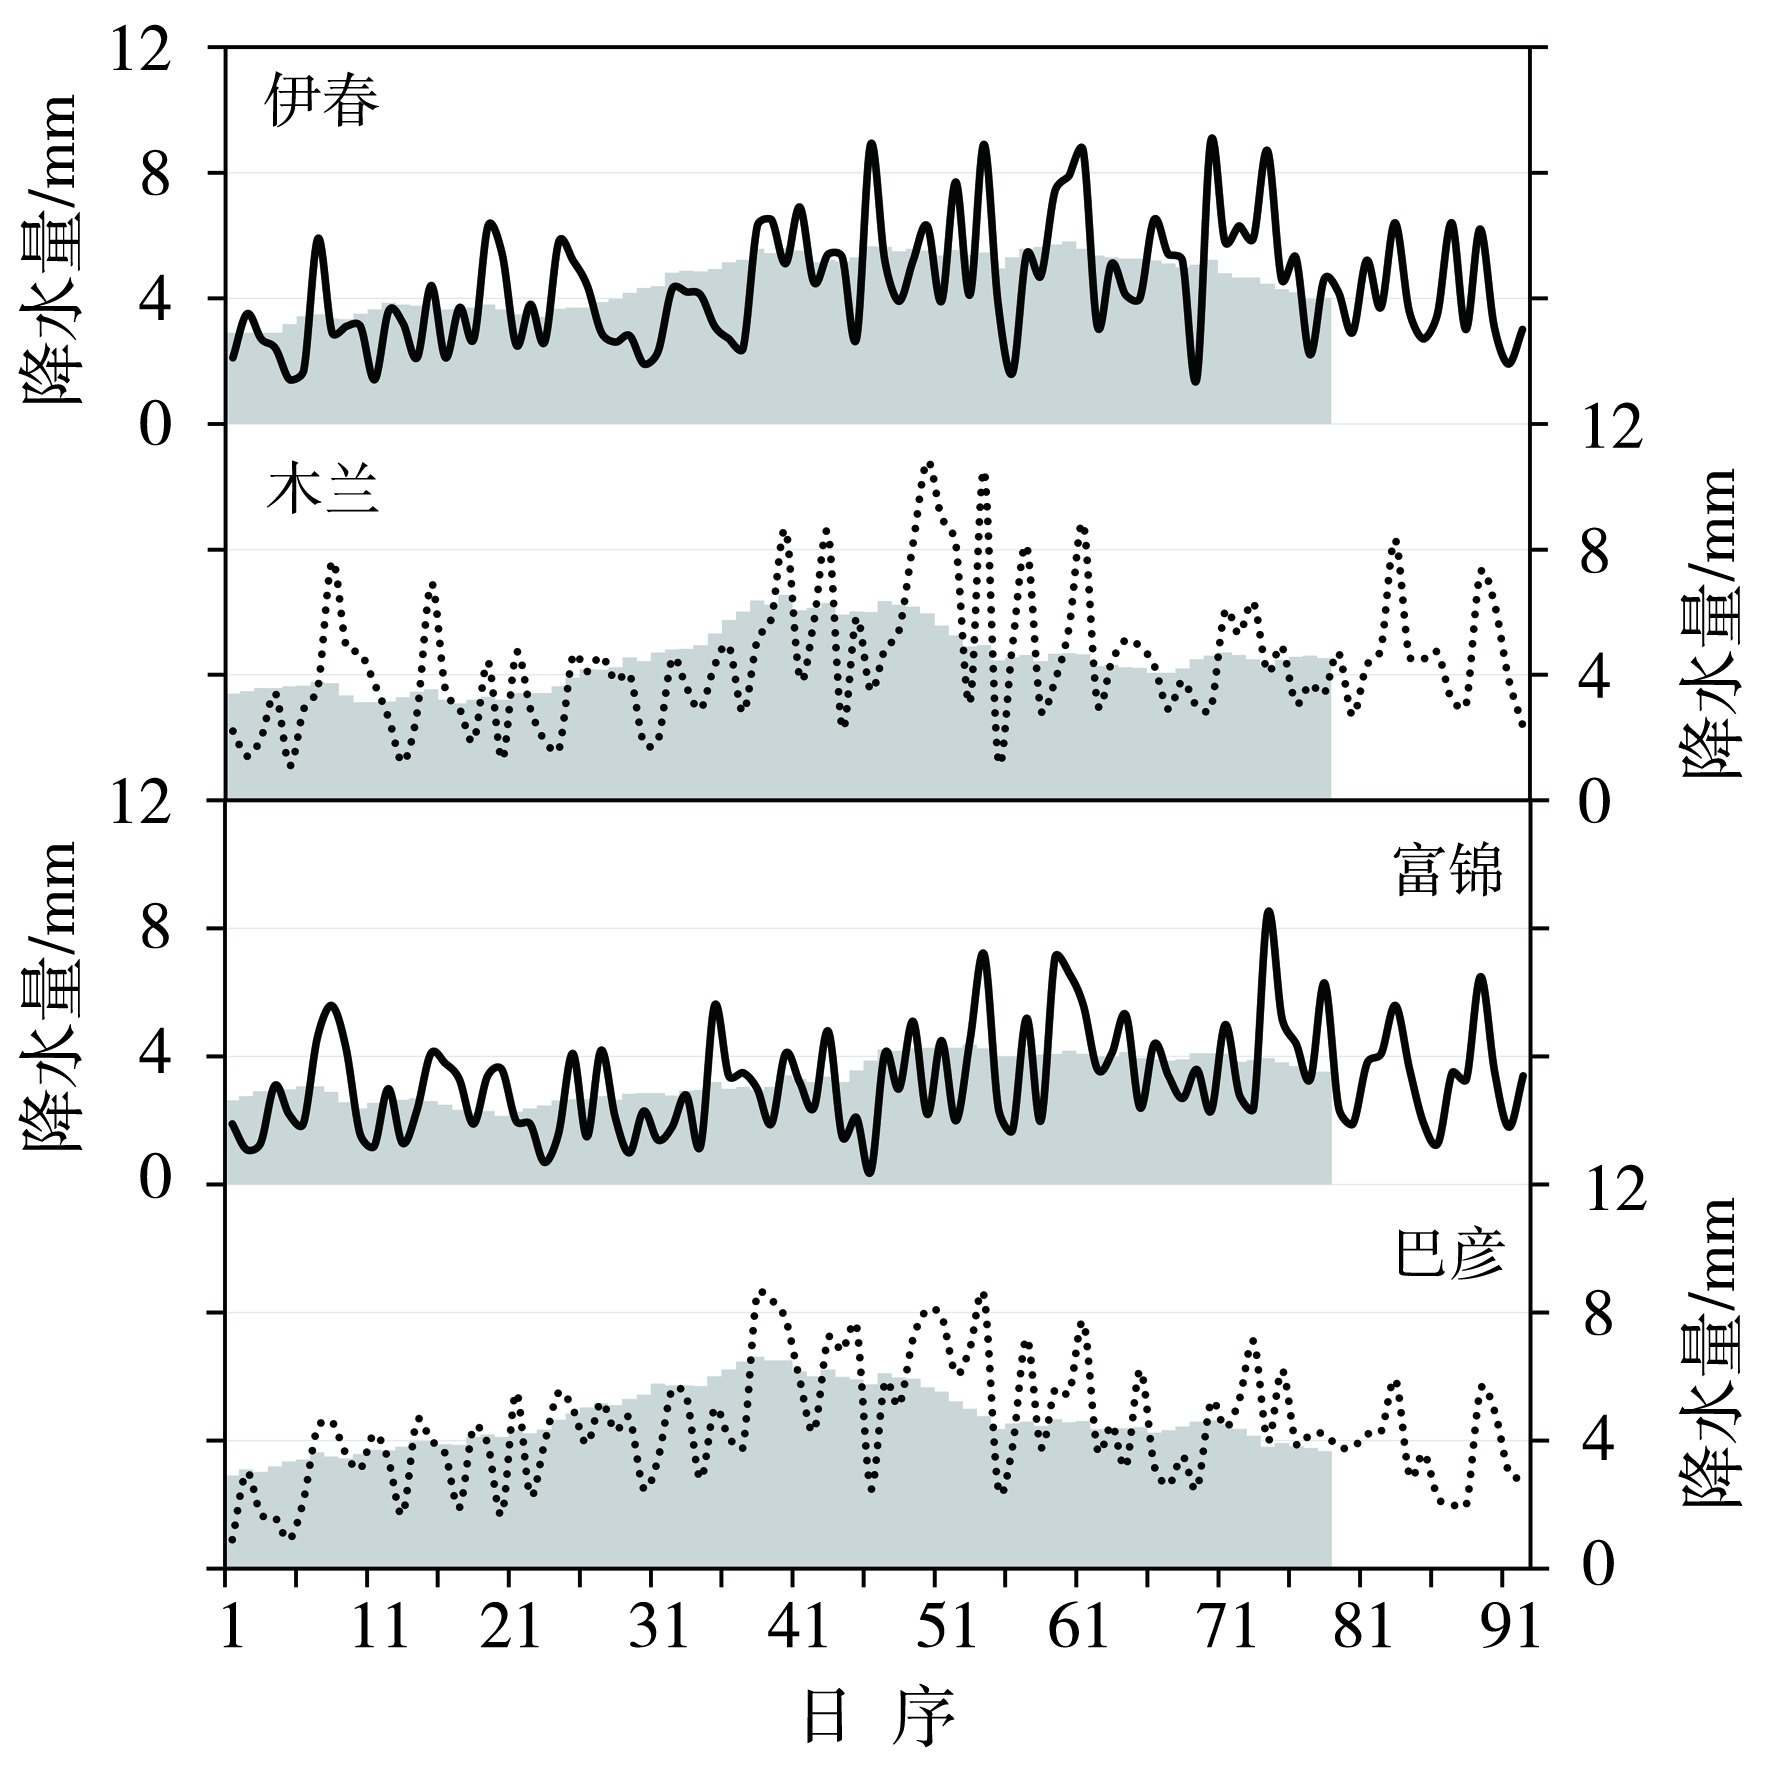
Fig.5 The average daily series of precipitation at typical stations of Heilongjiang Province in summer from 1981 to 2010 (the gray columns for the 15-day sliding average precipitation)
Fig.5 The average daily series of precipitation at typical stations of Heilongjiang Province in summer from 1981 to 2010 (the gray columns for the 15-day sliding average precipitation)
Tab.2 The variance and accumulative variance contribution rate of the first five eigenvectors by EOF and REOF for the normalized field of summer precipitation concentration periodin Heilongjiang Province
| 序号 | 特征值 | EOF | REOF | ||
|---|---|---|---|---|---|
| 方差贡献率/% | 累积方差贡献率/% | 方差贡献率/% | 累积方差贡献率/% | ||
| 1 | 19.5 | 26.0 | 26.0 | 18.6 | 18.6 |
| 2 | 9.6 | 12.8 | 38.8 | 14.6 | 33.2 |
| 3 | 7.3 | 9.8 | 48.6 | 10.4 | 43.6 |
| 4 | 5.3 | 7.1 | 55.7 | 9.3 | 52.9 |
| 5 | 4.7 | 6.3 | 62.0 | 9.1 | 62.0 |
Tab.3 Percentage of ten-day precipitation to summer precipitation in Heilongjiang Province from 1981 to 2010
| 统计量 | 6月 | 7月 | 8月 | ||||||
|---|---|---|---|---|---|---|---|---|---|
| 上旬 | 中旬 | 下旬 | 上旬 | 中旬 | 下旬 | 上旬 | 中旬 | 下旬 | |
| 最小值 | 5.3 | 6.6 | 7.0 | 9.0 | 9.3 | 10.6 | 9.6 | 9.2 | 7.9 |
| 最大值 | 10.0 | 10.7 | 11.8 | 15.7 | 15.4 | 19.9 | 14.7 | 15.0 | 15.0 |
| 平均值 | 7.3 | 8.7 | 8.8 | 12.2 | 12.5 | 16.4 | 12.1 | 11.1 | 10.9 |
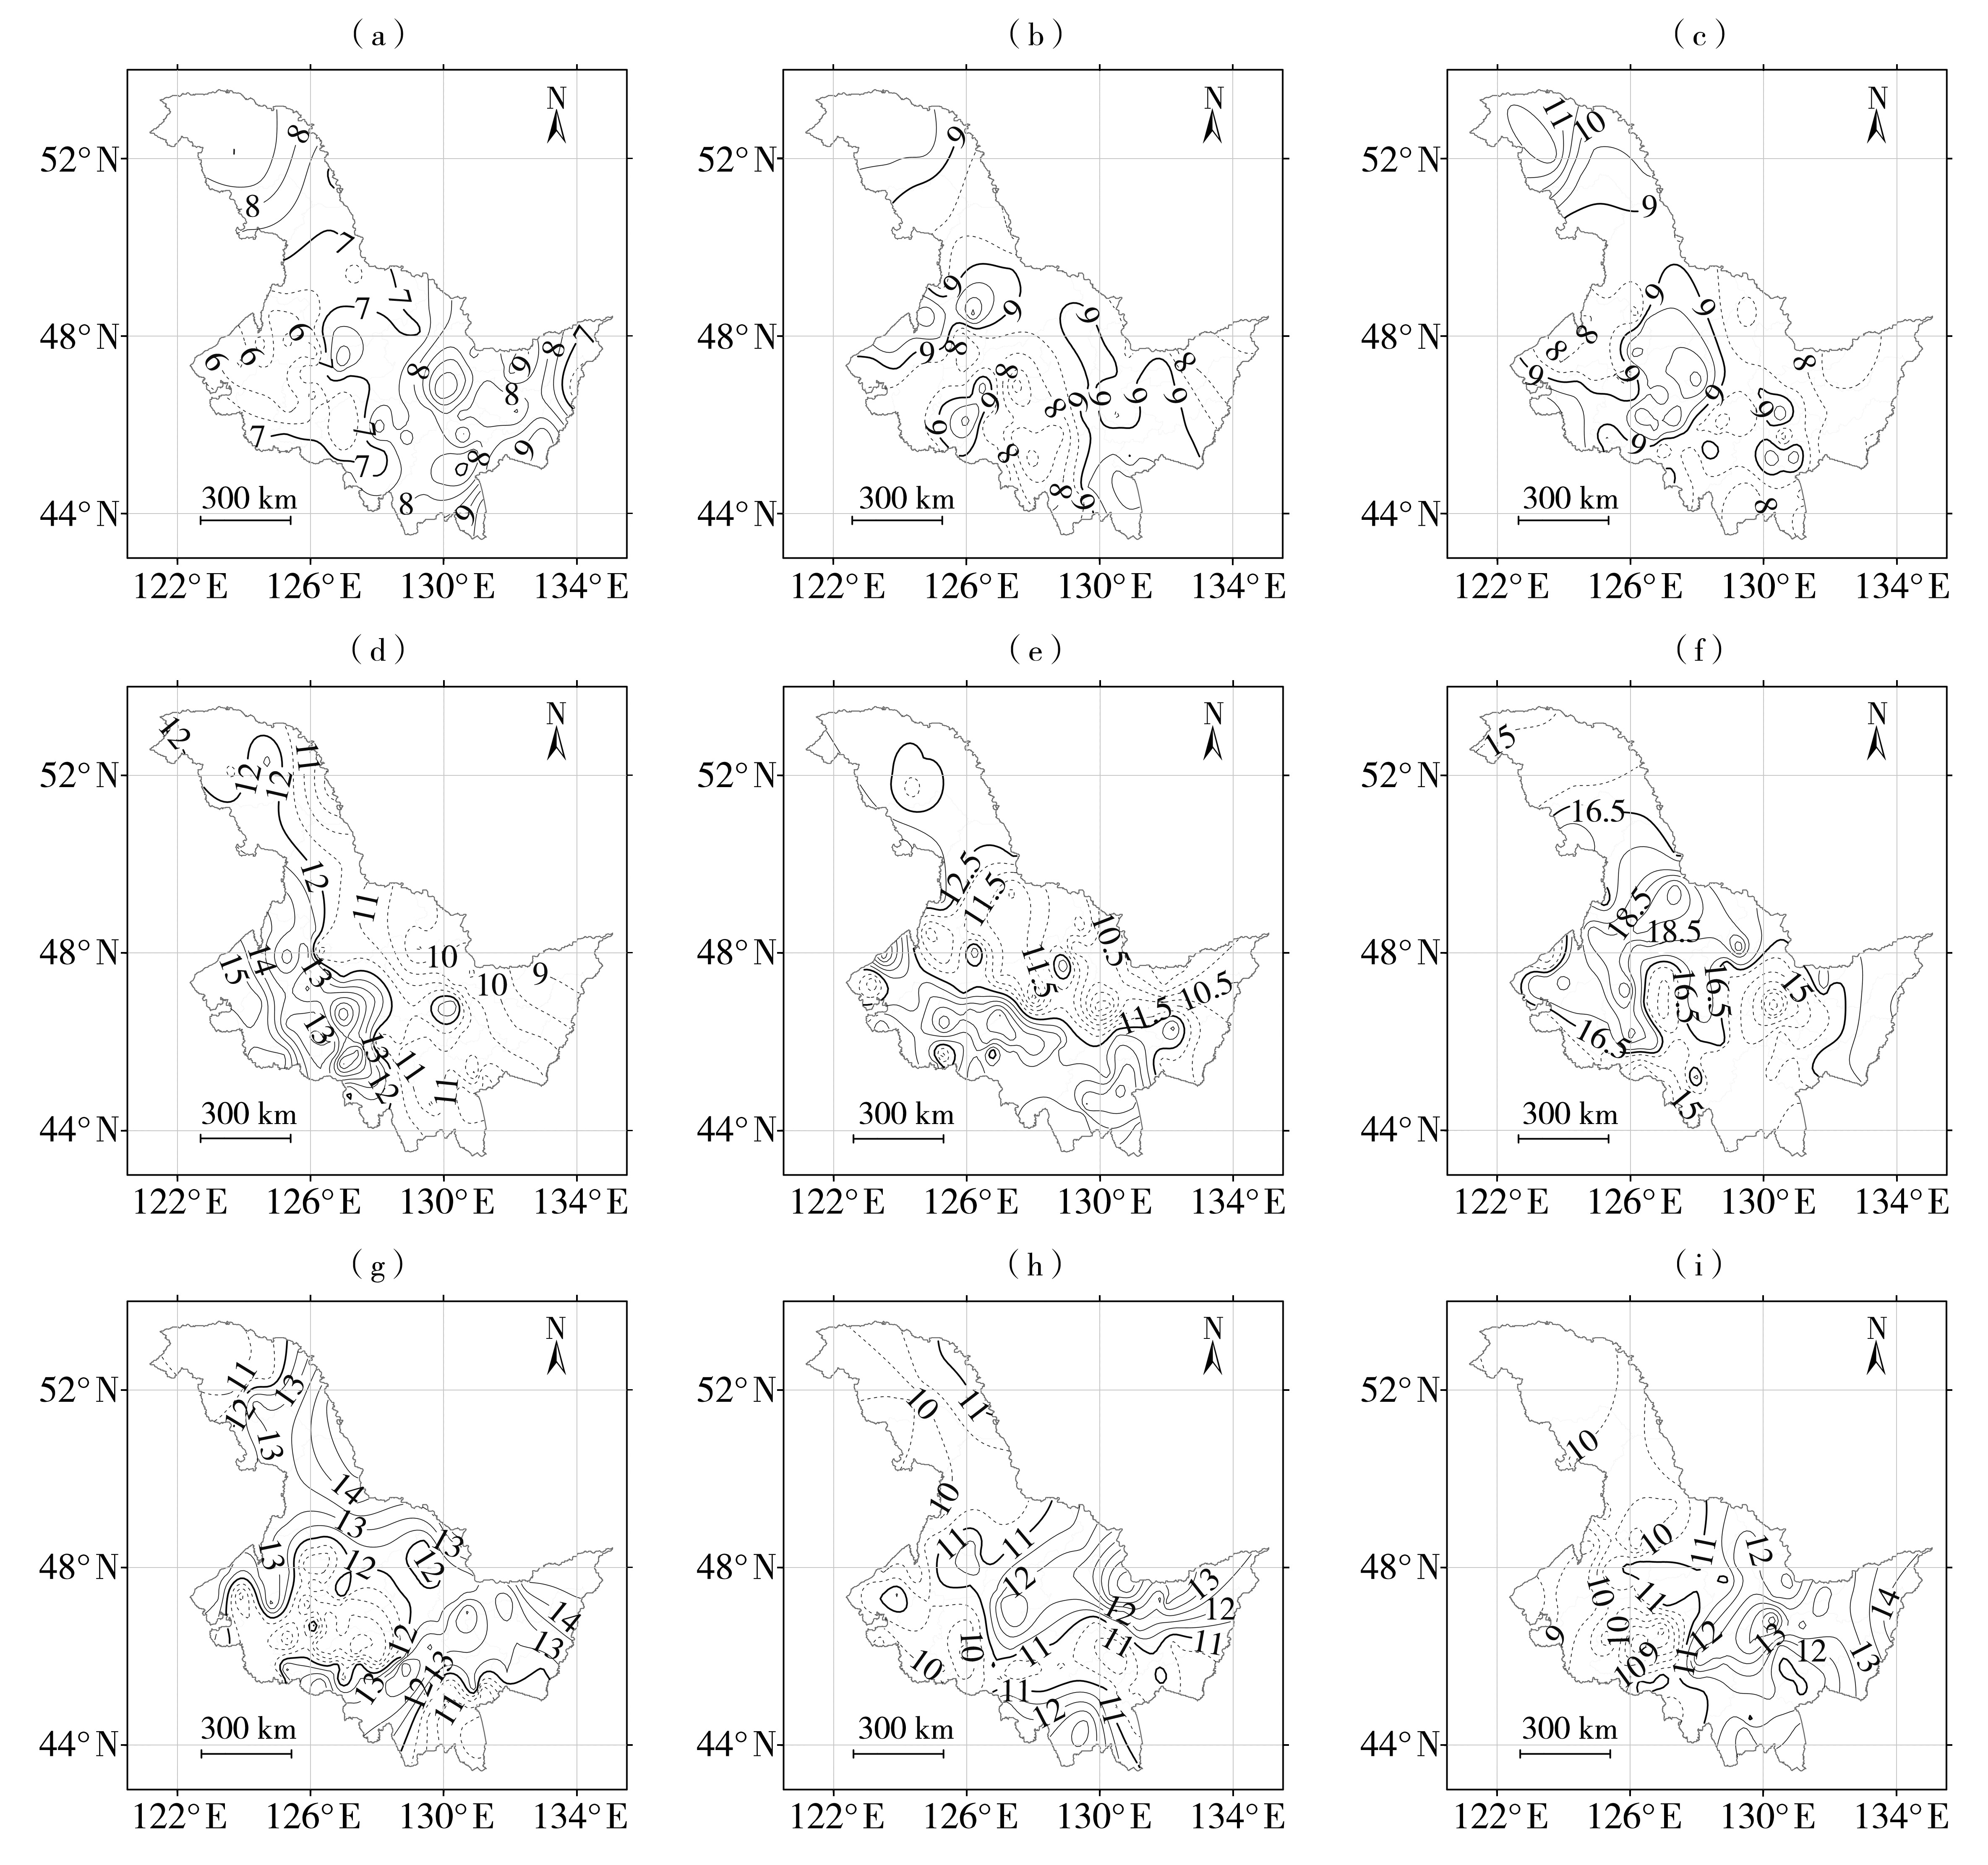
Fig.6 Spatial distribution of percentage of average ten-day precipitation to summer precipitation in Heilongjiang Province from 1981 to 2010 (Unit: %) (a) early June,(b) middle June,(c) late June,(d) early July,(e) middle July,(f) late July,(g) early August,(h) middle August,(i) late August
Fig.6 Spatial distribution of percentage of average ten-day precipitation to summer precipitation in Heilongjiang Province from 1981 to 2010 (Unit: %) (a) early June,(b) middle June,(c) late June,(d) early July,(e) middle July,(f) late July,(g) early August,(h) middle August,(i) late August

Fig.7 The inter-annual change of summer PCD (a) and PCD (b) in different climatic regions of Heilongjiang Province from 1951 to 2020 (the straight dotted line for the climatic mean state)
Fig.7 The inter-annual change of summer PCD (a) and PCD (b) in different climatic regions of Heilongjiang Province from 1951 to 2020 (the straight dotted line for the climatic mean state)
Tab. 4 Statistics of summer PCP and PCD in different climatic regions of Heilongjiang Province from 1951 to 2020
| 气候区 | PCP | PCD | |||||||
|---|---|---|---|---|---|---|---|---|---|
| 平均 | 最早 | 最晚 | 标准差 | 平均 | 最小 | 最大 | 标准差 | ||
| 西北区 | 7月13日 | 6月3日 | 8月17日 | 21.8 | 39.9 | 24.9 | 64.0 | 8.6 | |
| 松嫩平原西部区 | 7月14日 | 6月3日 | 8月17日 | 19.1 | 43.9 | 26.0 | 76.1 | 9.0 | |
| 东北区 | 7月18日 | 6月1日 | 8月17日 | 23.3 | 40.1 | 25.0 | 64.5 | 7.7 | |
| 松嫩平原东部区 | 7月17日 | 6月3日 | 8月16日 | 18.4 | 39.9 | 26.4 | 62.4 | 8.1 | |
| 东南半山区 | 7月15日 | 6月4日 | 8月17日 | 20.4 | 39.3 | 27.7 | 57.2 | 6.3 | |

Fig.8 Wavelet power spectrums of summer PCP (a) and PCD (b) in different climatic regions of Heilongjiang Province from 1951 to 2020 (The black solid line with the U-shaped is the cone of influence (COI) curve, and the orange and black dashed lines designate the 0.05 significance level against red noise)
Fig.8 Wavelet power spectrums of summer PCP (a) and PCD (b) in different climatic regions of Heilongjiang Province from 1951 to 2020 (The black solid line with the U-shaped is the cone of influence (COI) curve, and the orange and black dashed lines designate the 0.05 significance level against red noise)

Fig.9 The spatial distribution of correlation coefficient of summer PCP (a, b, c) and PCD (d, e, f) in Heilongjiang Province with significantly correlative climate indices (a) North American polar vortex area index in May,(b) western Pacific 850 hPa trade wind index in May,(c) Scandinavia teleconnection pattern index in August,(d) central Pacific 850 hPa trade wind index in summer,(e) North African-North Atlantic-North American subtropical high ridge position index in June,(f) eastern Pacific ENSO index in July (The blue and red cycles represent positive and negative correlations, respectively, the diameter of cycles represents the value of correlation coefficient, and the solid cycles pass the significance test with 0.05 level)
Fig.9 The spatial distribution of correlation coefficient of summer PCP (a, b, c) and PCD (d, e, f) in Heilongjiang Province with significantly correlative climate indices (a) North American polar vortex area index in May,(b) western Pacific 850 hPa trade wind index in May,(c) Scandinavia teleconnection pattern index in August,(d) central Pacific 850 hPa trade wind index in summer,(e) North African-North Atlantic-North American subtropical high ridge position index in June,(f) eastern Pacific ENSO index in July (The blue and red cycles represent positive and negative correlations, respectively, the diameter of cycles represents the value of correlation coefficient, and the solid cycles pass the significance test with 0.05 level)
| [1] |
安琳莉, 黄建平, 任钰, 等, 2022. 中国北方旱区陆地水储量变化特征及其归因分析[J]. 干旱气象, 40(2):169-178.
DOI |
| [2] | 段亚雯, 朱克云, 马柱国, 等, 2014. 中国区域1961-2010年降水集中指数(PCI)的变化及月分配特征[J]. 大气科学, 38(6): 1 124-1 136. |
| [3] | 高颖会, 顾斌贤, 柳一玲, 等, 2021. 山东省降水集中程度及其与旱涝的关系[J]. 水电能源科学, 39(1):18-21. |
| [4] | 高永刚, 2012. 黑龙江省1967年至2007年极端气温与降水综合强度的时空特征分析[J]. 资源科学, 34(11):2170-2 180. |
| [5] | 黄嘉佑, 李庆祥, 2015. 气象数据统计分析方法[M]. 北京: 气象出版社:28-60. |
| [6] | 康恒元, 周贺玲, 袁芳, 等, 2022. 黑龙江省多水期降水气候变化[J]. 沙漠与绿洲气象, 16(6):101-110. |
| [7] | 李吉顺, 王昂生, 陈家田, 1999. 降水时空分布变化是长江流域水旱灾害加重的主要原因[J]. 中国减灾, 9(4):27-30. |
| [8] | 刘红, 任传友, 许烁舟, 等, 2018. 东北农业区降水年内分配的不均匀性及对区域增暖的响应[J]. 气候变化研究进展, 14(4):371-380. |
| [9] | 刘向培, 佟晓辉, 贾庆宇, 等, 2020. 1960—2018年辽河流域日降水集中程度分析[J]. 气象与环境学报, 36(5):18-24. |
| [10] | 刘向培, 佟晓辉, 贾庆宇, 等, 2021. 1960—2017年中国降水集中程度特征分析[J]. 水科学进展, 32(1):10-19. |
| [11] | 苗运玲, 卓芝正, 张军, 等, 2021. 乌鲁木齐汛期降水集中度和集中期时空变化特征[J]. 沙漠与绿洲气象, 15(4):9-16. |
| [12] | 水利部长江水利委员会, 2002. 长江流域水旱灾害[M]. 北京: 中国水利水电出版社:196. |
| [13] | 王睆, 陆尔, 赵玮, 等, 2015. 一种新的反映我国降水季节内非均匀性特征的方法[J]. 热带气象学报, 31(5):655-663. |
| [14] | 王琳莉, 陈星, 2006. 一种新的汛期降水集中期划分方法[J]. 长江流域资源与环境, 15(3):352-355. |
| [15] | 王晓宁, 岳大鹏, 赵景波, 等, 2020. 黑龙江省1958—2017年极端降水时空变化与灾害效应[J]. 水土保持研究, 27(5):138-146. |
| [16] | 吴洪宝, 吴蕾, 2005. 气候变率诊断和预测方法[M]. 北京: 气象出版社:15-44. |
| [17] | 袭祝香, 纪玲玲, 杨雪艳, 等, 2019. 松辽流域降水集中指数的时空变化特征[J]. 干旱气象, 37(6):885-891. |
| [18] | 肖潺, 叶殿秀, 陈昊明, 2017. 中国大陆雨涝时空特征[J]. 灾害学, 32(1):85-89. |
| [19] | 晏德莉, 李双双, 延军平, 等, 2020. 汉江流域降水非均匀性变化特征分析[J]. 武汉大学学报(理学版), 66(4):377-385. |
| [20] | 叶笃正, 黄荣辉, 1996. 长江黄河流域旱涝规律和成因研究[M]. 济南: 山东科学技术出版社:246. |
| [21] | 张健, 李永生, 2019. 黑龙江省汛期降水的特征及分型研究[J]. 自然灾害学报, 28(5):229-236. |
| [22] | 张克新, 苏志华, 刘金林, 等, 2021. 甘肃省降水集中度的变化特征及其与环流指数遥相关分析[J]. 水土保持研究, 28(5):261-267. |
| [23] | 张录军, 钱永甫, 2004. 长江流域汛期降水集中程度和洪涝关系研究[J]. 地球物理学报, 47(4):622-630. |
| [24] | 张翔, 韦燕芳, 李思宇, 等, 2021. 从干旱灾害到干旱灾害链:进展与挑战[J]. 干旱气象, 39(6):873-883. |
| [25] | 赵志鹏, 曹立国, 魏锦烨, 等, 2012. 近52年黑龙江省不同级别降水特征分析[J]. 水土保持研究, 19(2):48-52. |
| [26] |
GOSWAMI B N, VENUGOPAL V, SENGUPTA D, et al, 2006. Increasing trend of extreme rain events over India in a warming environment[J]. Science, 314(5 804):1442-1 445.
DOI URL |
| [27] | HATCHER D A, 1984. Simple formulae for Julian day numbers and calendar dates[J]. Quarterly Journal of the Royal Astronomical Society, 25(1):53-55. |
| [28] | IPCC, 2021. AR6 Climate Change 2021: the Physical Science Basis[EB/L]. https://www.ipcc.ch/report/ar6/wg1/#FullReport. |
| [29] | LI Z P, SONG M D, FENG H, et al, 2016. Within-season yield prediction with different nitrogen inputs under rain-fed condition using CERES-Wheat model in the northwest of China[J]. Journal of the Science of Food & Agriculture, 96(8):2906-2 916. |
| [30] |
NORTH G R, BELL T L, CAHALAN R F, et al, 1982. Sampling errors in the estimation of empirical orthogonal functions[J]. Monthly Weather Review, 110(7): 699-706.
DOI URL |
| [31] |
OLIVER J E, 1980. Monthly precipitation distribution: a comparative index[J]. Professional Geographer, 32(3):300-309.
DOI URL |
| [32] |
SUN Y, SOLOMON S, DAI A, et al, 2006. How often does it rain?[J]. Journal of Climate, 19(6):916-934.
DOI URL |
| [33] |
TORRENCE C, COMPO G P, 1998. A practical guide to wavelet analysis[J]. Bulletin of the American Meteorological Society, 79(1): 61-78.
DOI URL |
| Viewed | ||||||
|
Full text |
|
|||||
|
Abstract |
|
|||||