Journal of Arid Meteorology ›› 2022, Vol. 40 ›› Issue (5): 879-887.DOI: 10.11755/j.issn.1006-7639(2022)-05-0879
• Articles • Previous Articles Next Articles
Influence of topography and weather situation on air pollution in Linfen City
PEI Kunning( ), WANG Yan(), YAN Shiming, JIANG Yunsheng, GUO Wei
- Shanxi Institute of Meteorological Sciences, Taiyuan 030002, China
-
Received:2021-03-31Revised:2021-07-27Online:2022-10-31Published:2022-11-10 -
Contact:WANG Yan
地形和天气形势对临汾市大气污染的影响
- 山西省气象科学研究所,山西 太原 030002
-
通讯作者:王雁 -
作者简介:裴坤宁(1995—),女,山西长治人,硕士,助理工程师,主要从事大气环境研究. E-mail: 1872636982@qq.com。 -
基金资助:山西省自然基金(201601D011084);山西省自然基金(201901D111465);山西省气象局重点项目(SXKZDDQ20185105);山西省气象局青年基金(SXKQNDW20205241);山西省气象局青年基金(SXKQNDW20217151)
CLC Number:
Cite this article
PEI Kunning, WANG Yan, YAN Shiming, JIANG Yunsheng, GUO Wei. Influence of topography and weather situation on air pollution in Linfen City[J]. Journal of Arid Meteorology, 2022, 40(5): 879-887.
裴坤宁, 王雁, 闫世明, 蒋云盛, 郭伟. 地形和天气形势对临汾市大气污染的影响[J]. 干旱气象, 2022, 40(5): 879-887.
share this article
Add to citation manager EndNote|Ris|BibTeX
URL: http://www.ghqx.org.cn/EN/10.11755/j.issn.1006-7639(2022)-05-0879

Fig.1 Topography of Linfen City, Shanxi Province (Unit: m)
Fig.1 Topography of Linfen City, Shanxi Province (Unit: m)
Tab.1 The classification criteria of air quality grades
| 空气质量等级 | 空气质量类别 | AQI |
|---|---|---|
| 一级 | 优 | 0≤AQI≤50 |
| 二级 | 良 | 51≤AQI≤100 |
| 三级 | 轻度污染 | 101≤AQI≤150 |
| 四级 | 中度污染 | 151≤AQI≤200 |
| 五级 | 重度污染 | 201≤AQI≤300 |
| 六级 | 严重污染 | AQI |
Tab.1 The classification criteria of air quality grades
| 空气质量等级 | 空气质量类别 | AQI |
|---|---|---|
| 一级 | 优 | 0≤AQI≤50 |
| 二级 | 良 | 51≤AQI≤100 |
| 三级 | 轻度污染 | 101≤AQI≤150 |
| 四级 | 中度污染 | 151≤AQI≤200 |
| 五级 | 重度污染 | 201≤AQI≤300 |
| 六级 | 严重污染 | AQI |
Tab.2 Analysis of 24 pollution processes with moderate level and above in Linfen City from 2016 to 2017
| 编号 | 污染时间(北京时,下同) | 首要污染物 | 污染类型 | 海平面环流形势 | AQI均值 |
|---|---|---|---|---|---|
| 1 | 2016年1月1日00:00至5日13:00 | PM2.5 | 静稳型 | 低压前部型 | 242 |
| 2 | 2016年11月3日09:00至6日07:00 | PM2.5 | 静稳型 | 低压前部型 | 270 |
| 3 | 2016年11月10日21:00至13日08:00 | PM10 | 沙尘型 | 均压场 | 250 |
| 4 | 2016年11月16日16:00至19日14:00 | PM2.5 | 静稳型 | 低压带型 | 332 |
| 5 | 2016年11月19日18:00至21日15:00 | PM2.5 | 静稳型 | 河套倒槽前部型 | 270 |
| 6 | 2016年11月23日23:00至12月1日15:00 | PM2.5 | 静稳型 | 均压场 | 258 |
| 7 | 2016年12月1日20:00至5日09:00 | PM2.5 | 静稳型 | 低压带型 | 278 |
| 8 | 2016年12月6日20:00至9日06:00 | PM2.5 | 静稳型 | 均压场 | 335 |
| 9 | 2016年12月9日20:00至11日04:00 | PM2.5 | 静稳型 | 华北高压后部型 | 253 |
| 10 | 2016年12月11日19:00至15日15:00 | PM2.5 | 静稳型 | 低压带型 | 337 |
| 11 | 2016年12月16日20:00至21日16:00 | PM2.5 | 静稳型 | 河套倒槽前部型 | 346 |
| 12 | 2016年12月29日19:00至2017年1月6日18:00 | PM2.5 | 静稳型 | 蒙古高压底前部型 | 397 |
| 13 | 2017年1月15日04:00至19日09:00 | PM2.5 | 静稳型 | 蒙古高压底前部型 | 292 |
| 14 | 2017年1月23日19:00至26日14:00 | PM2.5 | 静稳型 | 低压前部型 | 330 |
| 15 | 2017年1月27日21:00至29日08:00 | PM2.5 | 静稳型 | 低压带型 | 258 |
| 16 | 2017年1月31日10:00至2月1日19:00 | PM2.5 | 静稳型 | 均压场 | 232 |
| 17 | 2017年2月2日18:00至5日13:00 | PM2.5 | 静稳型 | 华北高压后部型 | 315 |
| 18 | 2017年2月13日20:00至15日17:00 | PM2.5 | 静稳型 | 华北高压后部型 | 252 |
| 19 | 2017年2月15日20:00至16日19:00 | PM2.5 | 静稳型 | 低压带型 | 315 |
| 20 | 2017年5月4日09:00至5日13:00 | PM10 | 沙尘型 | 均压场 | 290 |
| 21 | 2017年10月1日15:00至2日21:00 | PM2.5 | 静稳型 | 均压场 | 207 |
| 22 | 2017年12月2日18:00至3日17:00 | PM2.5 | 静稳型 | 蒙古高压底前部型 | 274 |
| 23 | 2017年12月25日20:00至27日14:00 | PM2.5 | 静稳型 | 华北高压后部型 | 242 |
| 24 | 2017年12月27日18:00至29日17:00 | PM2.5 | 静稳型 | 华北高压后部型 | 292 |
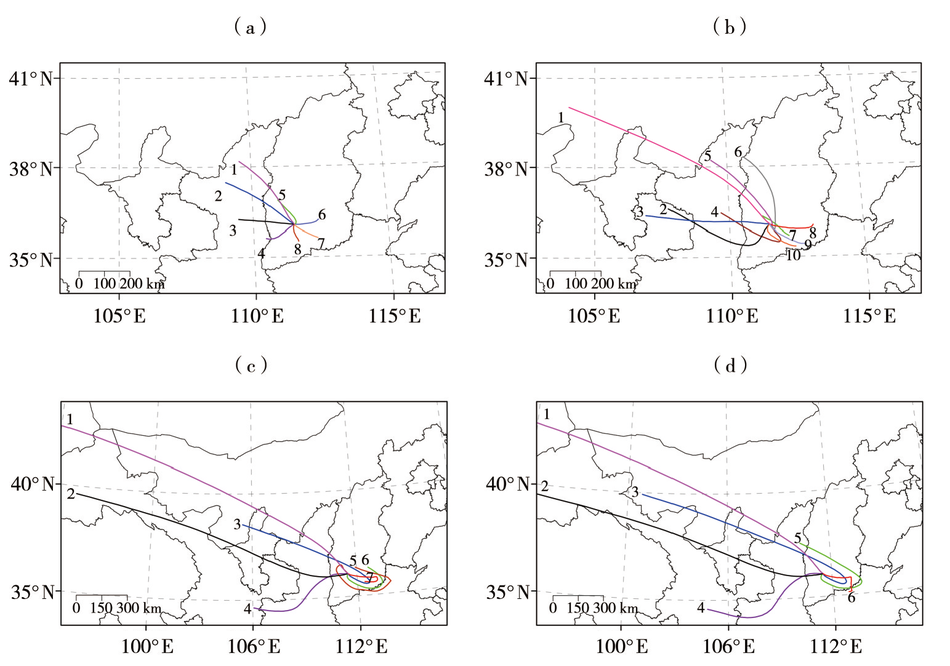
Fig.2 Cluster diagram of backward trajectory of air flow with the backward delay time of 12 h (a), 24 h (b), 48 h (c) and 60 h (d) for 24 pollution processes in Linfen City
Fig.2 Cluster diagram of backward trajectory of air flow with the backward delay time of 12 h (a), 24 h (b), 48 h (c) and 60 h (d) for 24 pollution processes in Linfen City

Fig.3 Backward trajectory of the 13th pollution process in Linfen City (a) and sea level pressure field (color shaded areas, Unit: hPa) and wind field (wind plumes, Unit: m·s-1, the black circles indicate calm wind) at 02:00 BST on 19 January 2017 (b) (The blue and red lines represent the trajectories before and after clustering, respectively. the same as below)
Fig.3 Backward trajectory of the 13th pollution process in Linfen City (a) and sea level pressure field (color shaded areas, Unit: hPa) and wind field (wind plumes, Unit: m·s-1, the black circles indicate calm wind) at 02:00 BST on 19 January 2017 (b) (The blue and red lines represent the trajectories before and after clustering, respectively. the same as below)

Fig.4 Backward trajectory of the 9th (a), 17th (c) and 18th (e) pollution processes in Linfen City and the sea-level pressure field (color shaded areas, Unit: hPa) and wind field (wind plumes, Unit: m·s-1,the black circles indicate calm wind) at 02:00 BST on 11 December 2016 (b), 14:00 BST on 3 (d) and 02:00 BST on 14 (f) February 2017
Fig.4 Backward trajectory of the 9th (a), 17th (c) and 18th (e) pollution processes in Linfen City and the sea-level pressure field (color shaded areas, Unit: hPa) and wind field (wind plumes, Unit: m·s-1,the black circles indicate calm wind) at 02:00 BST on 11 December 2016 (b), 14:00 BST on 3 (d) and 02:00 BST on 14 (f) February 2017

Fig.5 Backward trajectory of the 9th (a), 11th (c) and 22th (e) pollution processes in Linfen City and the sea-level pressure field (color filled areas, Unit: hPa) and wind field (wind plumes, Unit: m·s-1, the black circles indicate calm wind) at 20:00 BST on 10 (b), 20:00 BST on 16 (d) December 2016 and 20:00 BST on 2 December 2017 (f)
Fig.5 Backward trajectory of the 9th (a), 11th (c) and 22th (e) pollution processes in Linfen City and the sea-level pressure field (color filled areas, Unit: hPa) and wind field (wind plumes, Unit: m·s-1, the black circles indicate calm wind) at 20:00 BST on 10 (b), 20:00 BST on 16 (d) December 2016 and 20:00 BST on 2 December 2017 (f)

Fig.6 Backward trajectory of airflow from 22 to 25 January 2016 in Linfen City (a), the sea-level pressure field (color shaded areas, Unit: hPa) and wind field (wind plumes, Unit: m·s-1) at 14:00 BST on 22 January 2016 (b)
Fig.6 Backward trajectory of airflow from 22 to 25 January 2016 in Linfen City (a), the sea-level pressure field (color shaded areas, Unit: hPa) and wind field (wind plumes, Unit: m·s-1) at 14:00 BST on 22 January 2016 (b)
| [1] | 中华人民共和国生态环境部. 2018年中国生态环境状况公报[R/OL].(2019-05-29)[2022-08-17]. https://www.mee.gov.cn/hjzl/sthjzk/zghjzkgb/201905/P0201906195876-32630618.pdf |
| [2] | 中华人民共和国生态环境部. 2019年中国生态环境状况公报[R/OL]. (2020-06-02)[2022-08-17]. https://www.mee.gov.cn/hjzl/sthjzk/zghjzkgb/202006/P0202006025094-64172096.pdf |
| [3] | 中华人民共和国生态环境部. 2020年中国生态环境状况公报[R/OL]. (2021-05-26)[2022-08-17]. https://www.mee.gov.cn/hjzl/sthjzk/zghjzkgb/202105/P0202105265727-56184785.pdf |
| [4] | 郭新彪, 魏红英. 大气PM2.5对健康影响的研究进展[J]. 科学通报, 2013, 58(13):1171-1177. |
| [5] | 吕明辉, 张晓美, 李筱竹, 等. 京津冀地区霾健康气象服务社会经济效益评价研究[J]. 气象与环境科学, 2020, 43(3):18-23. |
| [6] | 段培法, 孙雪, 张璇, 等. 江苏省大气污染物健康风险评价[J]. 气象与环境科学, 2021, 44(2):87-95. |
| [7] | 王华, 轩春怡, 吴方, 等. 北京两次重污染沙尘天气成因及动力传输特征的对比研究[J]. 沙漠与绿洲气象, 2020, 14(4):18-26. |
| [8] | 王珊, 廖婷婷, 王莉莉, 等. 西安一次霾重污染过程大气环境特征及气象条件影响分析[J]. 环境科学学报, 2015, 35(11):3452-3462. |
| [9] | 赵克明, 李霞, 孙鸣婧, 等. 乌鲁木齐冬季浅薄型焚风对扩散条件及污染物浓度的影响[J]. 沙漠与绿洲气象, 2019, 13(1):13-20. |
| [10] | 齐佳慧, 郝巨飞, 王丛梅, 等. 河北邢台市连续重污染天气维持与消散成因分析[J]. 沙漠与绿洲气象, 2019, 13(1):122-129. |
| [11] | 王莉莉, 王跃思, 王迎红, 等. 北京夏末秋初不同天气形势对大气污染物浓度的影响[J]. 中国环境科学, 2010, 30(7):924-930. |
| [12] | 张莹, 王式功, 贾旭伟, 等. 华北地区冬半年空气污染天气客观分型研究[J]. 环境科学学报, 2018, 38(10):3826-3833. |
| [13] | 马小会, 廖晓农, 唐宜西, 等. 北京地区重空气污染天气分型及个例分析[J]. 气象与环境学报, 2017, 33(5):53-60. |
| [14] | 赵娜, 马翠平, 李洋, 等. 河北重度污染天气分型及其气象条件特征[J]. 干旱气象, 2017, 35(5):839-846. |
| [15] | 王琼, 沈瑞珊, 庞杨. 河北省重污染天气分型及其预报概念模型研究[J]. 气象与环境科学, 2020, 43(4):105-112. |
| [16] | 杨旭, 张小玲, 康延臻, 等. 京津冀地区冬半年空气污染天气分型研究[J]. 中国环境科学, 2017, 37(9):3201-3209. |
| [17] | 段云霞, 李得勤, 田莉, 等. 辽宁省中部一次重污染过程城市间污染差异及成因[J]. 干旱气象, 2020, 38(2):301-312. |
| [18] |
尹承美, 何建军, 于丽娟, 等. 多尺度气象条件对济南PM2.5污染的影响[J]. 高原气象, 2019, 38(5):1120-1128.
DOI |
| [19] | 杨晓春, 杜萌萌, 吴其重, 等. 西安地区一次重污染过程的气象条件及轨迹分析[J]. 干旱气象, 2016, 34(3):547-552. |
| [20] |
ANTTILA P, STEFANOVSKA A, NESTOROVSKA-KRSTESKA A, et al. Characterisation of extreme air pollution episodes in an urban valley in the Balkan Peninsula[J]. Air Quality Atmosphere and Health, 2016, 9(2):129-141.
DOI URL |
| [21] | 桂海林, 江琪, 康志明, 等. 2016年冬季北京地区一次重污染天气过程边界层特征[J]. 中国环境科学, 2019, 39(7):2739-2747. |
| [22] | 李树岭, 赵玲, 花丛, 等. 哈尔滨市冬半年污染传输特征及潜在源区分析[J]. 气象与环境科学, 2021, 44(1):81-88. |
| [23] | DRAXLER R R, HESS G D. Description of the HYSPLIT4 modelling system[R]. Sliver Spring, Maryland: NOAA, Air Resources Laboratory, 1997. |
| [24] | 中国环境科学研究院, 中国环境监测总站. 环境空气质量指数(AQI)技术规定(试行): HJ633—2012[S]. 北京: 中国环境科学出版社, 2012. |
| [25] | 郭立平, 乔林, 石茗化, 等. 河北廊坊市连续重污染天气的气象条件分析[J]. 干旱气象, 2015, 33(3):497-504. |
| [26] | 闫世明, 王雁, 张岳军, 等. 五台山春季气溶胶传输特征[J]. 中国环境科学, 2020, 40(2):497-505. |
| [27] | 任浦慧, 解静芳, 姜洪进, 等. 太原市大气PM2.5季节传输路径和潜在源分析[J]. 中国环境科学, 2019, 39 (8):3144-3151. |
| [28] | CHENG I, ZHANG L, BLANCHARD P, et al. Concentration-weighted trajectory approach to identifying potential sources of speciated atmospheric mercury at an urban coastal site in Nova Scotia, Canada[J]. Atmospheric Chemistry & Physics Discussions, 2013, 13(12): 6031-6048. |
| [29] | 闫世明, 王雁, 郭伟, 等. 太原市秋冬季大气污染特征和输送路径及潜在源区分析[J]. 环境科学, 2019, 40(11):4801-4809. |
| [30] | 曾鹏, 辛存林, 于奭, 等. 典型西南工业城市春冬季PM2.5来源与潜在源区分析——以柳州市为例[J]. 中国环境科学, 2020, 40(9):3781-3790. |
| [31] | 段时光, 姜楠, 杨留明, 等. 郑州市冬季大气PM2.5传输路径和潜在源分析[J]. 环境科学, 2019, 40(1):86-93. |
| [32] |
ZHANG F S, ZHU L Y, YAN S M, et al. Analysis of the carbon dioxide mole fraction variation and its transmission characteristics in Taiyuan[J]. Atmospheric and Oceanic Science Letters, 2020, 13(4):363-370.
DOI URL |
| [33] |
BORGE R, LUMBRERAS J, VARDOULAKIS S, et al. Analysis of long-range transport influences on urban PM10 using two-stage atmospheric trajectory clusters[J]. Atmospheric Environment, 2007, 41(21): 4434-4450.
DOI URL |
| [34] | WANG Y Q, ZHANG X Y, DRAXLER R R. TrajStat: GIS-based software that uses various trajectory statistical analysis methods to identify potential sources from long-term air pollution measurement data[J]. Environmental Modelling & Software, 2009, 24(8): 938-939. |
| [35] | 李令军, 王英, 李金香, 等. 2000-2010北京大气重污染研究[J]. 中国环境科学, 2012, 32(1):23-30. |
| [36] | 赵敬国, 王式功, 张天宇, 等. 兰州市大气重污染气象成因分析[J]. 环境科学学报, 2015, 35(5):1547-1555. |
| [37] | 张书娟, 刘耀龙. 小气候对临汾市空气污染的影响机制探讨[J]. 资源环境与发展, 2010(3):37-41. |
| [1] | MA Simin, MU Jianhua, SHU Zhiliang, SUN Yanqiao, DENG Peiyun, ZHOU Nan. Topography sensitivity simulation test of a typical rainstorm process in Liupan Mountain region [J]. Journal of Arid Meteorology, 2022, 40(3): 457-468. |
| [2] | WU Dan,LI Meiqi,GUO Rui,JIA Xiaowei,LIU Hao,LIU Quan. Low-level Wind Shear and Its Weather Situation at Shijiazhuang Zhengding International Airport from 2014 to 2017 [J]. Journal of Arid Meteorology, 2021, 39(5): 775-784. |
| [3] | XU Lina, LI Zhong, HU Yanan, GU Xinbo. Analysis on Meteorological Conditions About Frequent Air Pollution in Hohhot in Winter of 2019 [J]. Journal of Arid Meteorology, 2021, 39(1): 112-118. |
| [4] | MA Minjin, SU Yumeng, DING Fan, YANG Yi, HUANG Wanlong, TAN Changrong. Similarities and Differences of Air Pollution Between Lanzhou and Its Satellite City and Meteorological Influence Factors [J]. Journal of Arid Meteorology, 2020, 38(5): 834-846. |
| [5] | ZHANG Weiwei, ZHANG Mei, WU Yang, YU Bu. Evaluation of Spatial Interpolation Method About Climatic Elements in Summer in Zhejiang Province Under Complex Topography [J]. Journal of Arid Meteorology, 2020, 38(4): 674-682. |
| [6] | WU Zhanping, BAI Hui, CHEN Zaoyang, WANG Yuetong, WU Zhehong. Analysis of Meteorological Conditions of Two Air Pollution Processes in Guiyang [J]. Journal of Arid Meteorology, 2019, 37(5): 827-835. |
| [7] | ZHU Ping, YU Xiaoding, WANG Zhenhui, XIAO Jianshe. Temporal and Spatial Distribution Characteristics of Disastrous Convective Weather over the Qinghai Plateau [J]. Journal of Arid Meteorology, 2019, 37(3): 377-. |
| [8] | SHANG Ziwei, NING Guicai, WANG Jiexin, CHENG Yifan, WANG Shigong. Relationship Between Air Pollution Index and Visibility,Relative Humidity in Ten Representative Cities of China [J]. Journal of Arid Meteorology, 2017, 35(4): 590-597. |
| [9] | XU Hong, CHENG Pan, WANG Ruili. Simulation and Diagnostic Analysis of a Rainstorm Process Influenced by Typhoon Haiyan (2013) on Hainan Island [J]. Journal of Arid Meteorology, 2016, 34(3): 503-510. |
| [10] | GUO Liping,QIAO Lin,SHI Minghua,WANG Xuguang. Analysis About Meteorological Conditions of Continuous Heavy Pollution Episodes in Langfang of Hebei Province [J]. Journal of Arid Meteorology, 2015, 33(3): 497-504. |
| [11] | NI Jiangbo,LI Wencai,SHANG Kezheng,WANG Shigong, LI Deshuai. Automatic Identificationand Prediction of Low Visibility Weather in North China [J]. Journal of Arid Meteorology, 2015, 33(1): 174-179. |
| [12] | HUANG He,YU Lei,WANG Zhichao,MA Hongqing,WANG Yingang. Analysis of Boundary Layer Easterly Wind Structure During a Returning Flow Snowing Weather Process [J]. Journal of Arid Meteorology, 2013, 31(4): 756-762. |
| [13] | WU Zhehong,CHEN Zhenhong,BAI Hui. Comparative Analysis on the Frontal Zone Feature of Two Freezing Rain and Snow Weather Processes in 2008 and 2011 in Guizhou Province [J]. Journal of Arid Meteorology, 2013, 31(4): 763-770. |
| [14] | WEI Yong,PENG Jun,RESULI Abula,WANG Cunliang,CHEN Jianmin. Comprehensive Analysis of a Severe Hail in the Middle Section on Northern Slope of Tianshan Mountain in Xinjiang [J]. Journal of Arid Meteorology, 2013, 31(4): 771-777. |
| [15] | DUAN Yuhui,WANG Wen,TIAN Zhiguang,ZHANG Nan. Comparison of Two Rain to Heavy Snowstorm Weather Processes Under the Similar Weather Situation in Northern Part of North China [J]. Journal of Arid Meteorology, 2013, 31(4): 784-789. |
| Viewed | ||||||
|
Full text |
|
|||||
|
Abstract |
|
|||||