Journal of Arid Meteorology ›› 2024, Vol. 42 ›› Issue (4): 563-575.DOI: 10.11755/j.issn.1006-7639(2024)-04-0563
• Articles • Previous Articles Next Articles
Analysis on the characteristics and causes of intraseasonal differences of the continuous rainfall in Hanjiang River Basin during the summer and autumn in 2021
XIAO Ying1,2,3,4( ), GAO Yaqi1,3,4, DU Liangmin1,3,4(), REN Yongjian2,5
- 1. Wuhan Regional Climate Center, Wuhan 430074, China
2. Key Laboratory of Tobacco Meteorology Research, Wuhan 430205, China
3. Three Gorges National Climatological Observatory, Yichang 443002,Hubei, China
4. Key laboratory of Basin Heavy Rainfall,CMA,Wuhan 430205,China
5. Hubei Meteorological Service Center,Wuhan 430205,China
-
Received:2023-10-18Revised:2024-05-11Online:2024-08-31Published:2024-09-13
汉江流域2021年伏秋连汛降水季内差异特征及成因分析
肖莺1,2,3,4(), 高雅琦1,3,4, 杜良敏1,3,4(), 任永建2,5
- 1.武汉区域气候中心,湖北 武汉 430074
2.湖北省烟草气象研究重点实验室,湖北 武汉 430205
3.三峡国家气候观象台,湖北 宜昌 443002
4.中国气象局流域强降水重点开放实验室,湖北 武汉 430205
5.湖北省气象服务中心,湖北 武汉 430205
-
通讯作者:杜良敏(1976—),男,湖北洪湖人,正高级工程师,主要从事气候变化、人工智能研究。E-mail:30698912@qq.com 。 -
作者简介:肖莺(1984—),女,江西吉安人,高级工程师,主要从事气候诊断预测研究。E-mail: xiaoying15036@163.com。 -
基金资助:中国气象局创新发展专项(CXFZ2024J002);湖北省烟草公司科技项目(027Y2022-006);长江流域气象开放基金项目(CJLY2022Y07);湖北省自然科学基金项目(2023AFD097);湖北省自然科学基金项目(2022CFD014);中国长江三峡电力股份有限公司项目(2423020048);湖北省气象局基金项目(2023Y06)
CLC Number:
Cite this article
XIAO Ying, GAO Yaqi, DU Liangmin, REN Yongjian. Analysis on the characteristics and causes of intraseasonal differences of the continuous rainfall in Hanjiang River Basin during the summer and autumn in 2021[J]. Journal of Arid Meteorology, 2024, 42(4): 563-575.
肖莺, 高雅琦, 杜良敏, 任永建. 汉江流域2021年伏秋连汛降水季内差异特征及成因分析[J]. 干旱气象, 2024, 42(4): 563-575.
share this article
Add to citation manager EndNote|Ris|BibTeX
URL: http://www.ghqx.org.cn/EN/10.11755/j.issn.1006-7639(2024)-04-0563
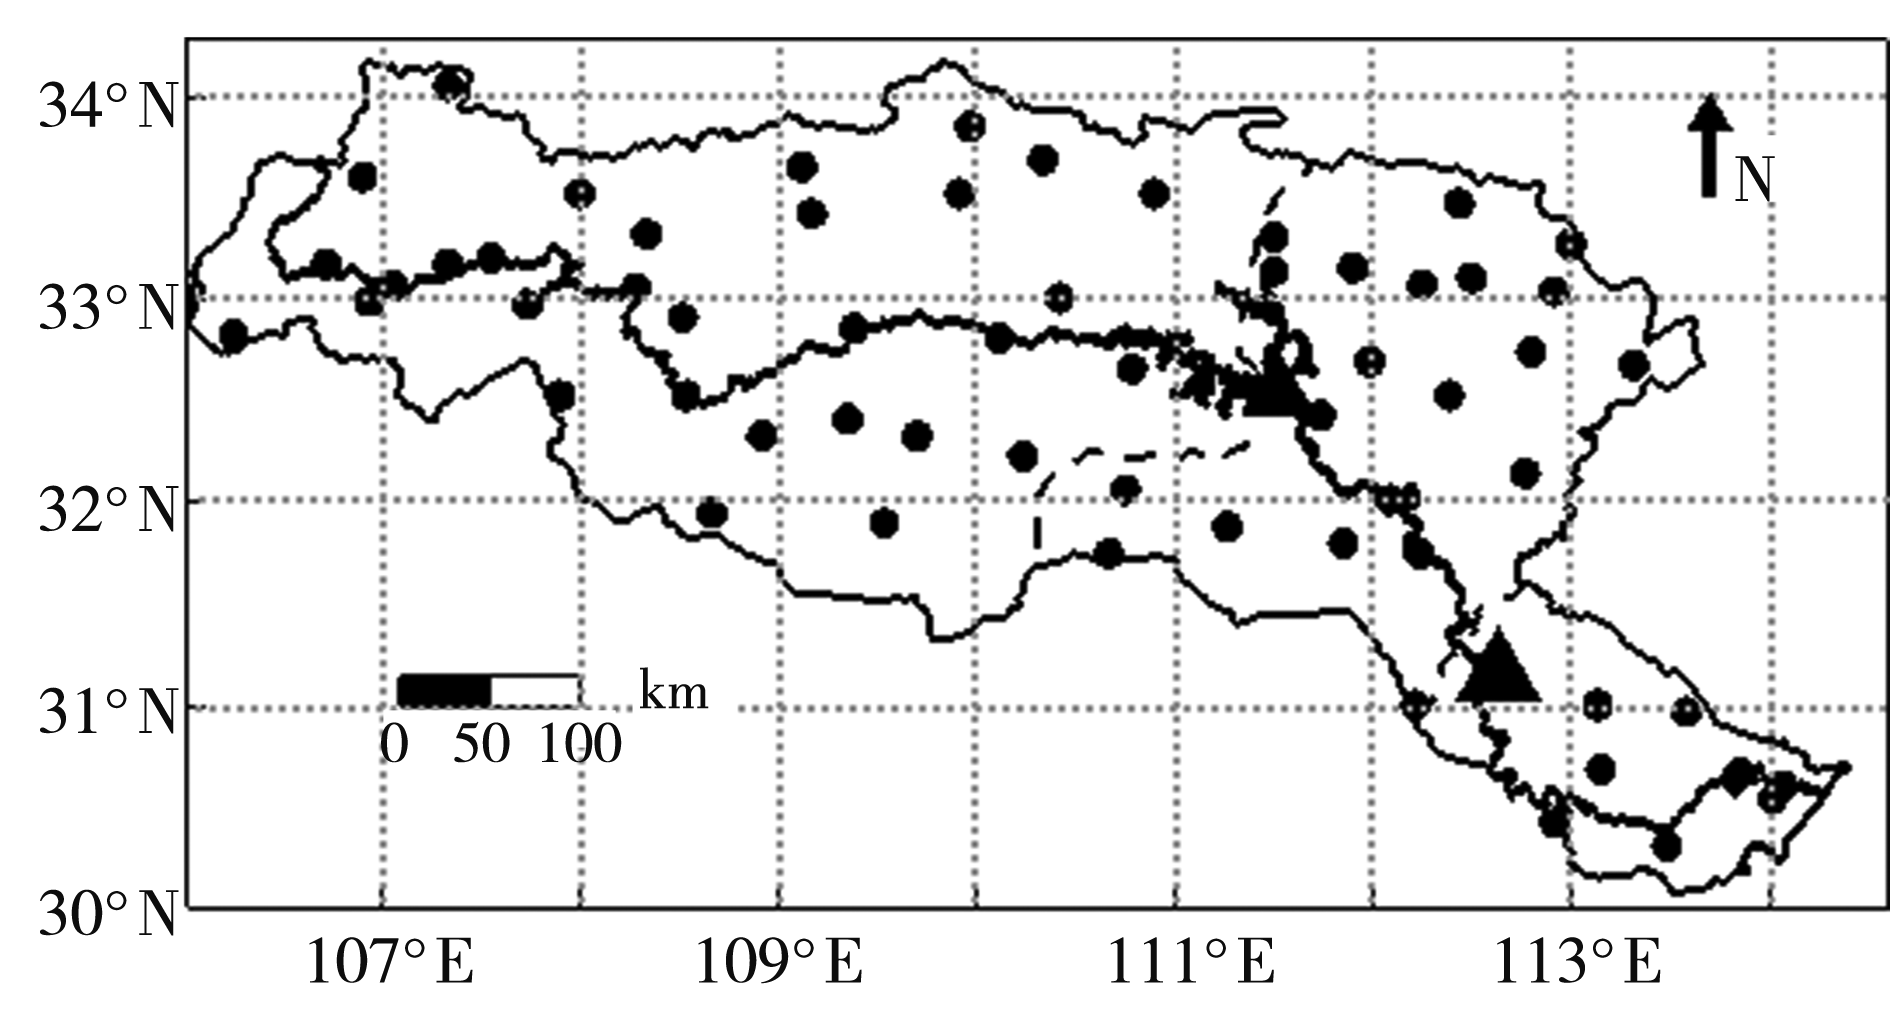
Fig.1 The spatial distribution of representative meteorological stations in the Hanjiang River Basin (Thick solid line represents Hanjiang, the black triangles represent Danjiangkou and Zhongxiang from left to right, respectively)
Fig.1 The spatial distribution of representative meteorological stations in the Hanjiang River Basin (Thick solid line represents Hanjiang, the black triangles represent Danjiangkou and Zhongxiang from left to right, respectively)
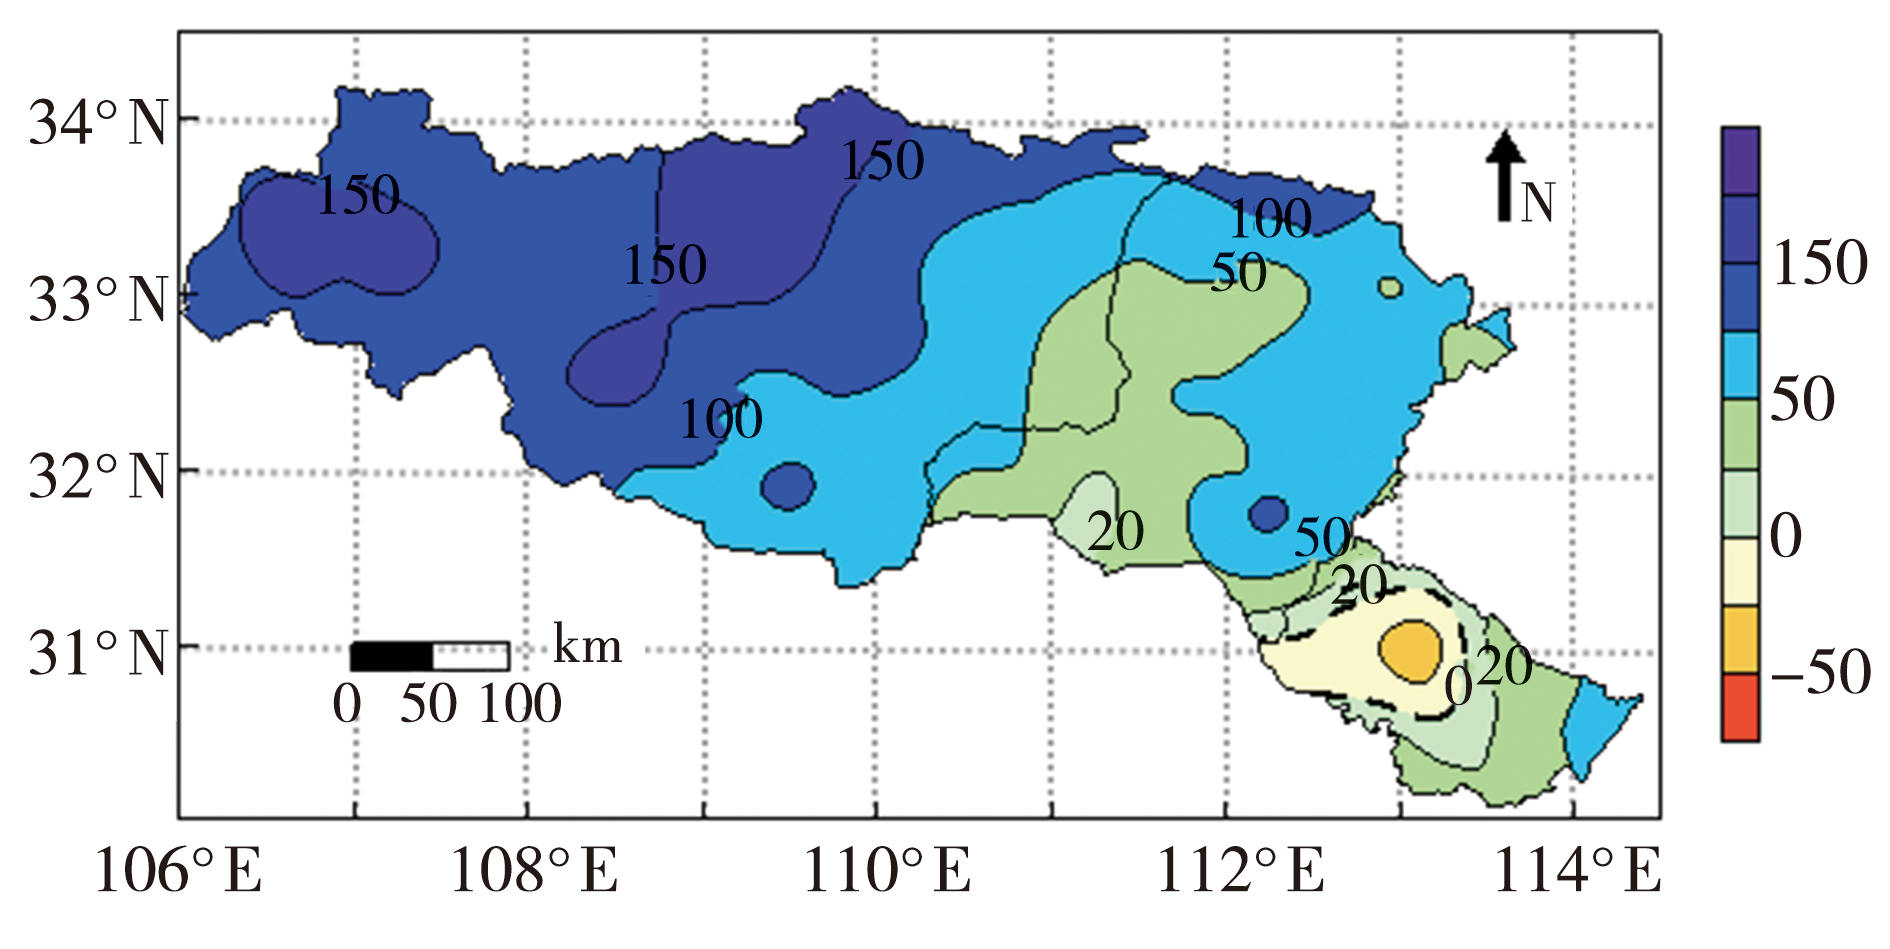
Fig.2 The spatial distributions of precipitation anomaly percentage in the Hanjiang River Basin from August to October in 2021 (Unit:%)
Fig.2 The spatial distributions of precipitation anomaly percentage in the Hanjiang River Basin from August to October in 2021 (Unit:%)

Fig.3 The box diagram of accumulated precipitation (a) and accumulated number of extreme precipitation stations (b) in the upper reaches of the Hanjiang River from August to October during1961-2021 (The upper dashed line represents 1 standard deviation, and the lower represents -1 standard deviation)
Fig.3 The box diagram of accumulated precipitation (a) and accumulated number of extreme precipitation stations (b) in the upper reaches of the Hanjiang River from August to October during1961-2021 (The upper dashed line represents 1 standard deviation, and the lower represents -1 standard deviation)
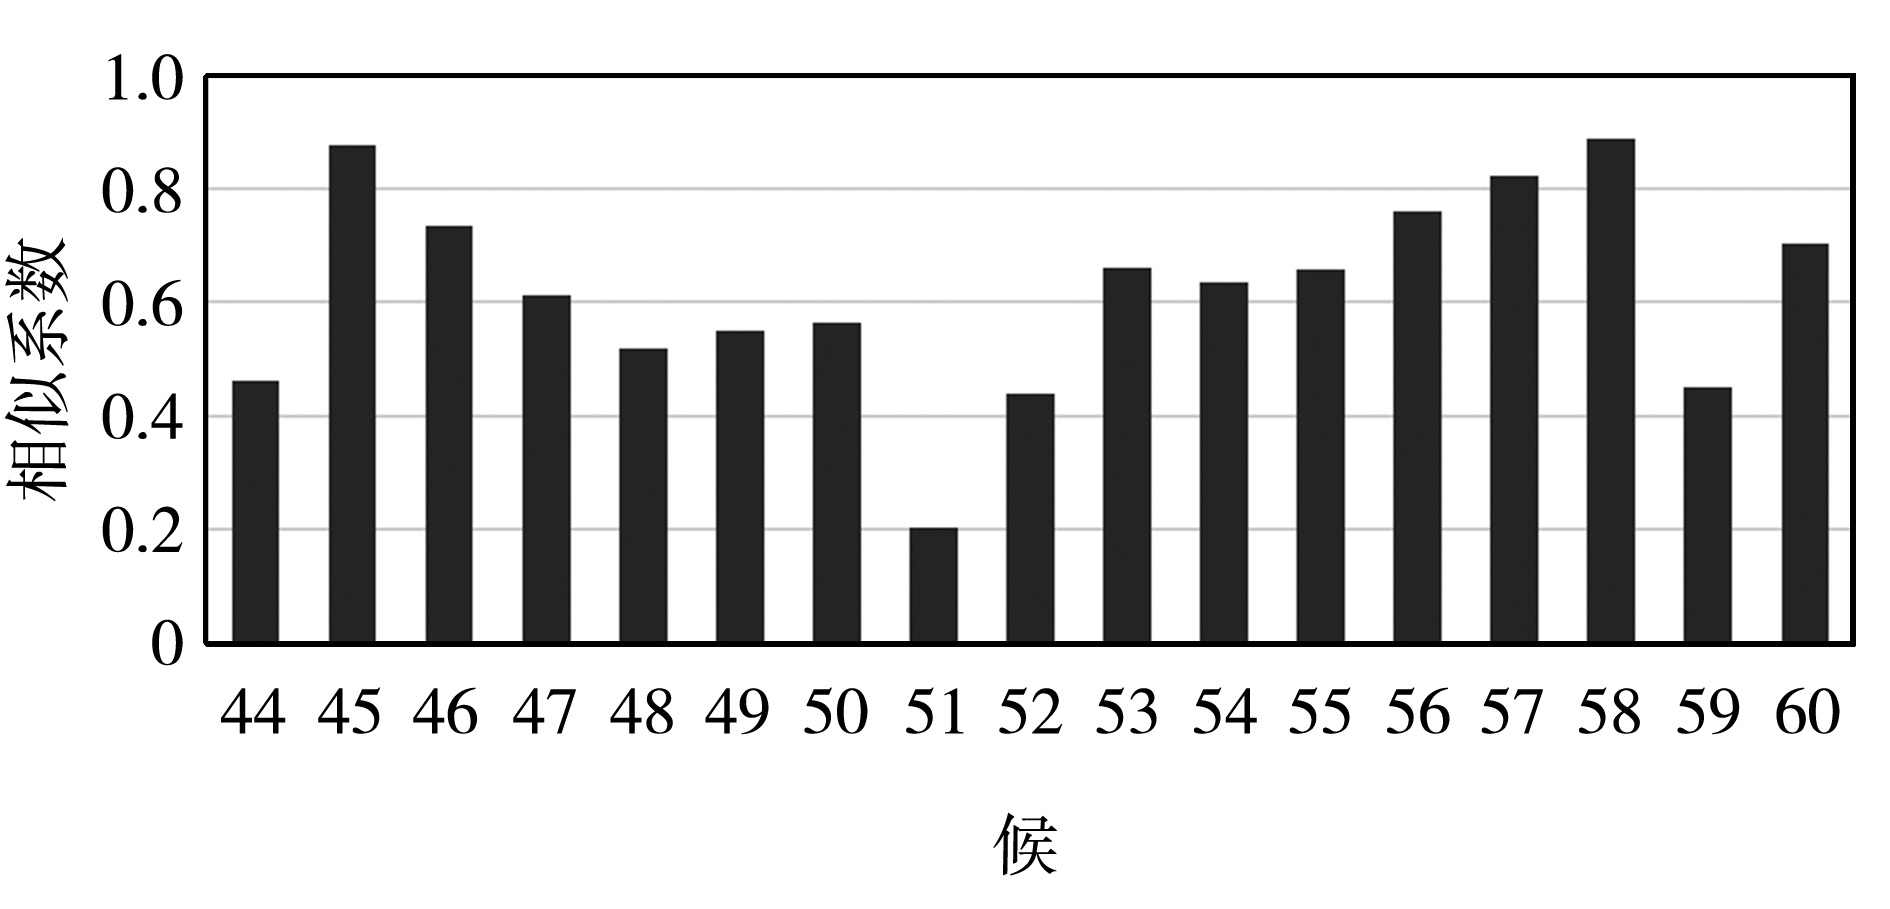
Fig.4 Spatial distance similarity coefficients of two adjacent pentad precipitation in the upper reaches of the Hanjiang River from August to October in 2021 (The horizontal axis value of 44 represents the similarity coefficient between 44th and 43rd candidates, and so on)
Fig.4 Spatial distance similarity coefficients of two adjacent pentad precipitation in the upper reaches of the Hanjiang River from August to October in 2021 (The horizontal axis value of 44 represents the similarity coefficient between 44th and 43rd candidates, and so on)

Fig.5 The precipitation anomaly percentage during P1 (a) and P2 (b) in the upper reaches of the Hanjiang River in 2021 (Unit: %)
Fig.5 The precipitation anomaly percentage during P1 (a) and P2 (b) in the upper reaches of the Hanjiang River in 2021 (Unit: %)
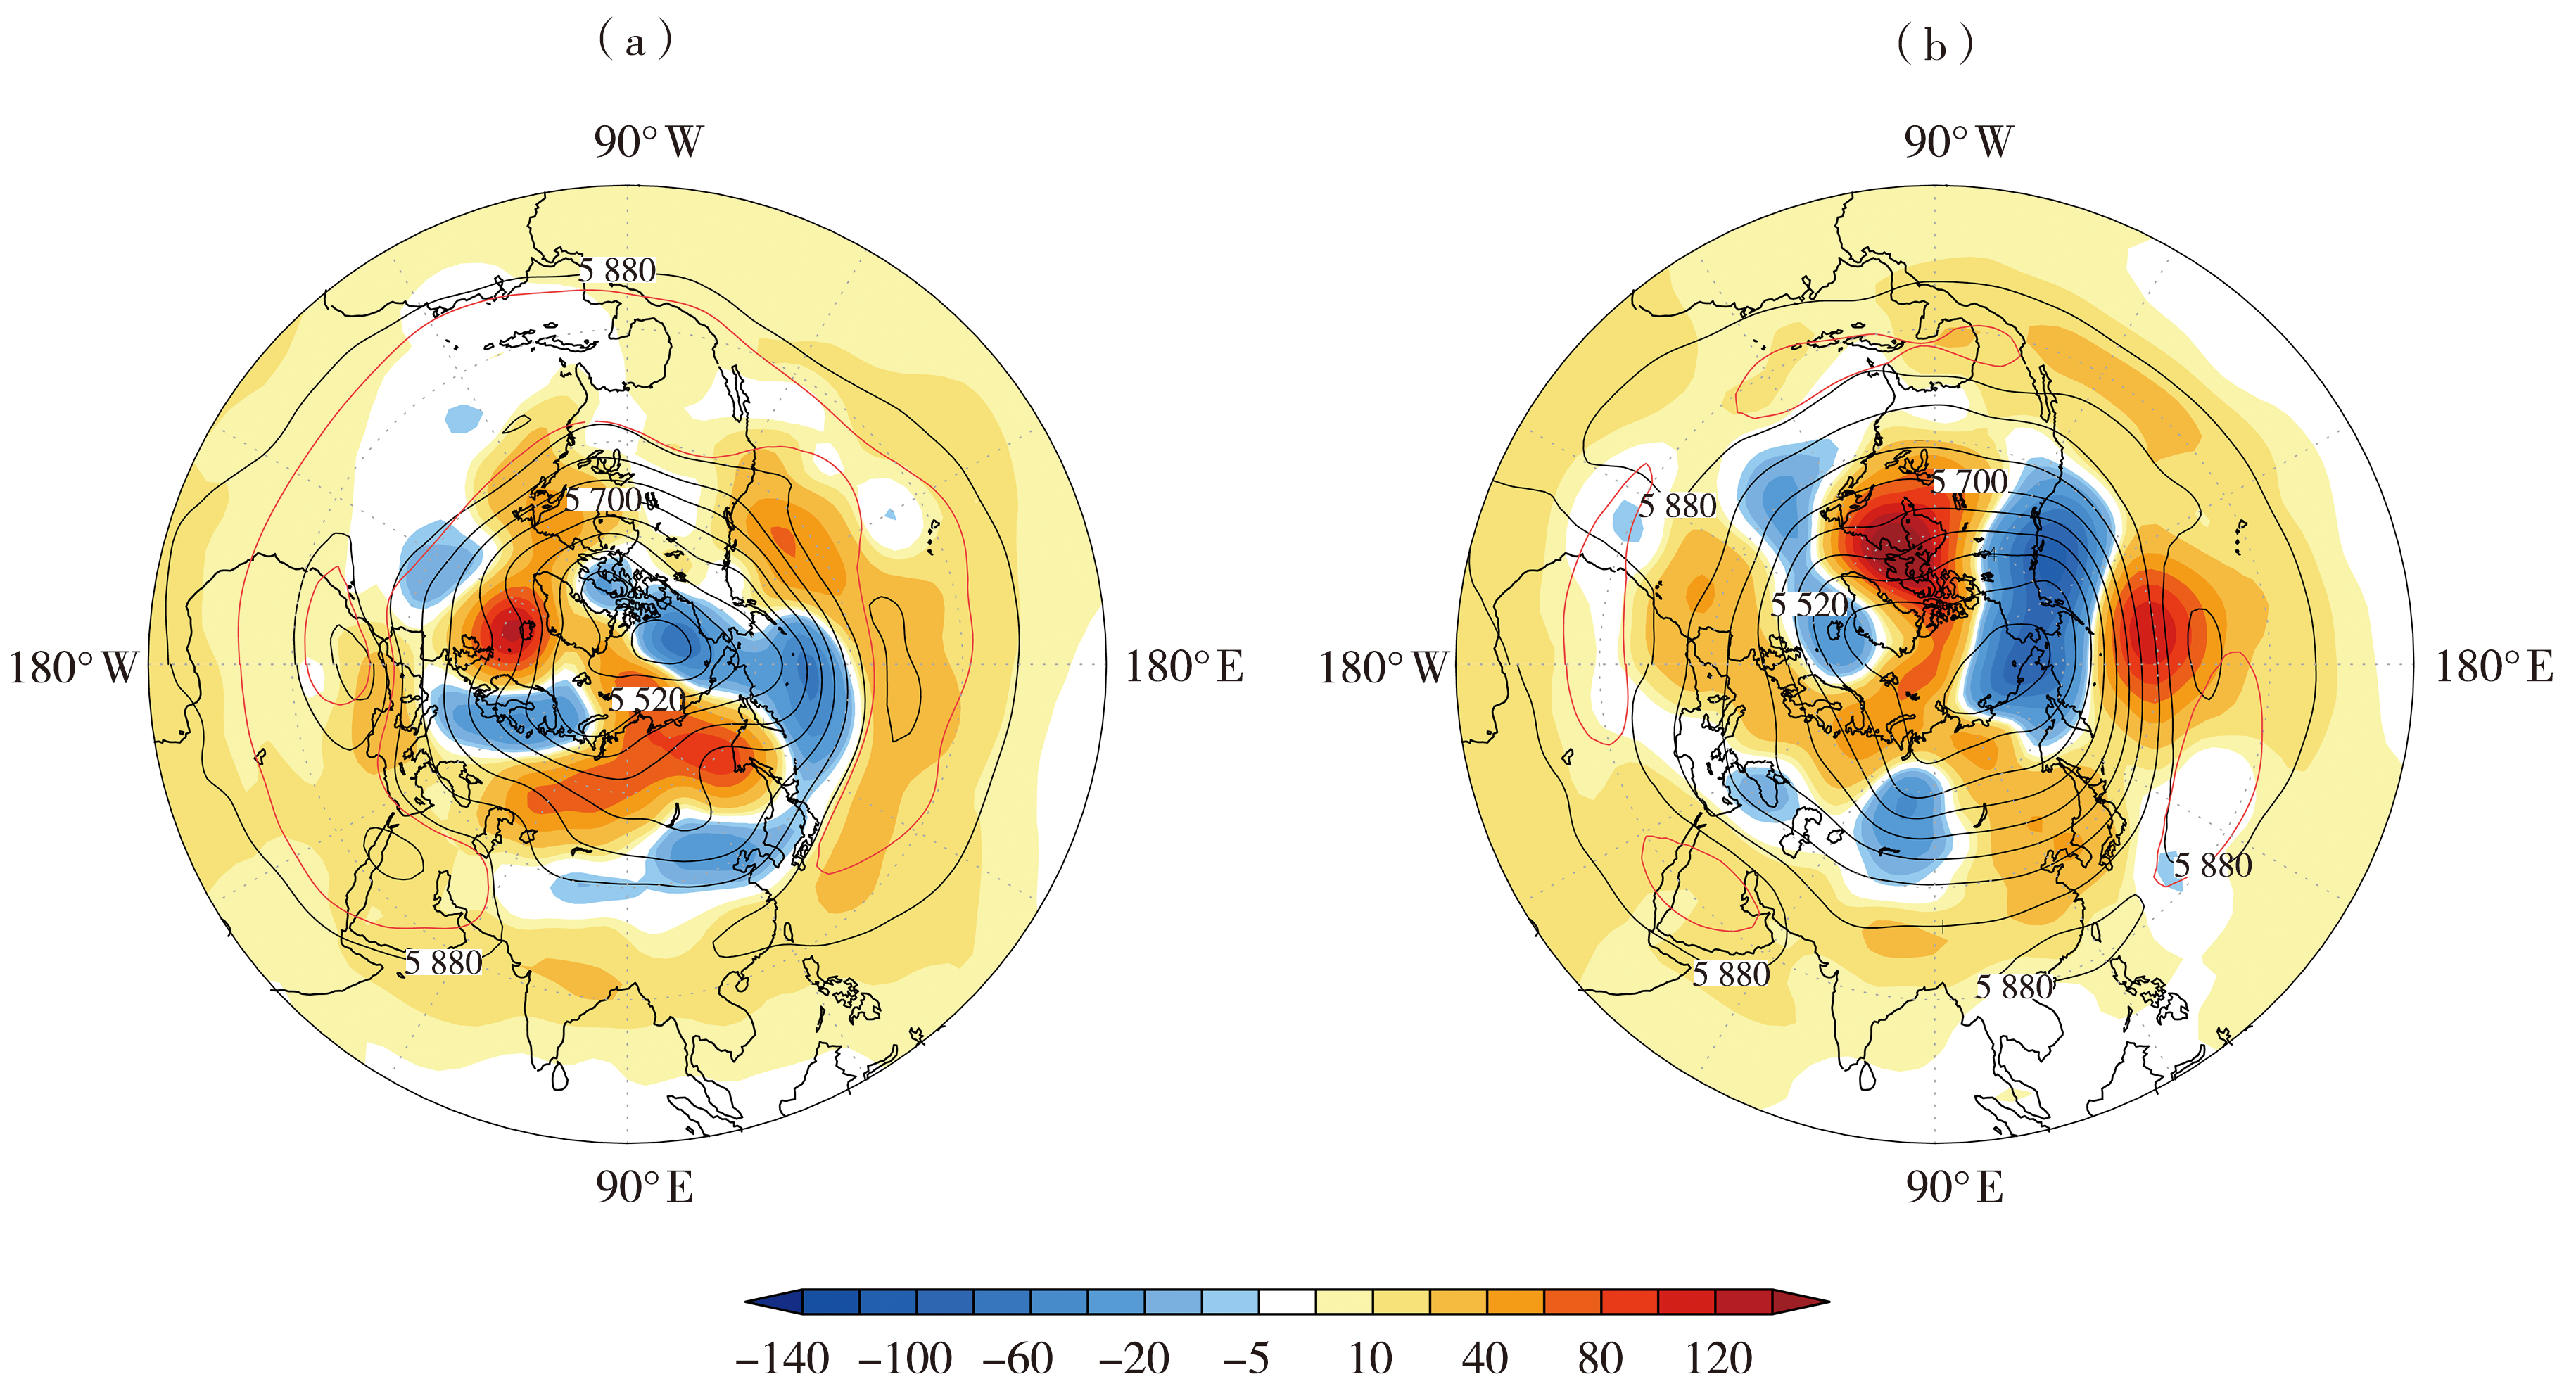
Fig.6 The 500 hPa geopotential height field (black isolines) and anomaly (the color shaded) during P1 (a) and P2 (b) period in 2021 (Unit: gpm) (The red lines indicate the climatic state greater than or equal to 5 880 gpm)
Fig.6 The 500 hPa geopotential height field (black isolines) and anomaly (the color shaded) during P1 (a) and P2 (b) period in 2021 (Unit: gpm) (The red lines indicate the climatic state greater than or equal to 5 880 gpm)

Fig.7 The spatial distribution of T-N wave activity flux (vectors, Unit: m2·s-2) and related stream function anomalies (the color shaded, Unit: 106 m2·s-1) during P1 (a) and P2 (b) period in 2021 (The red line indicates the upper reaches of the Hanjiang River. The same as below)
Fig.7 The spatial distribution of T-N wave activity flux (vectors, Unit: m2·s-2) and related stream function anomalies (the color shaded, Unit: 106 m2·s-1) during P1 (a) and P2 (b) period in 2021 (The red line indicates the upper reaches of the Hanjiang River. The same as below)

Fig.8 The distribution of vertically integrated water vapor flux (vectors, Unit: kg·m-1·s-1), water vapor flux divergence (color shaded, Unit: 10-5 kg·s-1·m-2) during P1 (a), P2 (b) period in 2021
Fig.8 The distribution of vertically integrated water vapor flux (vectors, Unit: kg·m-1·s-1), water vapor flux divergence (color shaded, Unit: 10-5 kg·s-1·m-2) during P1 (a), P2 (b) period in 2021

Fig.9 The distribution of correlation coefficients between areal rainfall in the upper reaches of the Hanjiang River and the zonal wind at 200 hPa during P1 (a) and P2 (b) period, 1961-2021 (Shaded areas with climatological wind speed greater than or equal to 30 m·s-1, the dotted area passed the significance test of α=0.05)
Fig.9 The distribution of correlation coefficients between areal rainfall in the upper reaches of the Hanjiang River and the zonal wind at 200 hPa during P1 (a) and P2 (b) period, 1961-2021 (Shaded areas with climatological wind speed greater than or equal to 30 m·s-1, the dotted area passed the significance test of α=0.05)
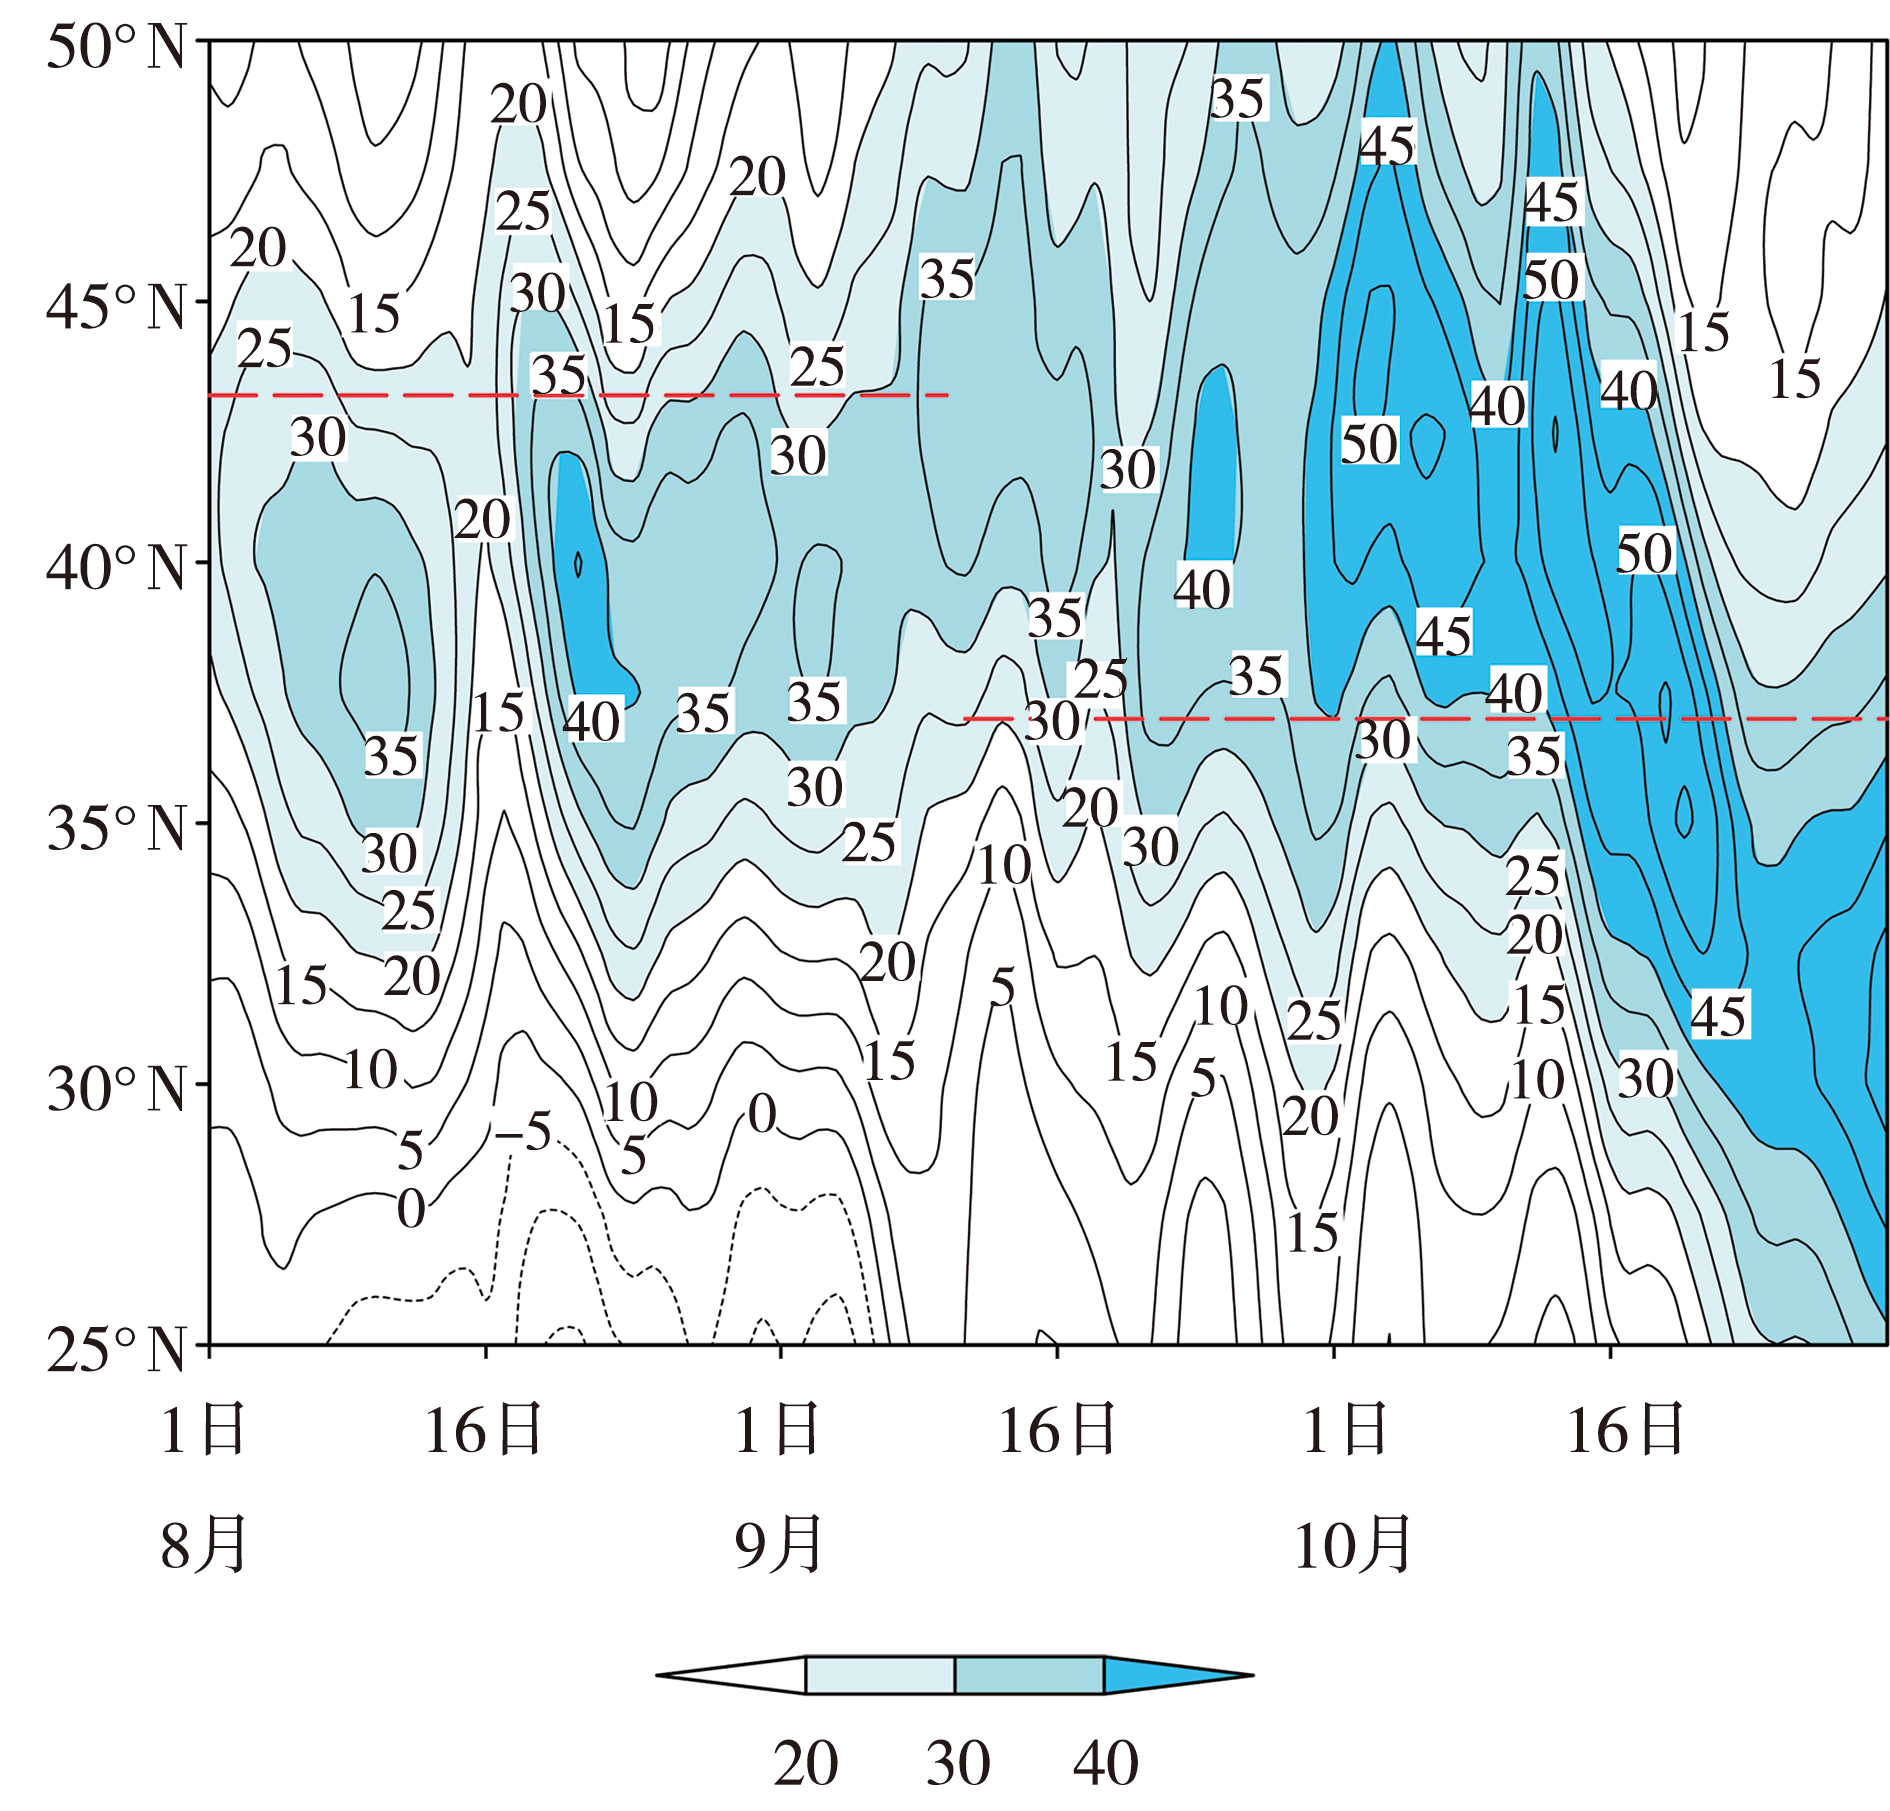
Fig.10 Latitude-time cross sections of zonal wind at 200 hPa averaged over 80°E—140°E from August 1 to October 31, 2021 (Unit: m·s-1) (Red dotted lines represent climatological westerly jet axes)
Fig.10 Latitude-time cross sections of zonal wind at 200 hPa averaged over 80°E—140°E from August 1 to October 31, 2021 (Unit: m·s-1) (Red dotted lines represent climatological westerly jet axes)
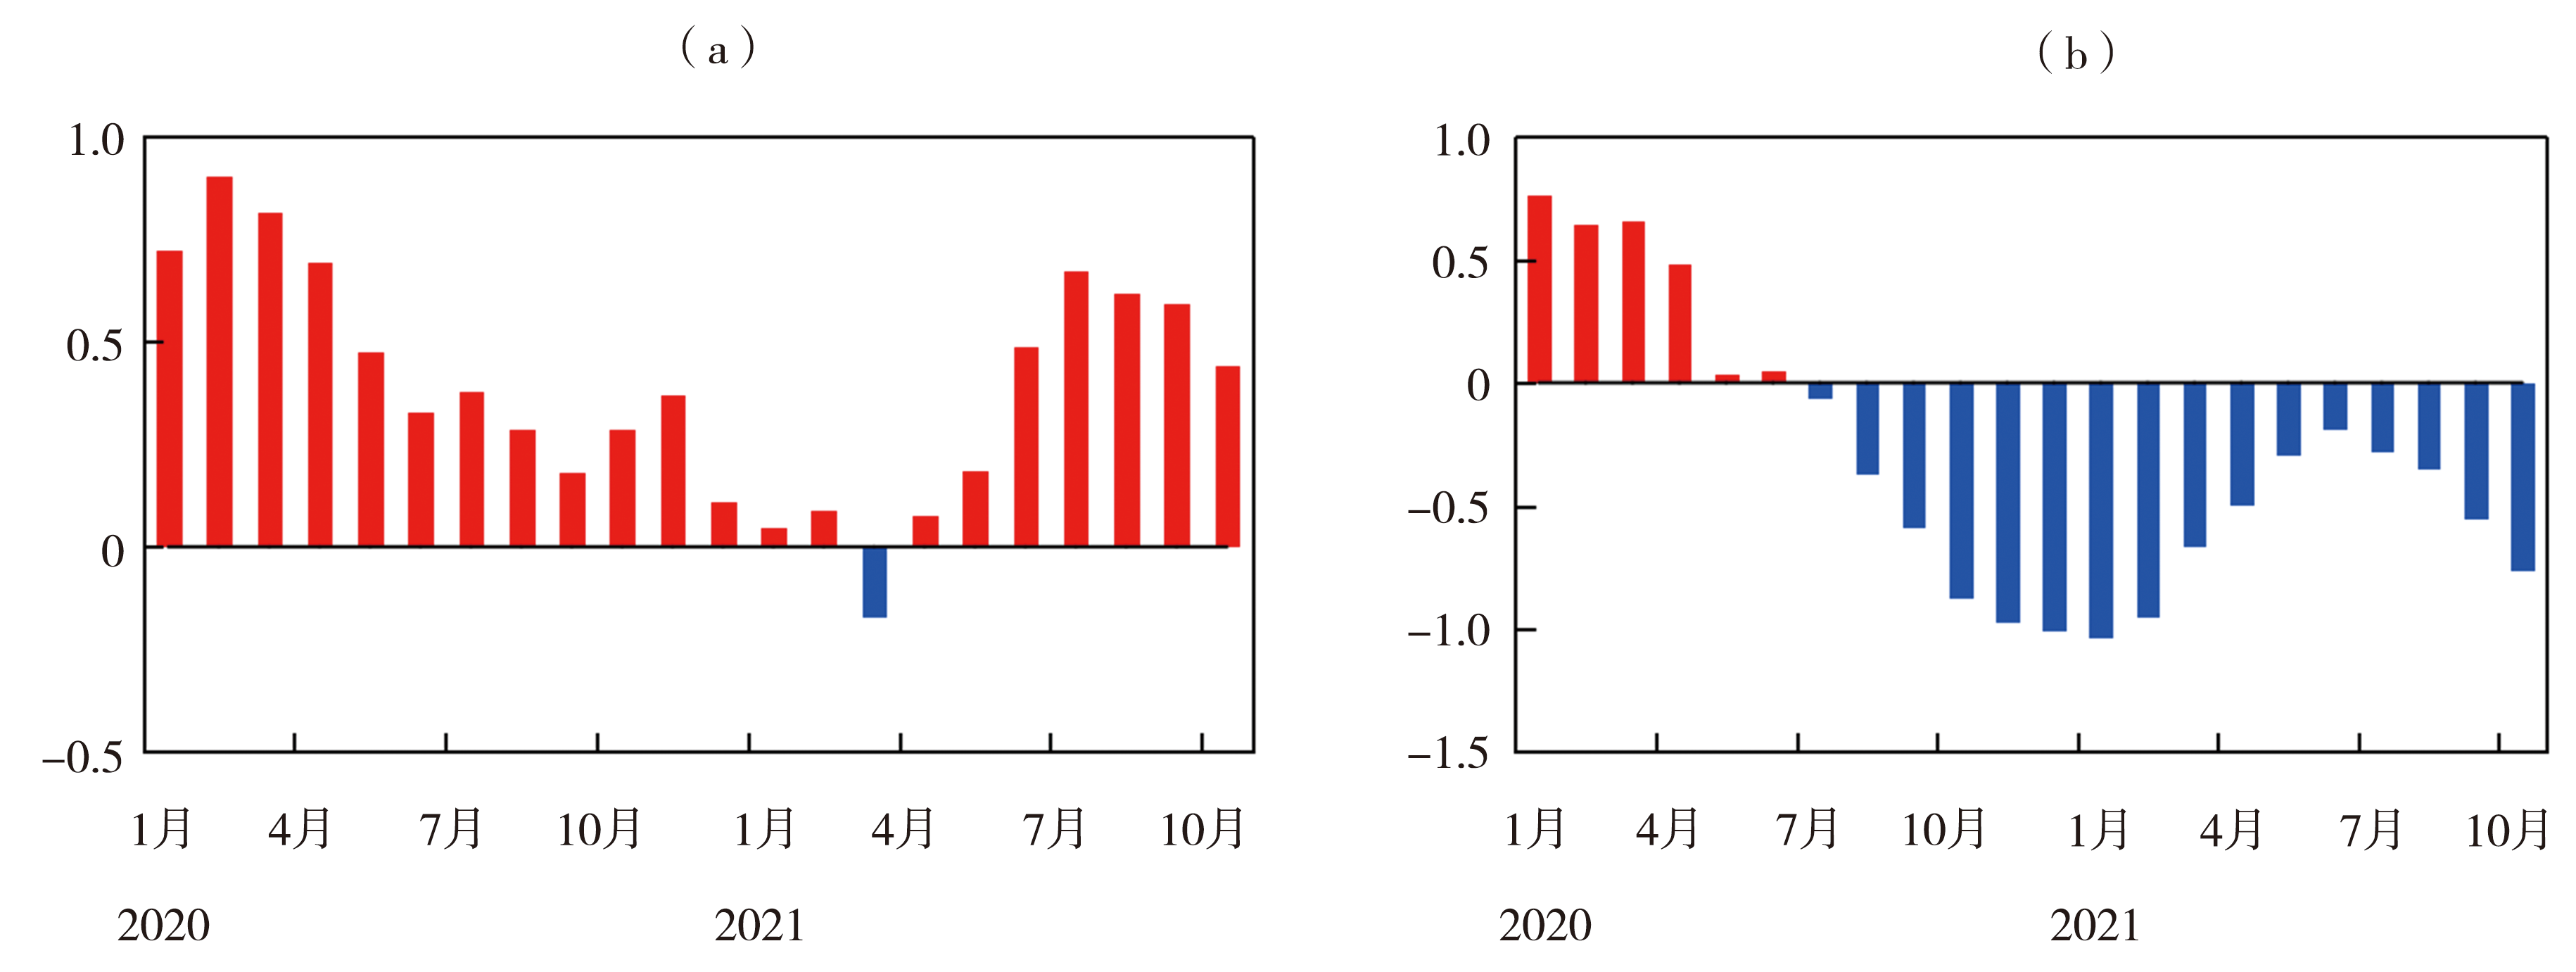
Fig.11 Monthly variation of TEAI (a) and EMPI (b) from January, 2020 to October, 2021
Fig.11 Monthly variation of TEAI (a) and EMPI (b) from January, 2020 to October, 2021
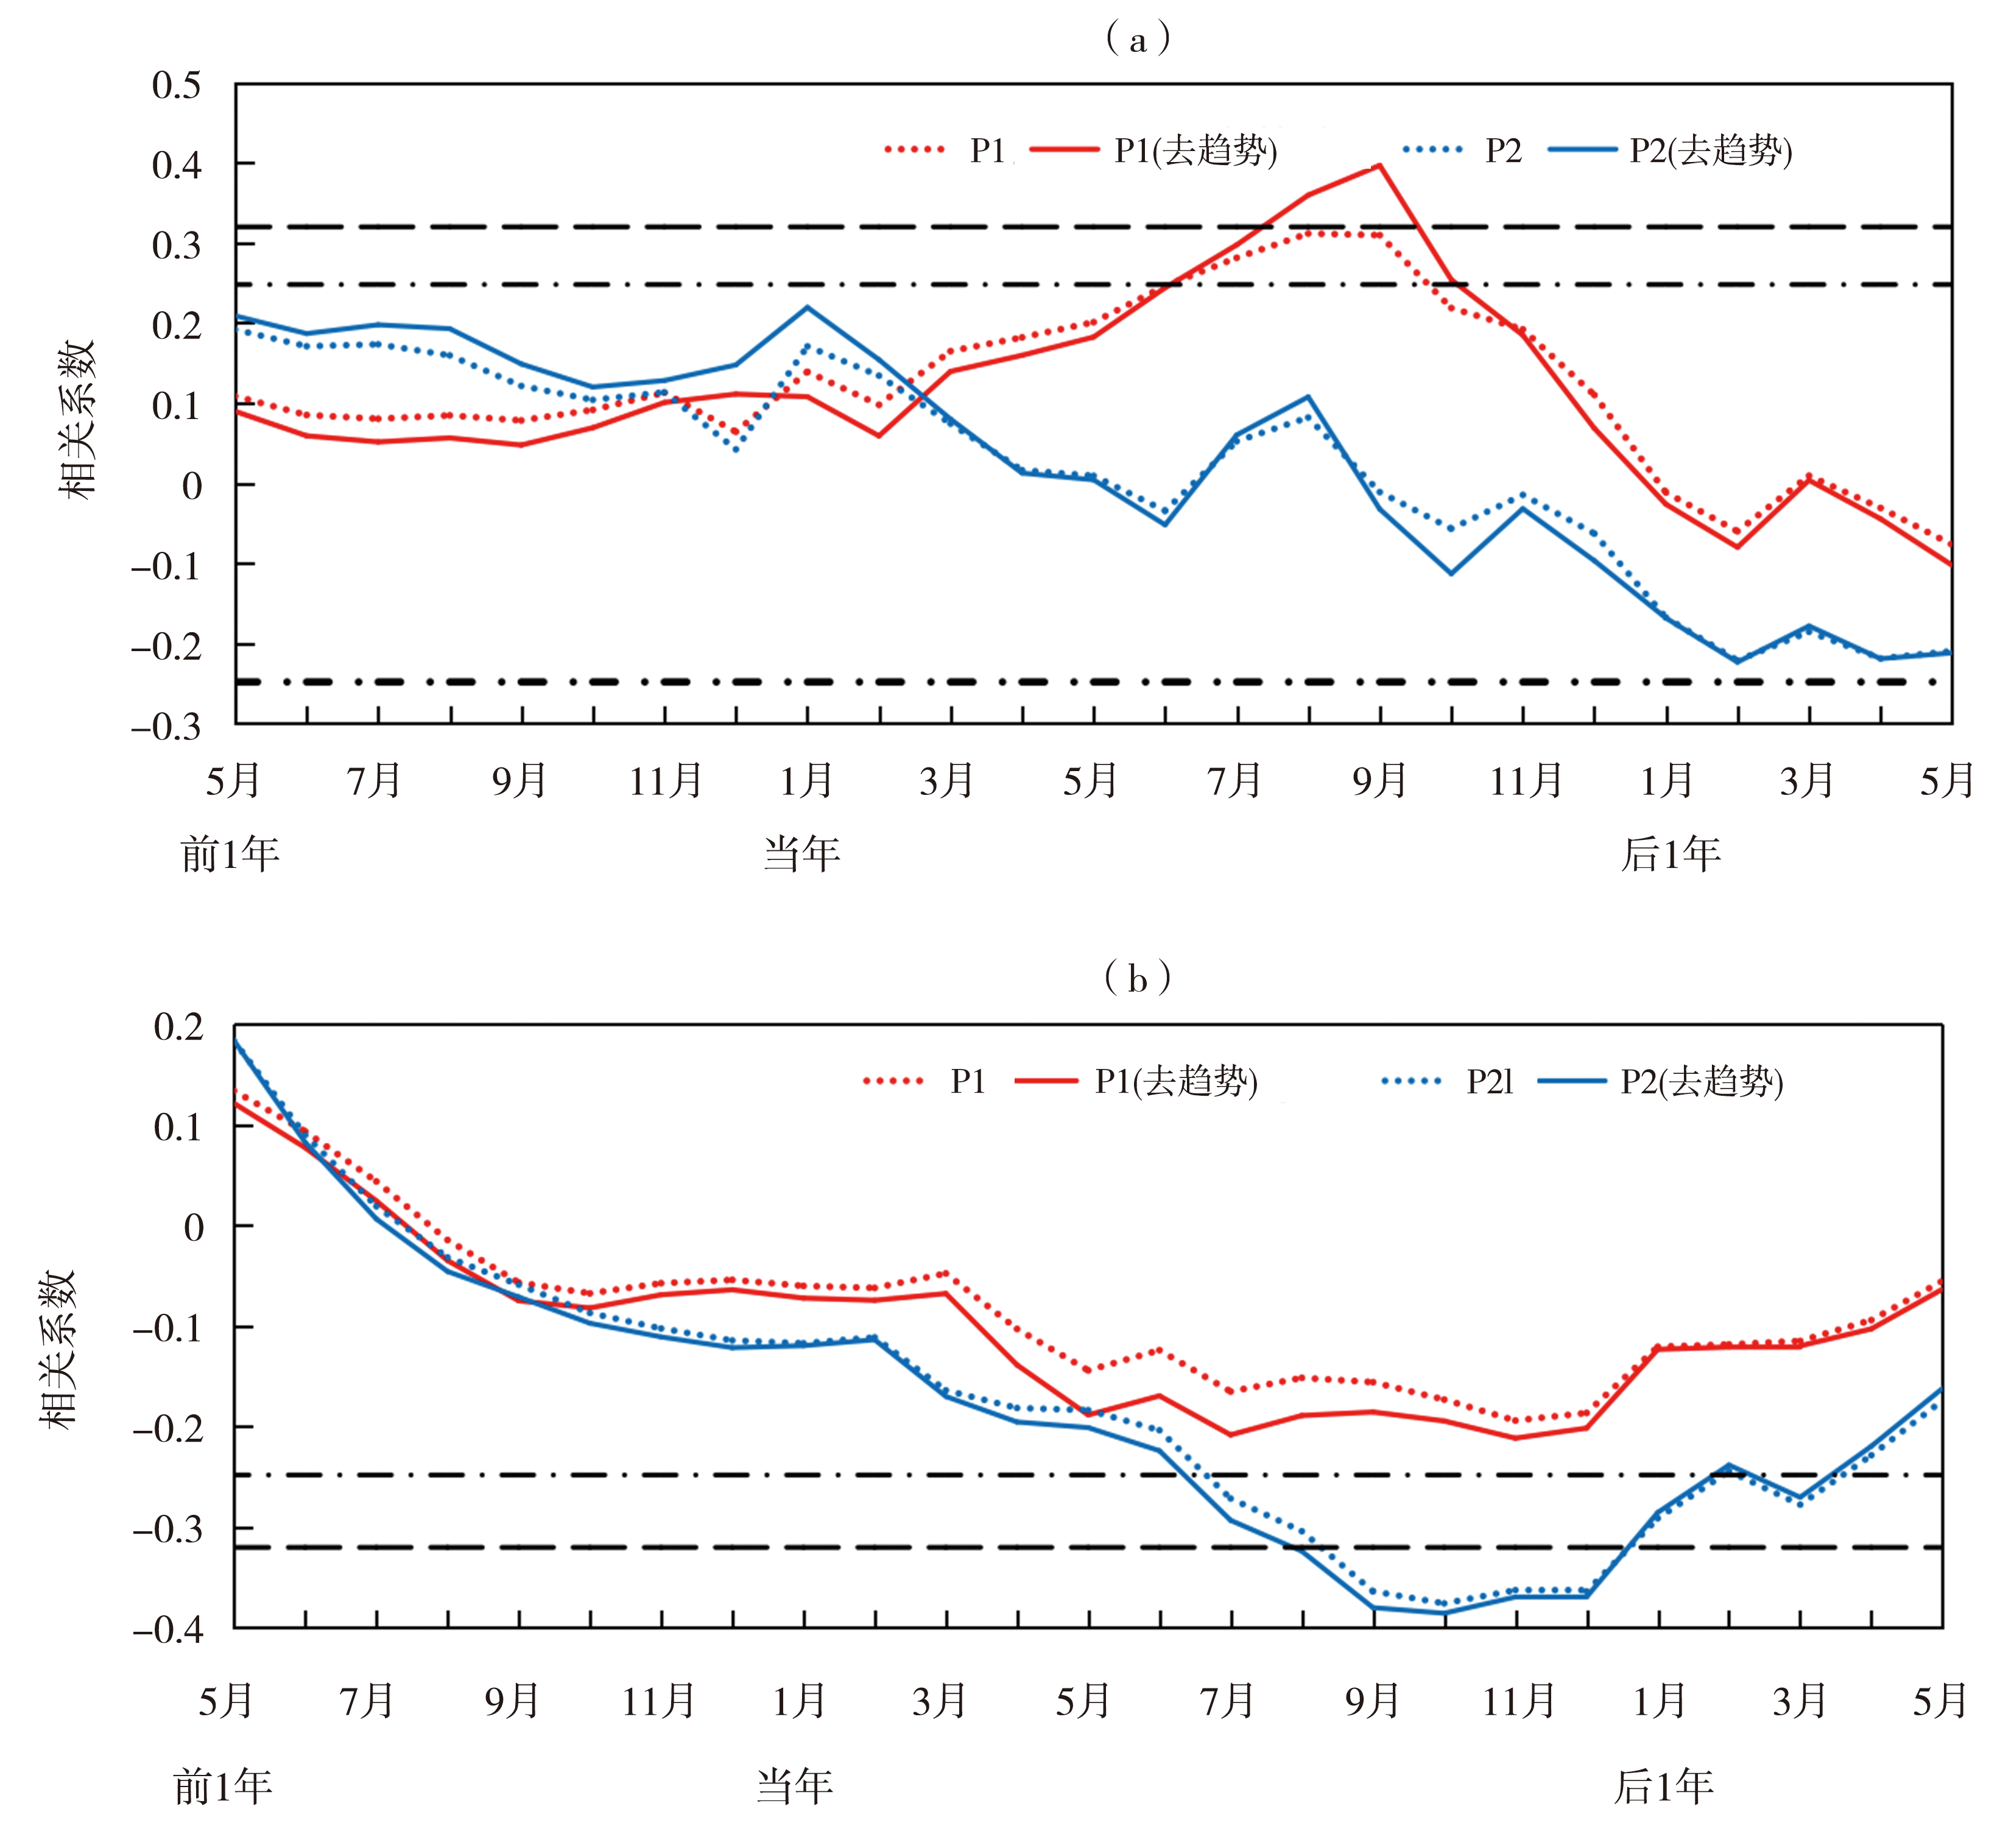
Fig.12 The lead-lag correlation coefficients between TEAI (a), EMPI (b) with area rainfall during P1 and P2 period (The dash-dotted and long dashed lines indicate the significance test of α=0.05 and α=0.01, respectively)
Fig.12 The lead-lag correlation coefficients between TEAI (a), EMPI (b) with area rainfall during P1 and P2 period (The dash-dotted and long dashed lines indicate the significance test of α=0.05 and α=0.01, respectively)

Fig.13 The distribution of correlation coefficients between the average June TEAI and 500 hPa geopotential height field in P1 period during 1961-2021, the 500 hPa geopotential height field (black isolines) and its anomaly (color shaded) during P1period in 2021 (b, Unit: gpm) (The dotted area passed the significance test of α=0.05, the red lines represent the climate state greater than or equal to 5 880 gpm)
Fig.13 The distribution of correlation coefficients between the average June TEAI and 500 hPa geopotential height field in P1 period during 1961-2021, the 500 hPa geopotential height field (black isolines) and its anomaly (color shaded) during P1period in 2021 (b, Unit: gpm) (The dotted area passed the significance test of α=0.05, the red lines represent the climate state greater than or equal to 5 880 gpm)

Fig.14 The correlation fields between the average July EMPI and 200 hPa zonal winds (a), 500 hPa geopotential heights (b) from 1961 to 2021, the correlation fields between geopotential height field in the key area with 500 hPa geopotential heights during P2 period in the North Pacific (color shaded) (c), 500 hPa height field (black isolines) and its anomalies (color shaded) from September 11 to October 31, 2021 (Unit: gpm) (d) (The dotted area passed the significance test of α=0.05, the red lines indicate the climatic state greater than or equal to 5 880 gpm)
Fig.14 The correlation fields between the average July EMPI and 200 hPa zonal winds (a), 500 hPa geopotential heights (b) from 1961 to 2021, the correlation fields between geopotential height field in the key area with 500 hPa geopotential heights during P2 period in the North Pacific (color shaded) (c), 500 hPa height field (black isolines) and its anomalies (color shaded) from September 11 to October 31, 2021 (Unit: gpm) (d) (The dotted area passed the significance test of α=0.05, the red lines indicate the climatic state greater than or equal to 5 880 gpm)
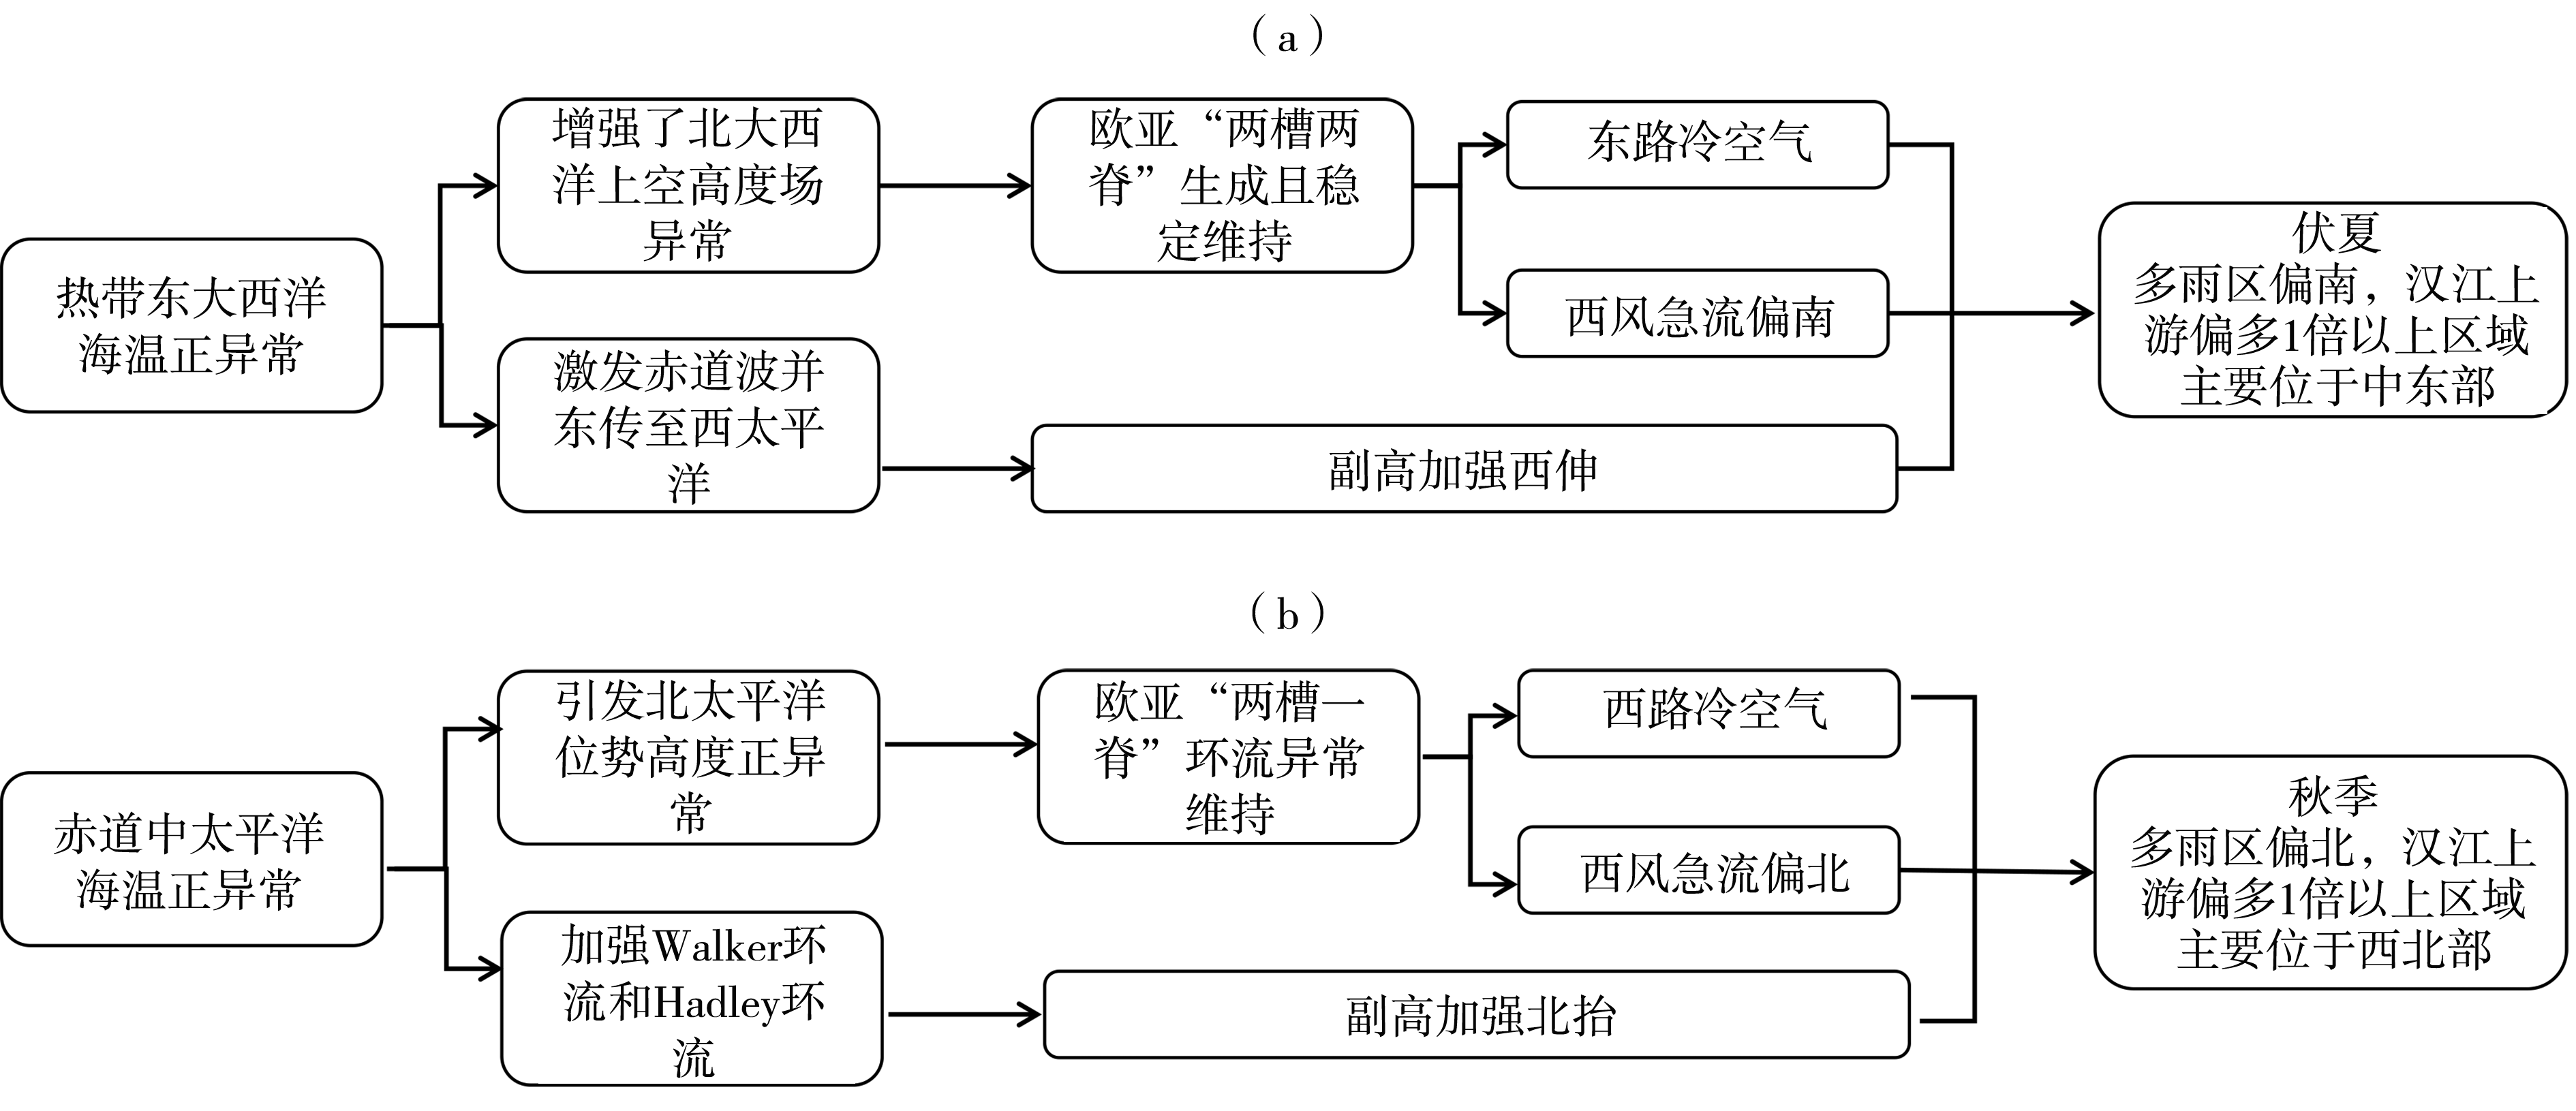
Fig.15 Schematic diagram of atmosphere-ocean system conditions for the formation of summer (a) and autumn (b) flood of the Hanjiang River in 2021
Fig.15 Schematic diagram of atmosphere-ocean system conditions for the formation of summer (a) and autumn (b) flood of the Hanjiang River in 2021
| [1] | 白虎志, 董文杰, 2004. 华西秋雨的气候特征及成因分析[J]. 高原气象, 23(6):884-889. |
| [2] |
白景锋, 2014. 基于县域的生态脆弱区人均粮食时空格局变动及驱动力分析——以南水北调中线水源区为例[J]. 地理科学, 34(2): 178-184.
DOI |
| [3] | 曾红玲, 高新全, 戴新刚, 2002. 近20年全球冬、夏季海平面气压场和500 hPa高度场年代际变化特征分析[J]. 高原气象, 21(1): 66-73. |
| [4] | 陈剀, 钟霖浩, 华丽娟, 等, 2020. 华西秋雨趋势变化的年代际转折及其成因分析[J]. 气候与环境研究, 25(1):90-102. |
| [5] | 陈晓光, 徐祥德, 朱乾根, 1996. 河套华北地区旱涝的前期环流异常与大西洋海温的关系及其数值模拟[J]. 气象学报, 54(1):102-107. |
| [6] | 谌芸, 施能, 2003. 我国秋季降水、温度的时空分布特征及气候变化[J]. 南京气象学院学报, 26(5):622-630. |
| [7] |
程肖侠, 方建刚, 雷向杰, 2014. 陕西盛夏极端降水频次及其与全球海温的遥相关研究[J]. 干旱气象, 32(1):38-45.
DOI |
| [8] | 封国林, 杨涵洧, 张世轩, 等, 2012. 2011年春末夏初长江中下游地区旱涝急转成因初探[J]. 大气科学, 36(5):1009-1 026. |
| [9] | 郭广芬, 杜良敏, 肖莺, 等, 2021. 长江流域夏季极端降水时空分布特征[J]. 干旱气象, 39(2): 235-243. |
| [10] | 国家气候中心, 四川省气候中心, 国家气象中心, 等, 2019. 中国雨季监测指标华西秋雨QX/T 496-2019[S]. 北京: 全国气候与气候变化标准化技术委员会. |
| [11] | 韩晋平, 张人禾, 苏京志, 2013. 中国北方秋雨与热带中太平洋海表冷却的关系[J]. 大气科学, 37(5):1 059-1 071. |
| [12] | 郝立生, 何丽烨, 马宁, 等, 2023. 厄尔尼诺事件年际变化与我国华北夏季干旱的关系[J]. 干旱气象, 41(6):829-840. |
| [13] | 简茂球, 乔云亭, 罗会邦, 等, 2007. 初夏东亚-太平洋大气热源与长江流域及邻近地区7、8月降水异常的关系[J]. 大气科学, 31(4):735-746. |
| [14] | 焦敏, 李辑, 陈鹏狮, 等, 2019. 2018年夏季辽宁异常高温干旱的环流特征及成因[J]. 大气科学学报, 42(4):571-580. |
| [15] | 柯怡明, 孙学军, 孙元, 等, 2022. 2021年汉江秋汛异常水雨情特征及风险管理机制探讨[J]. 暴雨灾害, 41(5):501-505. |
| [16] | 况雪源, 张耀存, 2006a. 东亚副热带西风急流位置异常对长江中下游夏季降水的影响[J]. 高原气象, 25(3):382-389. |
| [17] | 况雪源, 张耀存, 2006b. 东亚副热带西风急流季节变化特征及其热力影响机制探讨[J]. 气象学报, 64(5):564-575. |
| [18] | 李崇银, 王作台, 林士哲, 等, 2004. 东亚夏季风活动与东亚高空西风急流位置北跳关系的研究[J]. 大气科学, 28(5):641-658. |
| [19] | 李俊, 袁媛, 王遵娅, 等, 2020. 2019年长江中下游伏秋连旱演变特征[J]. 气象, 46(12):1 641-1 650. |
| [20] | 李忠贤, 陈晨, 曾刚, 等, 2019. 春季热带大西洋北部海温异常与我国盛夏降水异常的联系[J]. 热带气象学报, 35(6):756-766. |
| [21] |
刘佳, 马振峰, 杨淑群, 等, 2015. 印度洋偶极子和华西秋雨的关系[J]. 高原气象, 34(4):950-962.
DOI |
| [22] | 覃皓, 伍丽泉, 何慧, 2023. 夏季热带大西洋海温变化对华南前汛期降水的影响[J]. 大气科学, 47(5):1309-1 324. |
| [23] | 任福民, 袁媛, 孙丞虎, 等, 2012. 近30年ENSO研究进展回顾[J]. 气象科技进展, 2(3):17-24. |
| [24] | 施春华, 金鑫, 刘仁强, 2017. 大气动力学中三种Rossby波作用通量的特征差异和适用性比较[J]. 大气科学学报, 40(6): 850-855. |
| [25] | 汪成博, 李双双, 延军平, 等, 2019. 1970—2015年汉江流域多尺度极端降水时空变化特征[J]. 自然资源学报, 34(6):1209-1 222. |
| [26] | 王志毅, 高庆九, 胡邦辉, 等, 2017. 近50 a江淮地区梅雨期水汽输送特征研究[J]. 大气科学学报, 40(1):48-60. |
| [27] |
肖科丽, 方建刚, 王娜, 等, 2016. 陕西8月降水时空分布特征及成因[J]. 干旱气象, 34(1):58-63.
DOI |
| [28] | 肖科丽, 王娜, 魏娜, 等, 2014. 2010年陕西盛夏极端多雨的气候特征及成因研究[J]. 气候与环境研究, 19(3):311-320. |
| [29] | 肖莺, 任永建, 杜良敏, 2016. 2015/2016年海洋和大气环流异常对中国夏季降水的影响[J]. 自然资源学报, 31(12):1995-2 004. |
| [30] | 刑雯慧, 王坚红, 张方伟, 等, 2019. 秋汛期影响汉江流域降水的水汽通道特征研究[J]. 人民长江, 50(2):101-106. |
| [31] | 徐曼琳, 周波涛, 程志刚, 2020. 2010年以来华西秋季降水年代际增多原因初探[J]. 大气科学学报, 43(3):568-576. |
| [32] | 薛峰, 段欣妤, 苏同华, 2018. 强El Niño衰减年东亚夏季风的季节内变化:1998年和2016年的对比分析[J]. 大气科学, 42(6):1407-1 420. |
| [33] | 张丰启, 何金海, 1997. 热带太平洋SSTA多时间尺度特征与ENSO循环[J]. 南京气象学院学报, 20(1): 26-34. |
| [34] | 张庆云, 宣守丽, 孙淑清, 2018. 夏季东亚高空副热带西风急流季节内异常的环流特征及前兆信号[J]. 大气科学, 42(4):935-950. |
| [35] |
张雯, 马阳, 王素艳, 等, 2023. 西北地区东部春夏季旱涝转换环流特征及其与大西洋海温的关系[J]. 干旱气象, 41(1):14-24.
DOI |
| [36] | 郑佳喻, 王春在, 2021. 三大洋对2020年6月长江流域破纪录强降水的影响[J]. 中国科学:地球科学, 51(10):1611-1 623. |
| [37] | GU W, WANG L, LI W J, et al, 2015. Influence of the tropical Pacific east-west thermal contrast on the autumn precipitation in South China[J]. International Journal of Climatology, 35(7): 1 543-1 555. |
| [38] |
LIN P F, YU Z P, LÜ J H, et al, 2019. Two regimes of Atlantic multidecadal oscillation: cross-basin dependent or Atlantic-intrinsic[J]. Science Bulletin, 64(3): 198-204.
DOI PMID |
| [39] | QIU D N, XU H M, DENG J C, et al, 2021. Different impacts of spring tropical Atlantic SST anomalies on Eurasia spring climate during the periods of 1970-1995 and 1996-2018[J]. Atmospheric Research, 253, 105494. DOI: 10.1016/J.ATMOSRES.2021.105494. |
| [40] | WANG Z Y, ZHOU B T, 2019. Observed decadal transition in trend of autumn rainfall over central China in the late 1990s[J]. Journal of Climate, 32(5): 1 395-1 409. |
| [41] | ZHU Y L, 2011. A seasonal prediction model for the summer rainfall in Northeast China using the year-to-year increment approach[J]. Atmospheric and Oceanic Science Letters, 4(3):146-150. |
| [1] | WANG Jiayuan1,HU Xueping1,2,XU Pingping1,3,WANG Shigong1,SHANG Kezheng1. Comparative Analysis of Climatic Cause About Two Continuous Severe Drought Events in Southwest China [J]. Journal of Arid Meteorology, 2015, 33(2): 202-212. |
| Viewed | ||||||
|
Full text |
|
|||||
|
Abstract |
|
|||||