Journal of Arid Meteorology ›› 2023, Vol. 41 ›› Issue (2): 251-259.DOI: 10.11755/j.issn.1006-7639(2023)-02-0251
• Articles • Previous Articles Next Articles
Characteristics of water vapor and liquid water in arid and semi-arid region in the central Inner Mongolia
SU Lijuan1,2,3( ), YI Nana1,2,3, ZHENG Xucheng1,2,3, SHI Jinli1,2,3, DENG Xiaodong4
- 1. Meteorological Science Institute of Inner Mongolia, Hohhot 010000, China
2. Key Open Laboratory for Cloud Physics of China Meteorological Administration, Beijing 100081, China
3. Key Laboratory for Weather Modification of Inner Mongolia, Hohhot 010000, China
4. Ecological and Agricultural Meteorological Center of Inner Mongolia, Hohhot 010000, China
-
Received:2021-12-20Revised:2022-05-05Online:2023-04-30Published:2023-05-09
内蒙古中部干旱半干旱区水汽和液态水特征研究
苏立娟1,2,3(), 衣娜娜1,2,3, 郑旭程1,2,3, 史金丽1,2,3, 邓晓东4
- 1.内蒙古自治区气象科学研究所,内蒙古 呼和浩特 010000
2.中国气象局云雾物理环境重点开放实验室,北京 100081
3.内蒙古自治区人工影响天气重点实验室,内蒙古 呼和浩特 010000
4.内蒙古自治区生态与农业气象中心,内蒙古 呼和浩特 010000
-
作者简介:苏立娟(1976—),女,内蒙古人,正高级工程师,主要从事云降水物理以及人工影响天气作业识别研究。E-mail:yinndongzhl@163.com。 -
基金资助:国家重点研发计划课题(2018YFC1507900);西北区域人工影响天气能力建设项目“巴彦淖尔人工防雹技术研究试验”(ZQC-R18217/RYSY201906);国家自然科学基金项目(42030604);内蒙古自治区科技创新项目(nmqxkjcx202203);及内蒙古自治区自然科学基金项目(2020MS04015)
CLC Number:
Cite this article
SU Lijuan, YI Nana, ZHENG Xucheng, SHI Jinli, DENG Xiaodong. Characteristics of water vapor and liquid water in arid and semi-arid region in the central Inner Mongolia[J]. Journal of Arid Meteorology, 2023, 41(2): 251-259.
苏立娟, 衣娜娜, 郑旭程, 史金丽, 邓晓东. 内蒙古中部干旱半干旱区水汽和液态水特征研究[J]. 干旱气象, 2023, 41(2): 251-259.
share this article
Add to citation manager EndNote|Ris|BibTeX
URL: http://www.ghqx.org.cn/EN/10.11755/j.issn.1006-7639(2023)-02-0251
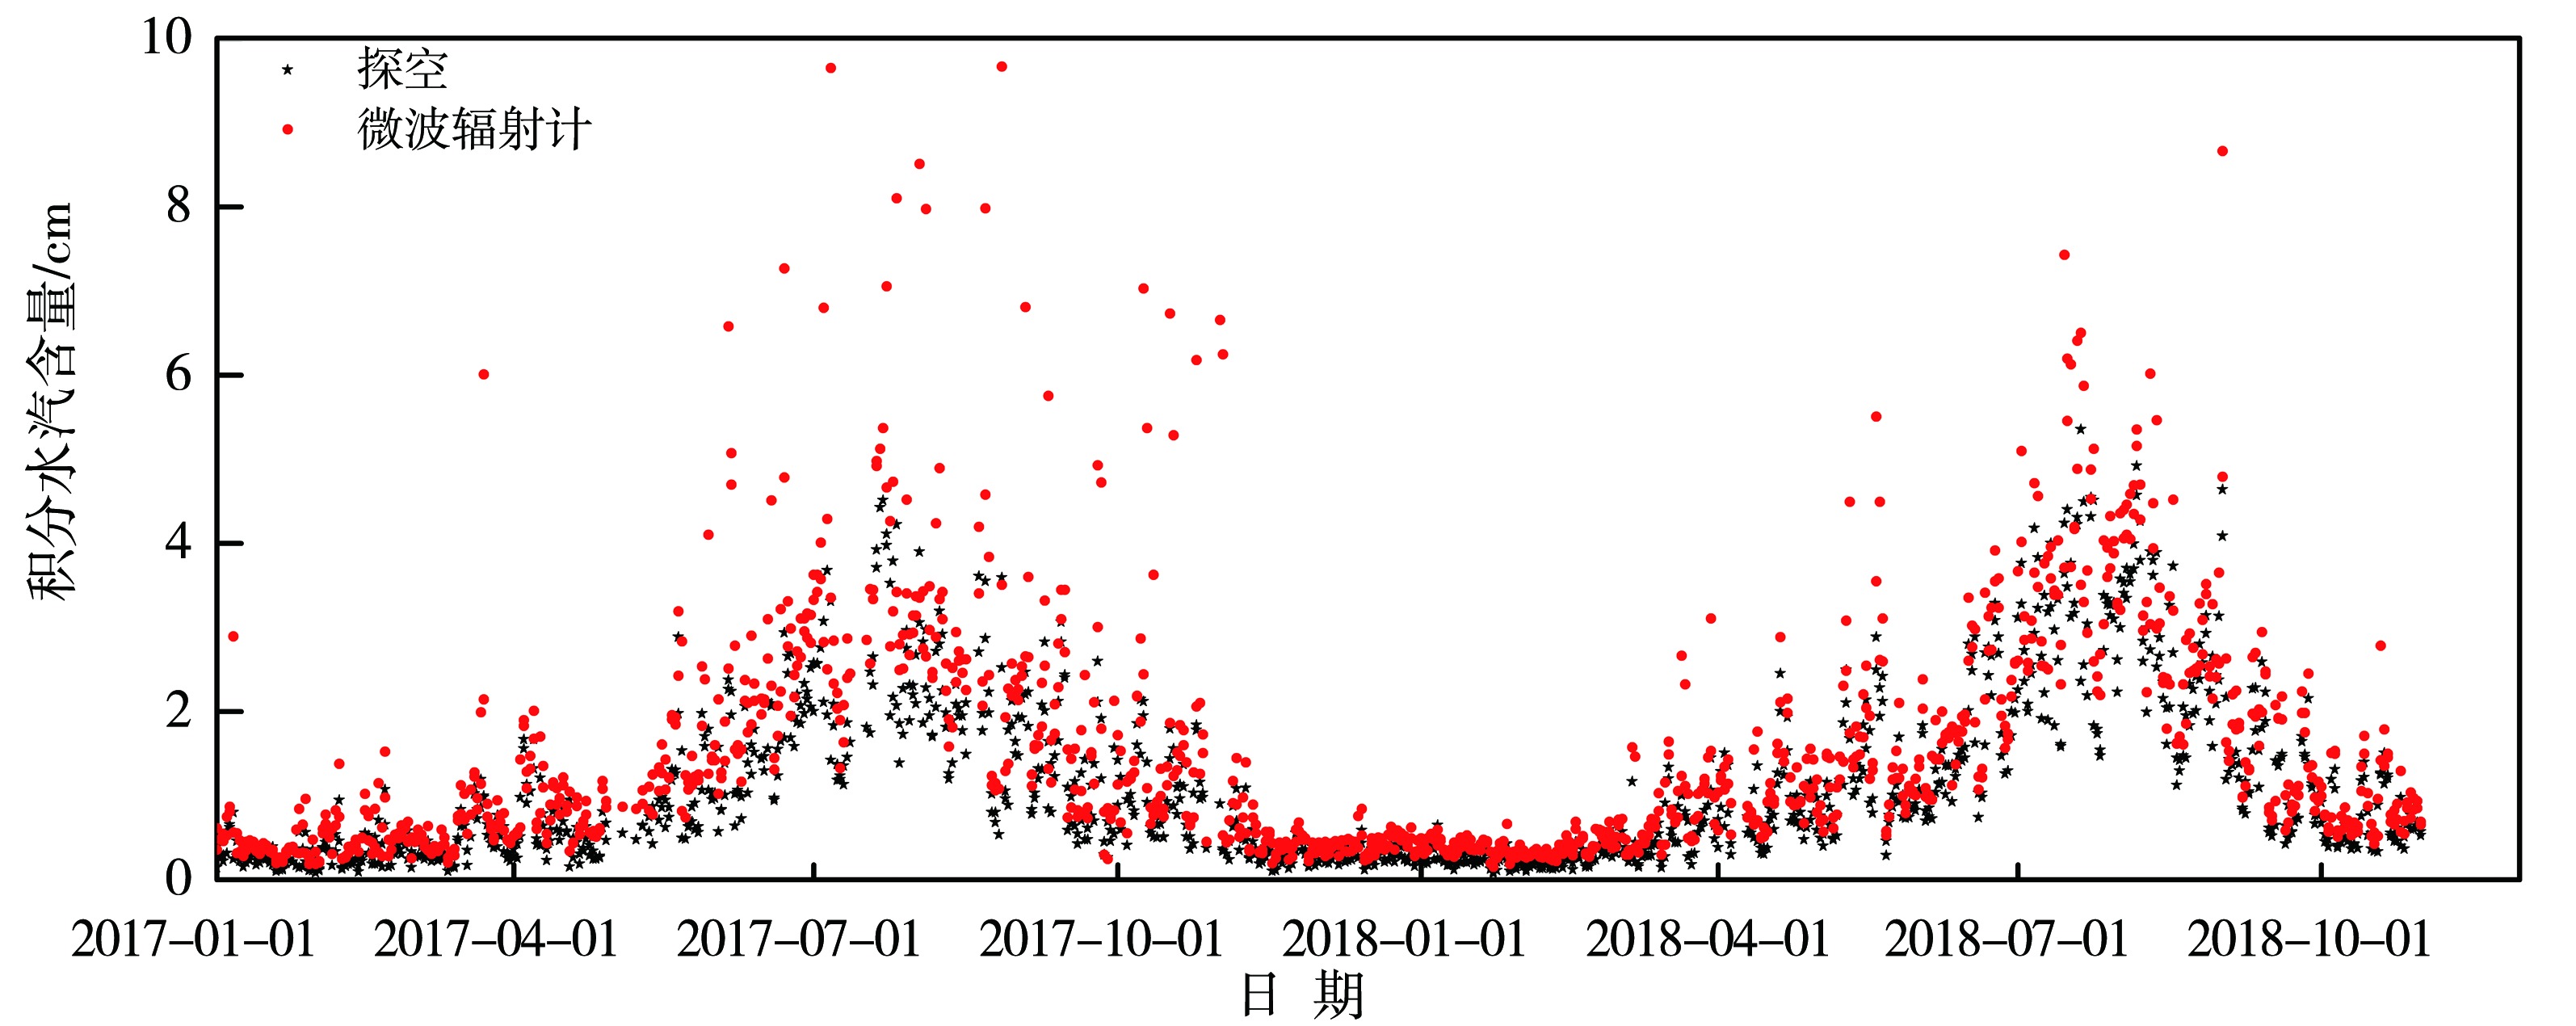
Fig.1 The integrated water vapor content retrieved by the sounding data and microwave radiometer data at Hohhot station from January 2017 to October 2018
Fig.1 The integrated water vapor content retrieved by the sounding data and microwave radiometer data at Hohhot station from January 2017 to October 2018
Tab.1 Classification of precipitation properties about 35 rainfall days from April to September in 2017 and 2018 in the middle region of Inner Mongolia
| 稳定性降水日 | 对流性降水日 | |
|---|---|---|
| 2017-06-05 | 2017-06-21 | 2018-07-06 |
| 2017-06-06 | 2017-06-22 | 2018-07-07 |
| 2017-09-10 | 2017-06-28 | 2018-07-20 |
| 2018-04-04 | 2017-07-22 | 2018-07-21 |
| 2018-04-13 | 2017-07-26 | 2018-08-06 |
| 2018-04-20 | 2017-08-22 | 2018-08-10 |
| 2018-06-23 | 2017-09-09 | 2018-08-11 |
| 2018-08-17 | 2017-09-25 | 2018-08-12 |
| 2018-09-27 | 2018-05-10 | 2018-08-28 |
| 2018-06-24 | 2018-06-16 | 2018-08-30 |
| 2018-09-10 | 2018-06-25 | 2018-09-01 |
| 2018-07-02 | 2018-08-07 | |
Tab.2 The monthly change of sample number proportion of integrated water vapor content with different intervals and the maximum, minimum and mean value of integrated water vapor from April to September in 2017 and 2018 in the middle region of Inner Mongolia
| 月份 | 样本数 | 不同区间积分水汽含量样本数占比/% | 积分水汽含量/cm | ||||||
|---|---|---|---|---|---|---|---|---|---|
| 0≤w≤ 2 cm | 2<w≤ 3 cm | 3<w≤ 4 cm | 4<w≤ 5 cm | w>5 cm | 均值 | 最大值 | 最小值 | ||
| 4 | 301 | 38.87 | 3.99 | 9.30 | 23.92 | 23.92 | 3.45 | 6.91 | 1.43 |
| 5 | 17 | 0.00 | 100.00 | 0.00 | 0.00 | 0.00 | 2.59 | 2.73 | 2.50 |
| 6 | 473 | 0.21 | 10.15 | 13.11 | 13.74 | 62.79 | 5.51 | 9.06 | 1.91 |
| 7 | 616 | 0.00 | 0.00 | 8.60 | 69.97 | 21.43 | 4.85 | 14.54 | 3.49 |
| 8 | 628 | 0.16 | 0.32 | 2.07 | 39.49 | 57.96 | 5.86 | 12.00 | 1.38 |
| 9 | 747 | 1.34 | 5.22 | 4.82 | 17.14 | 71.49 | 6.14 | 13.69 | 0.82 |
Tab.3 The cumulative sample number proportion of integrated water vapor content with different intervals on rainfall days from April to September in 2017 and 2018 in the middle region of Inner Mongolia
| 月份 | 积分水汽含量/cm | |||||||
|---|---|---|---|---|---|---|---|---|
| w≥1.5 | w≥2.0 | w≥2.5 | w≥3.0 | w≥3.5 | w≥4.0 | w≥4.5 | w≥5.0 | |
| 4 | 82.30* | 61.13 | 58.14 | 57.14 | 55.48 | 47.84 | 36.21 | 23.92 |
| 5 | 100.00 | 100.00 | 94.12* | 0.00 | 0.00 | 0.00 | 0.00 | 0.00 |
| 6 | 100.00 | 99.79 | 99.58 | 89.85 | 80.34* | 76.74 | 66.60 | 63.00 |
| 7 | 100.00 | 100.00 | 100.00 | 100.00 | 99.84 | 91.88* | 55.65 | 23.32 |
| 8 | 99.84 | 99.84 | 99.68 | 99.52 | 98.89 | 97.45* | 75.64 | 58.12 |
| 9 | 99.33 | 98.66 | 98.13 | 93.44 | 91.43 | 88.62 | 81.79* | 71.62 |
Tab.4 The monthly change of sample number proportion of integrated liquid water content with different intervals and the maximum, minimum and mean values of integrated liquid water content from April to September in 2017 and 2018 in the middle region of Inner Mongolia
| 月份 | 样本数 | 不同区间积分液态水含量样本数占比/% | 积分液态水含量/mm | ||||||
|---|---|---|---|---|---|---|---|---|---|
| 0≤L≤2 mm | 2<L≤3 mm | 3<L≤4 mm | 4<L≤5 mm | L>5 mm | 均值 | 最大值 | 最小值 | ||
| 4 | 301 | 11.30 | 31.23 | 14.29 | 4.65 | 38.54 | 4.09 | 6.60 | 0.11 |
| 5 | 17 | 100.00 | 0.00 | 0.00 | 0.00 | 0.00 | 0.23 | 0.49 | 0.01 |
| 6 | 473 | 22.41 | 12.47 | 29.60 | 20.51 | 15.01 | 3.35 | 9.19 | 0.03 |
| 7 | 616 | 8.12 | 8.60 | 6.82 | 16.56 | 59.90 | 4.89 | 14.65 | 0.44 |
| 8 | 628 | 28.66 | 10.99 | 12.26 | 7.48 | 40.61 | 3.86 | 15.20 | 0.08 |
| 9 | 748 | 22.36 | 20.88 | 16.73 | 14.06 | 25.97 | 3.86 | 22.77 | 0.09 |
Tab.5 The cumulative sample number proportion of integral liquid water content with different intervals on precipitation days from April to September in 2017 and 2018 in the middle region of Inner Mongolia
| 月份 | 积分液态水含量/mm | |||||||
|---|---|---|---|---|---|---|---|---|
| ≥1.50 | ≥2.00 | ≥2.50 | ≥3.00 | ≥3.50 | ≥4.00 | ≥4.50 | ≥5.00 | |
| 4 | 94.35 | 88.70* | 71.43 | 57.48 | 49.83 | 43.19 | 40.20 | 38.54 |
| 5 | 0.00 | 0.00 | 0.00 | 0.00 | 0.00 | 0.00 | 0.00 | 0.00 |
| 6 | 81.40* | 77.59 | 70.61 | 65.12 | 50.95 | 35.52 | 22.83 | 15.01 |
| 7 | 94.64 | 91.88 | 86.69 | 83.28 | 80.19* | 76.46 | 84.58 | 59.90 |
| 8 | 81.05* | 71.34 | 64.65 | 60.35 | 55.41 | 48.09 | 43.79 | 40.61 |
| 9 | 85.01* | 77.64 | 67.34 | 56.76 | 46.45 | 40.03 | 32.26 | 25.97 |
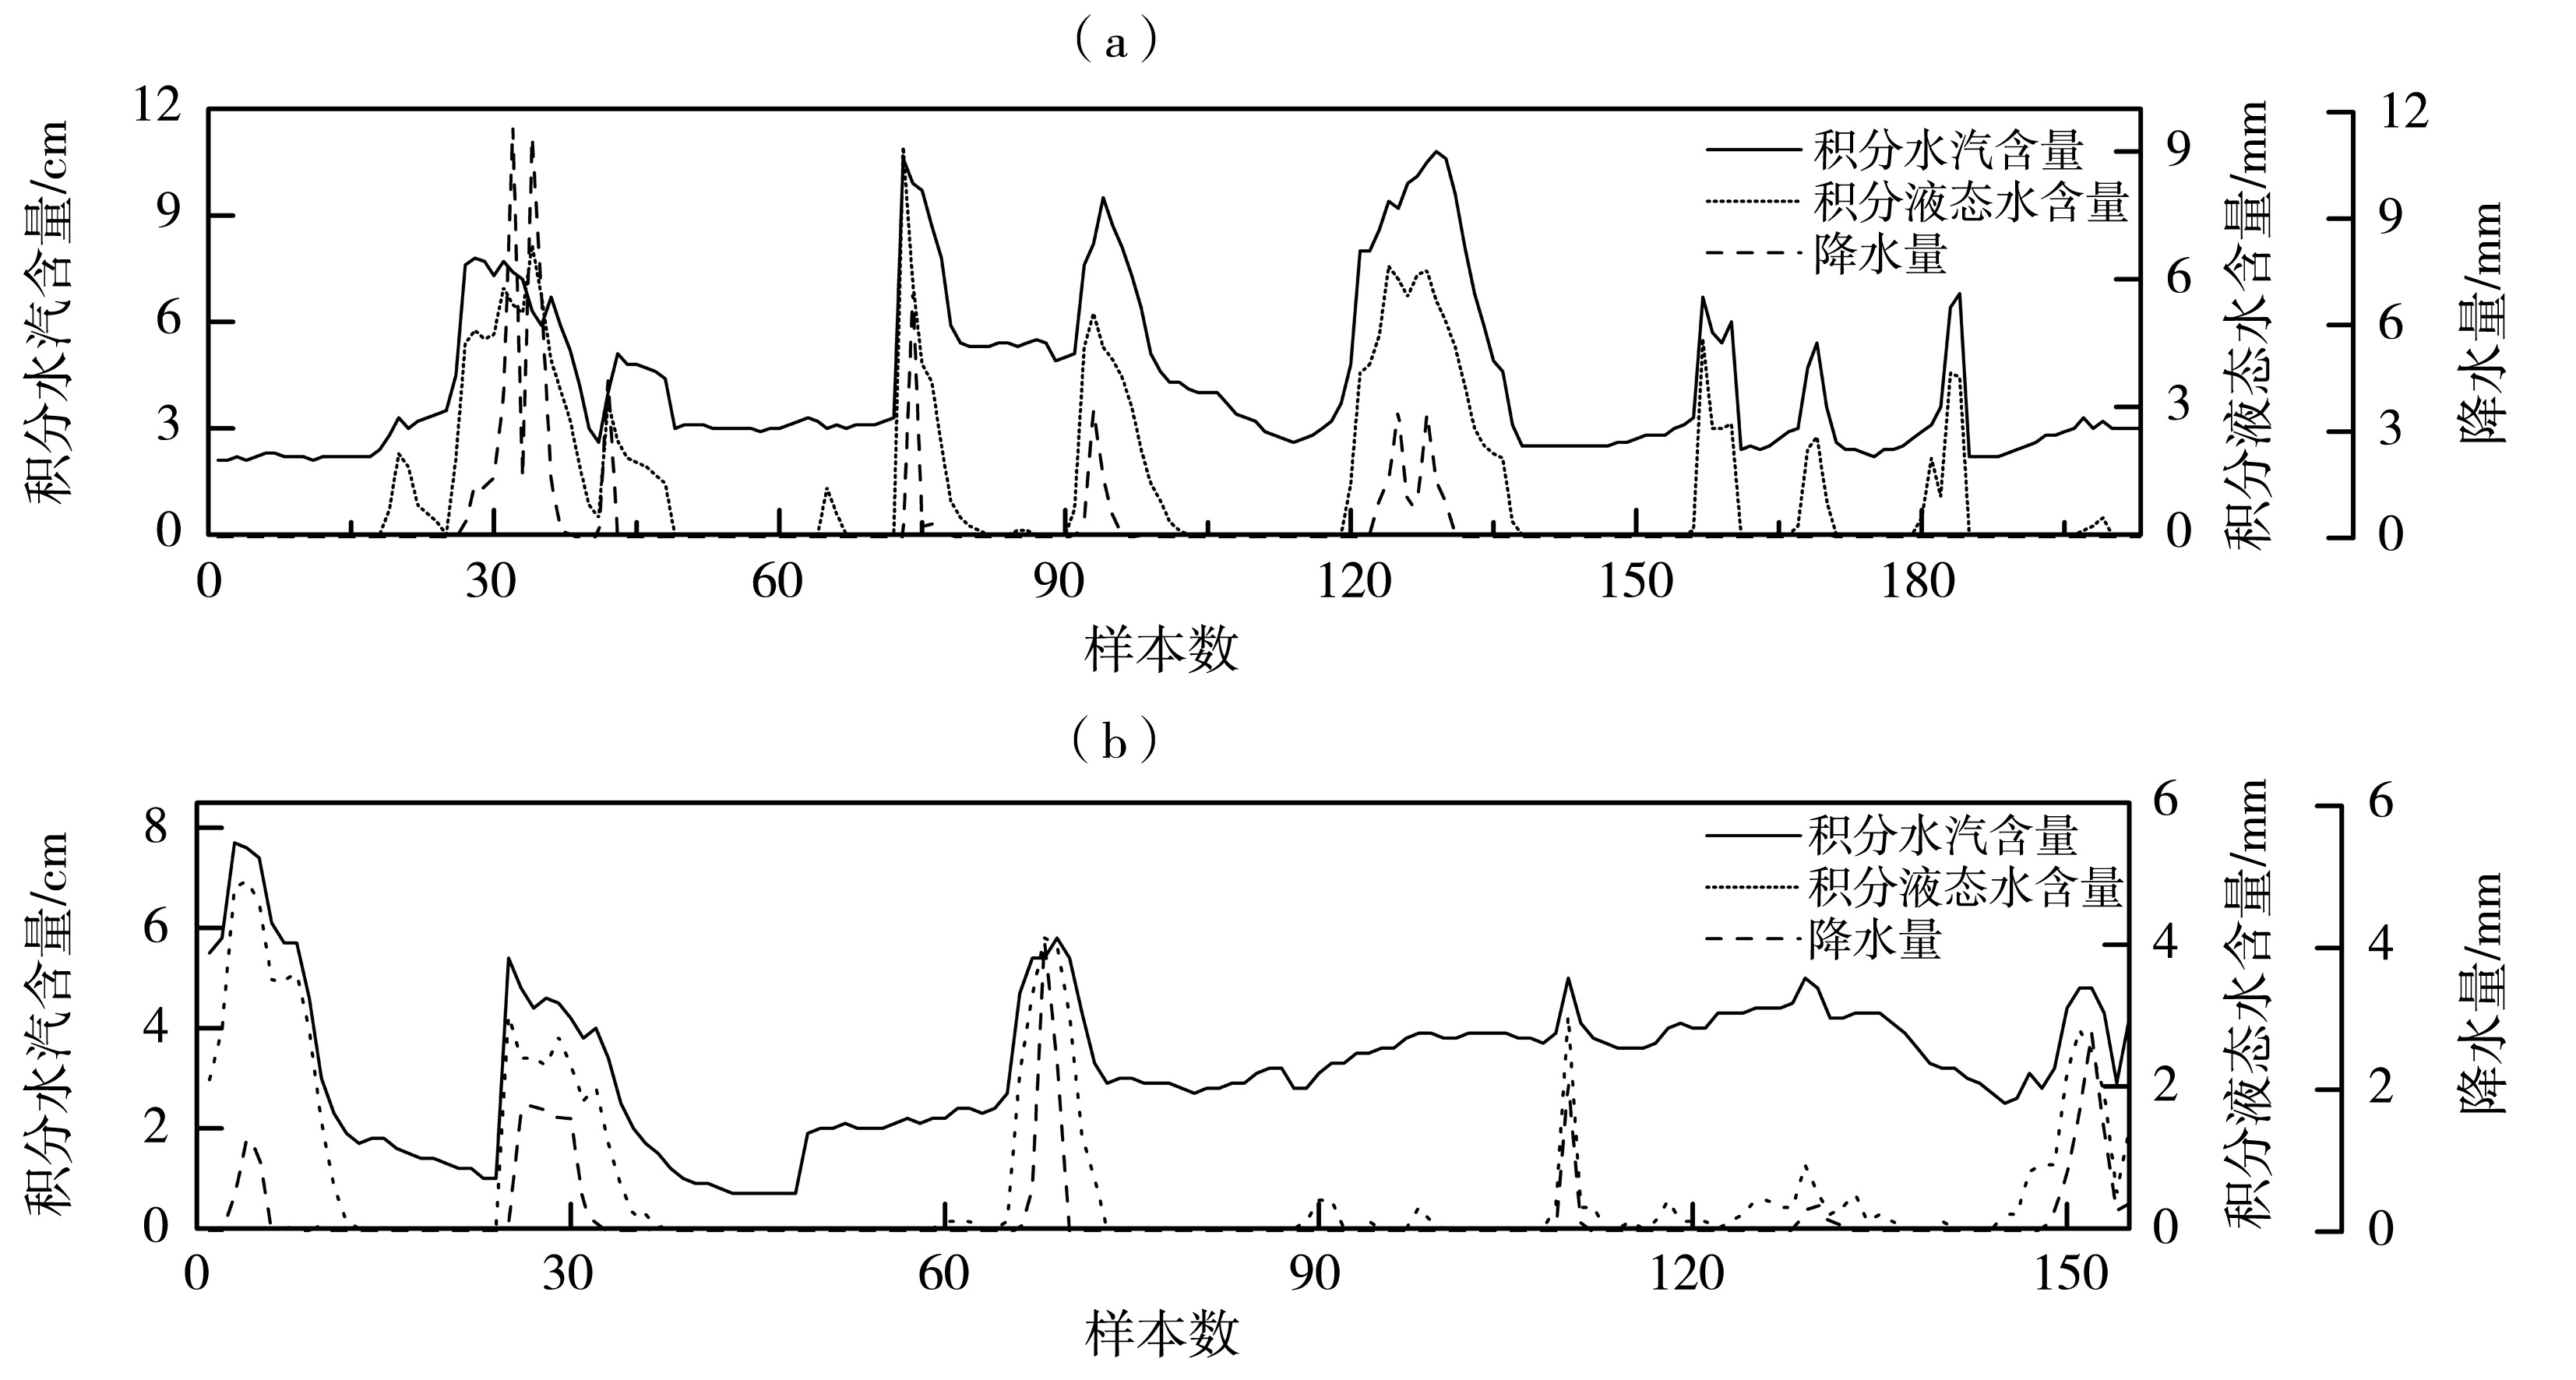
Fig.2 The integrated water vapor, the integrated liquid water content and one-hour precipitation under convective (a) and steady (b) precipitation processes from April to September in 2017 and 2018 in the middle region of Inner Mongolia
Fig.2 The integrated water vapor, the integrated liquid water content and one-hour precipitation under convective (a) and steady (b) precipitation processes from April to September in 2017 and 2018 in the middle region of Inner Mongolia
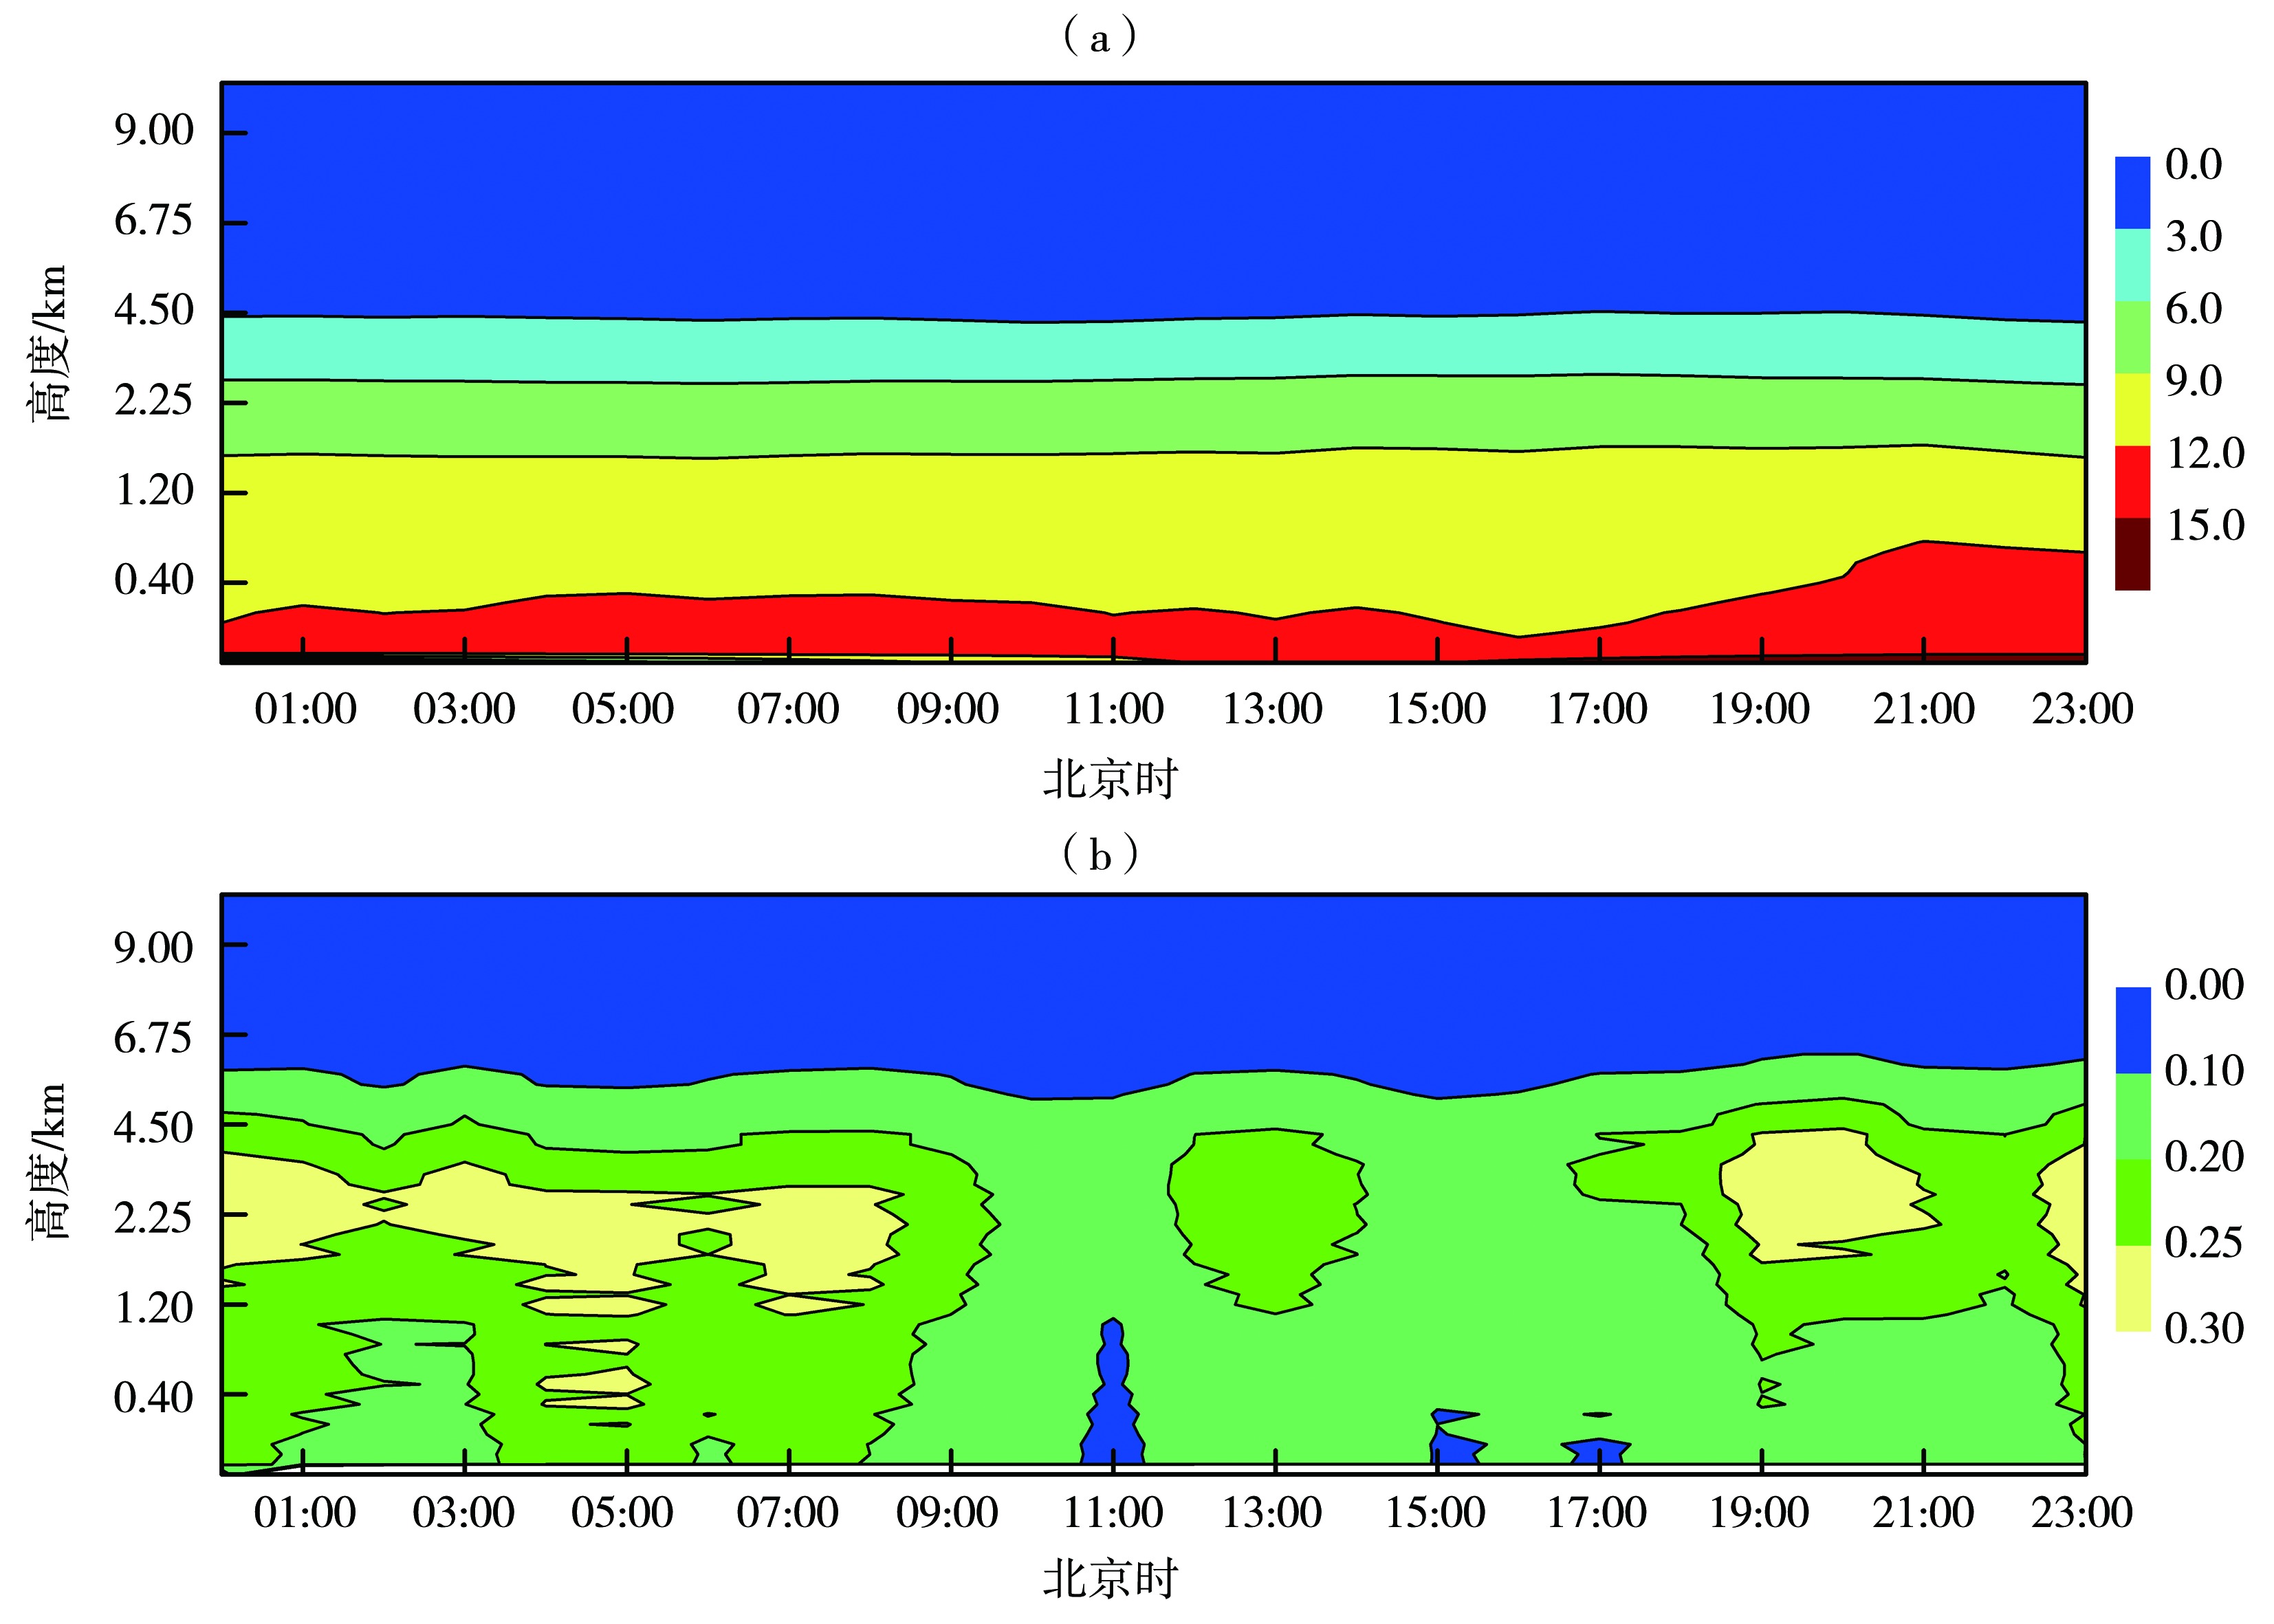
Fig.3 The diurnal variation of vertical distribution of water vapor (a, Unit: cm) and liquid water content (b, Unit: mm) during convective precipitation processes from April to September in 2017 and 2018 in the middle region of Inner Mongolia
Fig.3 The diurnal variation of vertical distribution of water vapor (a, Unit: cm) and liquid water content (b, Unit: mm) during convective precipitation processes from April to September in 2017 and 2018 in the middle region of Inner Mongolia

Fig.4 The diurnal variation of vertical distribution of water vapor (a, Unit: cm) and liquid water content (b, Unit: mm) during steady precipitation processes from April to September in 2017 and 2018 in the middle region of Inner Mongolia
Fig.4 The diurnal variation of vertical distribution of water vapor (a, Unit: cm) and liquid water content (b, Unit: mm) during steady precipitation processes from April to September in 2017 and 2018 in the middle region of Inner Mongolia

Fig.5 Cases of integrated liquid water and integrated water vapor content changes in phase (a) and anti-phase (b) in the middle region of Inner Mongolia
Fig.5 Cases of integrated liquid water and integrated water vapor content changes in phase (a) and anti-phase (b) in the middle region of Inner Mongolia
| [1] | 敖雪, 王振会, 徐桂荣, 等, 2011. 地基微波辐射计资料在降水分析中的应用[J]. 暴雨灾害, 30(4): 358-365. |
| [2] | 白婷, 丁建芳, 刘艳华, 等, 2021. 微波辐射计在监测水汽特征及降水分析中的应用[J]. 气象与环境科学, 44(6): 102-107. |
| [3] | 陈银, 2021. 地基微波辐射计质量控制和反演算法研究[D]. 南京: 南京信息工程大学, 9-10. |
| [4] | 程鹏, 樊旭, 胡晓辉, 等, 2021. 基于微波辐射计的张掖地区水汽、液态水变化特征分析[J]. 成都信息工程大学学报, 36(2): 230-237. |
| [5] | 陈添宇, 陈乾, 丁瑞津, 2007. 地基微波辐射仪监测的张掖大气水汽含量与雨强的关系[J]. 干旱区地理, 2007, 30(4):501-506. |
| [6] | 方莎莎, 陆鹏程, 廖可文, 等, 2020. 基于微波辐射计资料对武汉市冬季典型大雾个例的探测分析[J]. 气象与环境科学, 43(4): 81-87. |
| [7] | 巩宁刚, 孙美平, 闫露霞, 等, 2017. 1979—2016年祁连山地区大气水汽含量时空特征及其与降水的关系[J]. 干旱区地理, 40(4): 762-771. |
| [8] | 郭学良, 付丹红, 胡朝霞, 2013. 云降水物理与人工影响天气研究进展(2008—2012)[J]. 大气科学, 37(2): 351-363. |
| [9] | 郝巨飞, 袁雷武, 李芷霞, 等, 2018. 激光雷达和微波辐射计对邢台市一次沙尘天气的探测分析[J]. 高原气象, 37(4): 1 110-1 119. |
| [10] | 韩经纬, 王海梅, 乌兰, 等, 2009. 内蒙古雷暴、冰雹灾害的评估分析与防御对策研究[J]. 干旱区资源与环境, 23(7): 31-38. |
| [11] | 侯叶叶, 2016. 地基微波辐射计的精度分析和资料同化试验[D]. 南京: 南京信息工程大学, 1-2. |
| [12] | 李成伟, 李伟, 夏江峰, 等, 2021. 不同天气条件下微波辐射计温度探测效果评估[J]. 陕西气象, (6): 43-46. |
| [13] | 李军霞, 李培仁, 晋立军, 等, 2017. 地基微波辐射计在遥测大气水汽特征及降水分析中的应用[J]. 干旱气象, 35(5): 767-775. |
| [14] | 李静, 何清, 姚俊强, 等, 2014. 内蒙古西部地区气候变化特征及影响因子分析[J]. 干旱区资源与环境, 28(5): 186-191. |
| [15] | 李剑婕, 郑佳锋, 吴凌华, 等, 2021. 一次山地冬季“霰-雪-云-雾”天气的云降水垂直结构和演变特征研究[J]. 西南大学学报(自然科学版), 43(7): 165-175. |
| [16] | 刘红燕, 2011. 三年地基微波辐射计观测温度廓线的精度分析[J]. 气象学报, 69(4): 719-728. |
| [17] | 刘建忠, 张蔷, 2010. 微波辐射计反演产品评价[J]. 气象科技, 38(3): 325-331. |
| [18] | 林彤, 桑建人, 姚展予, 等, 2021. 基于微波辐射计的宁夏六盘山西侧大气水汽变化特征[J]. 干旱区地理, 44(4):923-933. |
| [19] | 卢士庆, 闫宾, 刘晓东, 2009. 几种求算大气可降水量方法比较[J]. 内蒙古气象, (1): 15-18. |
| [20] | 史金丽, 2017. 基于微波辐射计测量呼和浩特地区水汽特征的初步分析[J]. 内蒙古气象, (4):17-23. |
| [21] | 苏立娟, 郑旭程, 达布希拉图, 等, 2020. 基于雨滴谱仪建立不同性质降水 Z-I关系并与雷达作对比分析[J]. 干旱区资源与环境, 34(6): 103-108. |
| [22] | 唐仁茂, 李德俊, 向玉春, 等, 2012. 地基微波辐射计对咸宁一次冰雹天气过程的监测分析[J]. 气象学报, 70(4): 806-813. |
| [23] | 王叶红, 赖安伟, 赵玉春, 2010. 地基微波辐射计资料同化对一次特大暴雨过程影响的数值试验研究[J]. 暴雨灾害, 29(3): 201-207. |
| [24] | 冼星河, 张玮, 陈楚梦, 2021. 新型观测数据在东莞一次大暴雨过程中的综合应用[J]. 气象研究与应用, 42(2): 63-67. |
| [25] | 许皓琳, 郑佳锋, 姜涛, 等, 2020. 乌鲁木齐和成都两地机场雷暴降水水汽条件的分析研究[J]. 气象, 46(11): 1 440-1 449. |
| [26] | 许焕斌, 2009. 关于在人工影响天气中更新学术观念的探讨[J]. 干旱气象, 27(4): 305-307. |
| [27] |
杨莲梅, 李霞, 赵玲, 等, 2013. MP-3000A型地基微波辐射计探测性能及其在乌鲁木齐降水天气中的初步应用[J]. 干旱气象, 31(3): 570-578.
DOI |
| [28] | 衣娜娜, 苏立娟, 郑旭程, 等, 2021. 内蒙古西部地区降水云宏观特征[J]. 干旱气象, 39(3): 406-414. |
| [29] | 张成福, 王雨晴, 闫冬, 等, 2020. 内蒙古荒漠草原区气候变化及干旱趋势分析[J]. 灌溉排水学报, 39(增刊2): 20-25. |
| [30] | 张秋晨, 龚佃利, 王俊, 等, 2017. 基于地基微波辐射计反演的济南地区水汽及云液态水特征[J]. 气象与环境学报, 33(5): 35-43. |
| [31] | 张文刚, 徐桂荣, 万蓉, 等, 2015. 基于地基微波辐射计的大气液态水及水汽特征分析[J]. 暴雨灾害, 34(4): 367-374. |
| [32] | 郑飒飒, 2020. 基于地基微波辐射计反演四川盆地水汽及云液态水的初步分析[J]. 高原山地气象研究, 40(2): 83-88. |
| [33] | 朱雯娜, 王清平, 王春红, 等, 2018. 微波辐射计在乌鲁木齐机场浓雾监测中的应用[J]. 沙漠与绿洲气象, 12(5): 23-31. |
| [34] |
COSSU F, HOCKER K, MARTYNOV A, et al, 2015. Atmospheric water parameters measured by a ground-based microwave radiometer and compared with the WRF mode[J]. Atmospheric Science Letters, 16(4): 465-472.
DOI URL |
| [35] | NAVAS-GUZMáN F, KäMPFER N, SCHRANZ F, et al, 2017. Intercomparison of stratospheric temperature profiles from a ground-based microwave radiometer with other techniques[J]. Atmospheric Chemistry & Physics, 17(22): 1-28. |
| [36] |
STEINKE S, LOHNERT U, CREWELL S, et al, 2014. Water vapor tomography with two microwave radiometers[J]. IEEE Geoscience and Remote Sensing Letters, 11(2): 419-423.
DOI URL |
| Viewed | ||||||
|
Full text |
|
|||||
|
Abstract |
|
|||||