Journal of Arid Meteorology ›› 2022, Vol. 40 ›› Issue (1): 95-107.DOI: 10.11755/j.issn.1006-7639(2022)-01-0095
• Articles • Previous Articles Next Articles
Deviation analysis of reanalysis data in boundary layer in summer over Tibetan Plateau and its simulation correction
MA Minjin1,2( ), CHEN Yue2, KANG Guoqiang2, ZHAO Zhenzhu2, HUANG Wanlong2, TAN Changrong2, DING Fan3
- 1. Key Laboratory of Arid Climate Change and Reducing Disaster of Gansu Province, Lanzhou 730020, China
2. College of Atmospheric Sciences, Lanzhou University, Lanzhou 730000, China
3. College of Computer and Communication, Lanzhou University of Technology, Lanzhou 730050, China
-
Received:2021-04-07Revised:2021-09-24Online:2022-02-28Published:2022-02-28
青藏高原夏季边界层再分析资料的偏差分析及订正
马敏劲1,2(), 陈玥2, 康国强2, 赵侦竹2, 黄万龙2, 谈昌蓉2, 丁凡3
- 1.甘肃省干旱气候变化与减灾重点实验室,甘肃 兰州 730020
2.兰州大学大气科学学院,甘肃 兰州 730000
3.兰州理工大学计算机与通信学院,甘肃 兰州 730050
-
作者简介:马敏劲(1983— ),男,博士,云南昭通人,副教授,主要研究方向为大气边界层和空气污染的数值模拟. E-mail: minjinma@lzu.edu.cn。 -
基金资助:国家重点研发计划重点专项(2017YFC1501800);干旱气象科学研究基金项目面上项目(IAM202002);高原大气与环境四川省重点实验室开放课题共同资助(PAEKL-2019-C3)
CLC Number:
Cite this article
MA Minjin, CHEN Yue, KANG Guoqiang, ZHAO Zhenzhu, HUANG Wanlong, TAN Changrong, DING Fan. Deviation analysis of reanalysis data in boundary layer in summer over Tibetan Plateau and its simulation correction[J]. Journal of Arid Meteorology, 2022, 40(1): 95-107.
马敏劲, 陈玥, 康国强, 赵侦竹, 黄万龙, 谈昌蓉, 丁凡. 青藏高原夏季边界层再分析资料的偏差分析及订正[J]. 干旱气象, 2022, 40(1): 95-107.
share this article
Add to citation manager EndNote|Ris|BibTeX
URL: http://www.ghqx.org.cn/EN/10.11755/j.issn.1006-7639(2022)-01-0095

Fig.1 Terrain of the Tibet Plateau and sites distribution of Wyoming and NOAA sounding data
Fig.1 Terrain of the Tibet Plateau and sites distribution of Wyoming and NOAA sounding data
Tab.1 Introduction to the model parameterization schemes compared in the experiment
| 边界层 方案 | YSU | 对夹卷过程进行显式处理的非局地闭合方案[ |
| MYJ | Mellor-Yamada Level 2.5湍流闭合模型[ | |
| ACM2 | 通过引入参数fconv将非局地闭合方案与局地涡动扩散方案相结合[ | |
| 微物理 方案 | Purdue Lin | 水相物质的预报量为6个,分别为水汽、云水、雨、云冰、雪和霰的预报。在结冰点以下,该方案将云水处理为云冰,雨水处理为雪,适合于高分辨率模拟理论研究 |
| WSM6 | 基本物理过程与Lin方案相似[ | |
| 积云对流 方案 | Kain-Fritsch(new Eta) (简称“浅对流KF”) | 浅对流KF方案采用一个简单的云模式和相对粗糙的微物理过程,考虑伴有水汽的上升下沉运动和云中气流的卷入卷出,对于不能到达最小降水云厚度的上升气流做浅对流(非降水)处理[ |
| Betts-Miller-Janjic (简称“BMJ”) | 来自Betts-Miller(BM)对流调整计划[ |
Tab.2 Sounding test of meteorological elements in PBL (planetary boundary layer) of the Tibet Plateau based on reanalysis data
| 高 度 | 气象要素 | ERA-Interim | JRA-55 | MERRA-2 | ||||||||
|---|---|---|---|---|---|---|---|---|---|---|---|---|
| Bias | RMSE | STDE | Bias | RMSE | STDE | Bias | RMSE | STDE | ||||
| 地面 | T/℃ | -5.01 | 6.07 | 3.15 | -3.67 | 4.77 | 2.62 | -5.49 | 6.80 | 3.84 | ||
| Td/℃ | -0.85 | 3.62 | 3.12 | -269.68 | 271.31 | 26.22 | -1.74 | 4.06 | 3.55 | |||
| DIR/(°) | 44.67 | 145.77 | 129.33 | 40.64 | 142.31 | 120.59 | 55.14 | 145.58 | 125.18 | |||
| SPD/(m·s-1) | 0.77 | 4.00 | 3.66 | -2.01 | 4.00 | 3.33 | 1.08 | 4.41 | 4.07 | |||
| 500 hPa | T/℃ | -0.74 | 1.51 | 1.28 | -0.92 | 1.53 | 1.19 | 0.13 | 1.25 | 1.21 | ||
| Td/℃ | -2.83 | 4.99 | 4.06 | -259.26 | 262.24 | 38.35 | — | — | — | |||
| DIR/(°) | -0.67 | 88.82 | 88.64 | 3.09 | 83.06 | 82.15 | -4.87 | 86.05 | 85.64 | |||
| SPD/(m·s-1) | -1.25 | 6.03 | 5.81 | -6.22 | 8.51 | 5.72 | -0.05 | 6.62 | 6.54 | |||
| 400 hPa | T/℃ | -0.08 | 3.99 | 3.92 | -0.07 | 3.84 | 3.81 | — | — | — | ||
| Td/℃ | -0.42 | 12.15 | 11.98 | -243.54 | 246.76 | 39.06 | — | — | — | |||
| DIR/(°) | 6.56 | 81.07 | 80.30 | -6.08 | 85.68 | 83.70 | — | — | — | |||
| SPD/(m·s-1) | -1.42 | 11.66 | 11.46 | -8.21 | 15.27 | 11.93 | — | — | — | |||

Fig.2 Spatial distribution of seasonal average PBLH (planetary boundary layer height) obtained from ERA-Interim (Unit: m)
Fig.2 Spatial distribution of seasonal average PBLH (planetary boundary layer height) obtained from ERA-Interim (Unit: m)
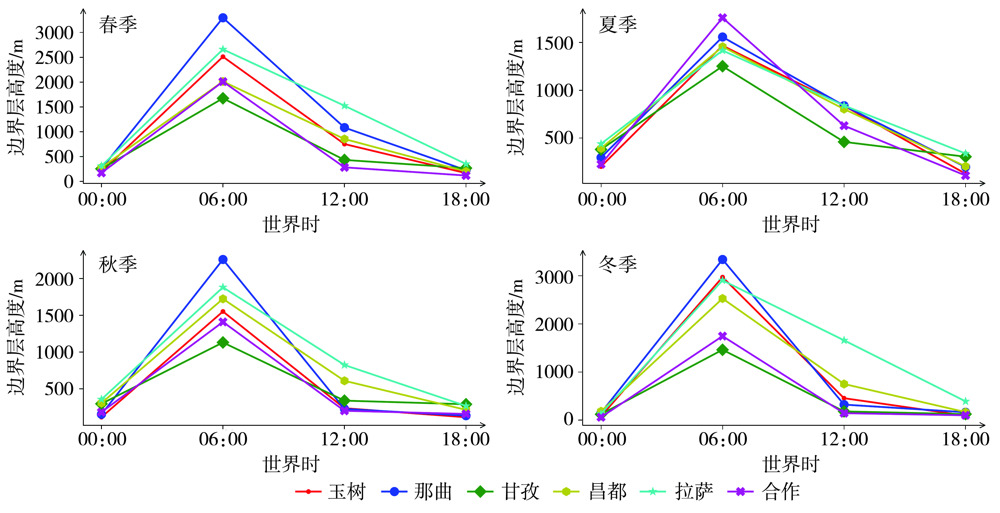
Fig.3 Diurnal variation of seasonal average PBLH obtained from ERA-Interim
Fig.3 Diurnal variation of seasonal average PBLH obtained from ERA-Interim
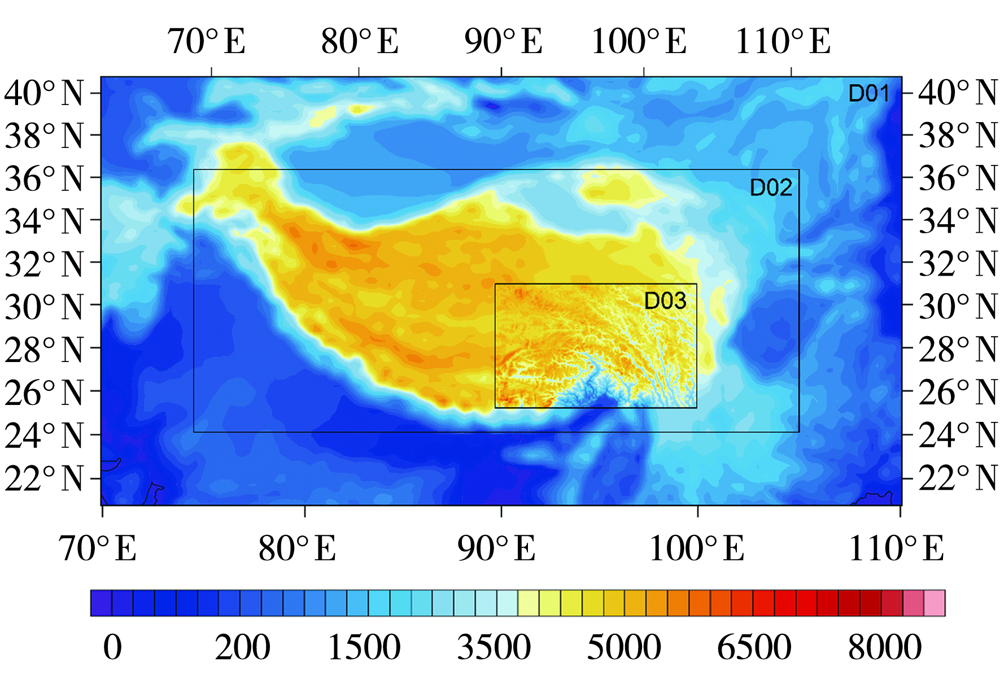
Fig.4 Nesting configurations for numerical simulation (the shaded for terrain height,Unit: m)
Fig.4 Nesting configurations for numerical simulation (the shaded for terrain height,Unit: m)
Tab.3 Parameters for nested domains
| 模式 区域 | X、Y方向 格点数 | 网格距/ km | 左下角网格点 在母域位置 | 地形资料 分辨率 |
|---|---|---|---|---|
| D01 | 163×88 | 27 | 1×1 | 10' |
| D02 | 367×160 | 9 | 61×8 | 2' |
| D03 | 367×226 | 3 | 122×24 | 30″ |
Tab.3 Parameters for nested domains
| 模式 区域 | X、Y方向 格点数 | 网格距/ km | 左下角网格点 在母域位置 | 地形资料 分辨率 |
|---|---|---|---|---|
| D01 | 163×88 | 27 | 1×1 | 10' |
| D02 | 367×160 | 9 | 61×8 | 2' |
| D03 | 367×226 | 3 | 122×24 | 30″ |
Tab.4 Test of mean values of meteorological elements at 5 sites simulated by main 8 scheme-combinations among 12 scheme-combinations in PBL during the simulation period
| ACM2 | BMJ | KF | ||||||||||||||
|---|---|---|---|---|---|---|---|---|---|---|---|---|---|---|---|---|
| LIN | WSM6 | LIN | WSM6 | |||||||||||||
| Bias | RMSE | STDE | Bias | RMSE | STDE | Bias | RMSE | STDE | Bias | RMSE | STDE | |||||
| 地面 | T/℃ | -4.28 | 6.22 | 3.39 | -3.88 | 5.83 | 3.13 | -4.85 | 6.53 | 3.14 | -4.66 | 6.30 | 3.03 | |||
| Td/℃ | -268.40 | 271.73 | 19.61 | -267.96 | 271.29 | 20.14 | -267.65 | 270.98 | 19.86 | -267.53 | 270.86 | 19.78 | ||||
| DIR/(°) | 68.30 | 137.99 | 98.24 | 57.31 | 119.42 | 84.83 | 60.94 | 129.73 | 84.79 | 59.07 | 136.47 | 91.74 | ||||
| SPD/(m·s-1) | -1.67 | 3.70 | 3.06 | -1.44 | 3.45 | 2.94 | -1.84 | 3.72 | 3.04 | -1.55 | 3.91 | 3.38 | ||||
| 500 hPa | T/℃ | 1.99 | 2.58 | 1.64 | 1.45 | 2.00 | 1.25 | 0.29 | 1.28 | 1.12 | 0.73 | 1.48 | 1.20 | |||
| Td/℃ | -271.96 | 271.97 | 1.93 | -265.47 | 268.76 | 19.33 | -264.70 | 267.98 | 19.20 | -264.95 | 268.23 | 19.36 | ||||
| DIR/(°) | -32.08 | 53.78 | 43.16 | -10.33 | 35.85 | 34.33 | -17.69 | 64.53 | 61.29 | -18.20 | 66.82 | 62.35 | ||||
| SPD/(m·s-1) | 1.06 | 4.70 | 4.57 | -1.19 | 3.96 | 3.47 | -2.23 | 4.50 | 3.53 | -1.44 | 3.71 | 3.15 | ||||
| 400 hPa | T/℃ | 1.06 | 1.35 | 0.83 | 0.70 | 1.33 | 0.97 | 0.37 | 1.15 | 1.00 | 0.51 | 1.23 | 1.01 | |||
| Td/℃ | -273.25 | 273.26 | 1.89 | -266.69 | 270.00 | 20.90 | -268.25 | 271.55 | 19.84 | -267.97 | 271.27 | 20.58 | ||||
| DIR/(°) | -16.79 | 53.03 | 50.31 | 1.91 | 81.31 | 68.46 | -9.83 | 88.49 | 80.85 | -6.50 | 92.04 | 84.98 | ||||
| SPD/(m·s-1) | -0.01 | 6.27 | 6.27 | -0.06 | 4.93 | 4.83 | -0.90 | 5.80 | 4.68 | -1.00 | 5.55 | 4.66 | ||||
| YSU | BMJ | KF | ||||||||||||||
| LIN | WSM6 | LIN | WSM6 | |||||||||||||
| Bias | RMSE | STDE | Bias | RMSE | STDE | Bias | RMSE | STDE | Bias | RMSE | STDE | |||||
| 地面 | T/℃ | -3.69 | 5.38 | 2.84 | -3.71 | 5.41 | 2.83 | -4.42 | 6.03 | 2.83 | -4.44 | 6.00 | 2.87 | |||
| Td/℃ | -268.38 | 271.72 | 19.78 | -267.64 | 270.98 | 20.37 | -267.01 | 270.34 | 20.00 | -267.16 | 270.49 | 19.92 | ||||
| DIR/(°) | 49.75 | 125.55 | 84.80 | 59.67 | 130.73 | 86.27 | 57.42 | 122.82 | 89.87 | 67.45 | 137.31 | 94.38 | ||||
| SPD/(m·s-1) | -1.49 | 3.87 | 3.23 | -1.44 | 3.96 | 3.39 | -1.70 | 3.82 | 3.15 | -1.62 | 3.95 | 3.31 | ||||
| 500 hPa | T/℃ | 1.73 | 2.05 | 1.06 | 1.73 | 2.14 | 1.20 | 0.67 | 1.30 | 1.07 | 0.72 | 1.36 | 1.11 | |||
| Td/℃ | -265.85 | 269.15 | 19.27 | -265.54 | 268.85 | 19.51 | -264.76 | 268.05 | 19.21 | -264.72 | 268.01 | 19.16 | ||||
| DIR/(°) | -14.77 | 77.16 | 69.83 | -16.65 | 65.83 | 60.23 | -26.77 | 69.12 | 58.85 | -10.31 | 70.30 | 68.60 | ||||
| SPD/(m·s-1) | -1.36 | 5.03 | 4.41 | -1.93 | 4.78 | 4.15 | -2.81 | 4.46 | 3.19 | -3.31 | 5.09 | 3.44 | ||||
| 400 hPa | T/℃ | 0.85 | 1.42 | 0.97 | 0.90 | 1.44 | 0.94 | 0.60 | 1.20 | 0.88 | 0.68 | 1.27 | 0.91 | |||
| Td/℃ | -267.32 | 270.66 | 21.61 | -266.74 | 270.06 | 20.63 | -268.96 | 272.27 | 20.25 | -268.59 | 271.91 | 20.46 | ||||
| DIR/(°) | -4.77 | 96.53 | 81.67 | -7.29 | 86.21 | 70.69 | -9.28 | 88.34 | 81.79 | -16.95 | 92.12 | 81.35 | ||||
| SPD/(m·s-1) | -0.90 | 5.98 | 5.61 | -1.11 | 6.09 | 5.92 | -2.00 | 5.52 | 4.60 | -2.03 | 5.73 | 4.93 | ||||
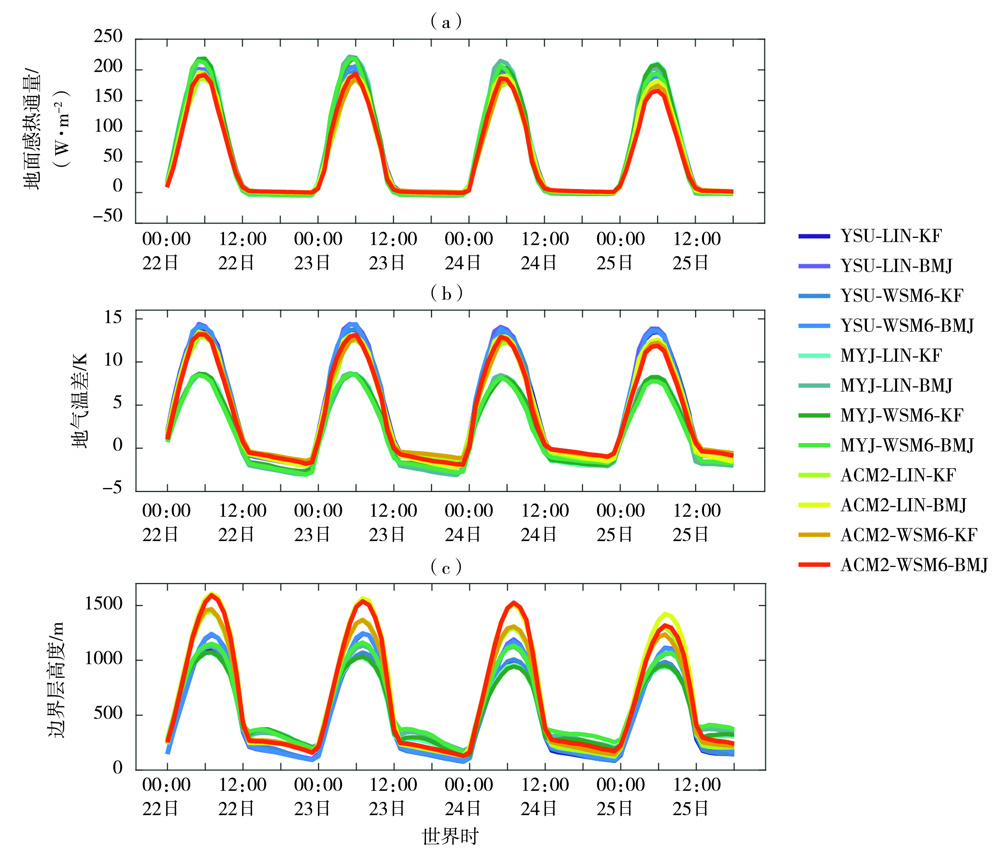
Fig.5 Time series of mean surface sensible heat flux (a),temperature difference between ground and air (b) and PBLH (c) in D03 area in July 2017 simulated by different parameterization scheme combinations
Fig.5 Time series of mean surface sensible heat flux (a),temperature difference between ground and air (b) and PBLH (c) in D03 area in July 2017 simulated by different parameterization scheme combinations
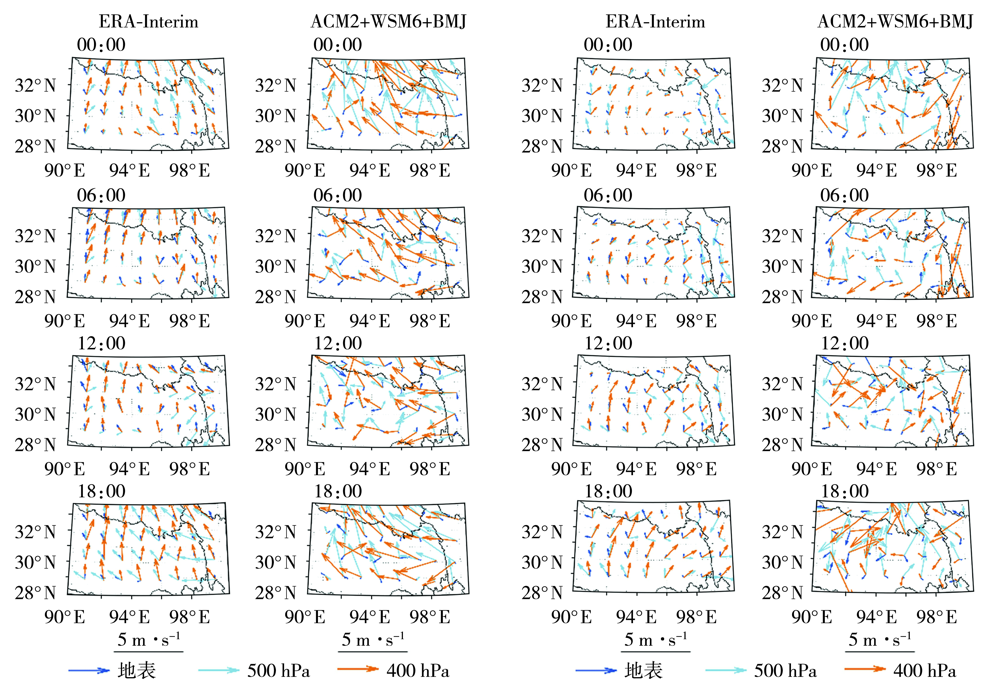
Fig.6 Distribution of horizontal wind field at different levels in PBL in D03 area (Two columns on the left represent a clear sky day on July 22, 2017,two columns on the right represent a rainfall day on July 25, 2017)
Fig.6 Distribution of horizontal wind field at different levels in PBL in D03 area (Two columns on the left represent a clear sky day on July 22, 2017,two columns on the right represent a rainfall day on July 25, 2017)
Tab.5 Unitary linear regression equations between horizontal wind fields in PBL from ERA-Interim and simulated wind fields
| 气压层 | 风场分量 | 回归方程 |
|---|---|---|
| 650 hPa | u v | y=0.5971x-0.2718 y=0.3587x-0.5021 |
| 600 hPa | u v | y=0.6862x-0.6789 y=0.5332x+0.4957 |
| 550 hPa | u v | y=0.7070x-0.7743 y=0.5603x+0.2587 |
| 500 hPa | u v | y=0.7076x-0.6419 y=0.4468x+0.4335 |
| 450 hPa | u v | y=0.7578x-0.8596 y=0.4342x+0.2031 |
| 400 hPa | u v | y=0.7375x+1.4138 y=0.4828x-0.2449 |
Tab.6 Sounding test STDE value of fitted wind field during the simulation period and its reduction rate relative to original reanalysis data
| 站名 | 地面 | 500 hPa | 400 hPa | |||||
|---|---|---|---|---|---|---|---|---|
| DIR/(°) (减率) | SPD/(m·s-1) (减率) | DIR/(°) (减率) | SPD/(m·s-1) (减率) | DIR/(°) (减率) | SPD/(m·s-1) (减率) | |||
| 昌都 | 158.97(-27%) | 3.84(-22%) | 72.75(8%) | 3.17(56%) | 115.56(-122%) | 2.48(52%) | ||
| 甘孜 | 127.73(23%) | 4.11(-8%) | 74.99(13%) | 4.32(42%) | 74.36(-7%) | 32.34(86%) | ||
| 拉萨 | 75.97(35%) | 1.58(55%) | 32.03(61%) | 3.20(28%) | 37.17(61%) | 4.06(38%) | ||
| 那曲 | 120.70(42%) | 3.80(13%) | 73.53(61%) | 4.86(38%) | 76.63(54%) | 4.37(15%) | ||
| 玉树 | 123.27 (21%) | 2.38(35%) | 36.06(73%) | 4.56(45%) | 80.45(22%) | 6.76(24%) | ||
| 区域平均 | 105.28(19%) | 3.11(15%) | 47.01(47%) | 3.29(43%) | 69.63(13%) | 4.33(62%) | ||
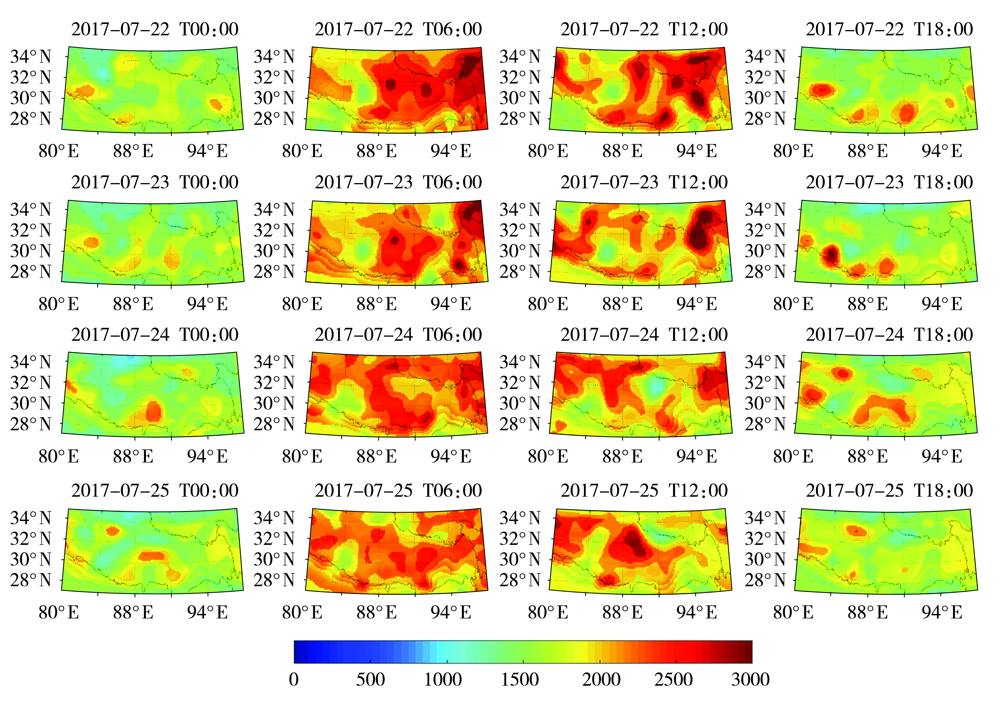
Fig.7 The PBLH calculated from the revised reanalysis data during 22-25 July 2017 (Unit: m)
Fig.7 The PBLH calculated from the revised reanalysis data during 22-25 July 2017 (Unit: m)
| [1] | 张强. 大气边界层气象学研究综述[J]. 干旱气象, 2003, 21(3):74-78. |
| [2] |
ZHANG Wanchun, GUO Jianping, MIAO Yucong, et al. On the summer-time planetary boundary layer with different thermodynamic stability in China: a radiosonde perspective[J]. Journal of Climate, 2018, 31:1451-1464.
DOI URL |
| [3] | 叶笃正, 高由禧. 青藏高原气象学[M]. 北京: 科学出版社, 1979. |
| [4] | CHEN Xuelong. The deep atmospheric boundary layer and its significance to the stratosphere and troposphere exchange over the Tibetan Plateau[J]. PlOS one, 2013, 8(2):1-9. |
| [5] |
STENSRUD D J. Elevated residual layers and their influence on surface boundary-layer evolution[J]. Journal of the Atmospheric Sciences, 1993, 50(14):2284-2293.
DOI URL |
| [6] | LI Yueqing, GAO Wenliang. Atmospheric boundary layer circulation on the eastern edge of the Tibetan plateau, China, in summer[J]. Arctic Antarctic & Alpine Research, 2007, 39(4):708-713. |
| [7] |
TAO Shiyan, DING Yihui. Observational evidence of the influence of the Qinghai-Xizang (Tibet) Plateau on the occurrence of heavy rain and severe convective storms in China[J]. Bulletin of the American Meteorological Society, 1981, 62(1):23-30.
DOI URL |
| [8] |
FU Rong, HU Yuanlong, JONATHON S Wright, et al. From the cover: short circuit of water vapor and polluted air to the global stratosphere by convective transport over the Tibetan plateau[J]. Proceedings of the National Academy of Sciences of the United States of America 2006, 103(15):5664-5669.
PMID |
| [9] |
WILLIAM R Boos, KUANG Zhiming. Dominant control of the South Asian monsoon by orographic insulation versus plateau heating[J]. Nature, 2010, 463(7278):218-222.
DOI URL |
| [10] |
AN Zhisheng, KUTZBACH J E, PRELL W L, et al. Evolution of Asian monsoons an phased uplift of the Himalaya-Tibetan Plateau since Late Miocene times[J]. Nature, 2001, 411(6833):62-66.
DOI URL |
| [11] | 徐祥德, 陈联寿. 青藏高原大气科学试验研究进展[J]. 应用气象学报, 2006, 17(6):756-772. |
| [12] | LI Maoshan, MA Yaoming, MA Weiqiang, et al. Different characteristics of the structure of atmospheric boundary layer between dry and rainy periods over the northern Tibetan Plateau[J]. Sciences in Cold & Arid Regions, 2011, 3(6):509-516. |
| [13] |
ZUO Hongchao, HU Yinqiao, LI Dongliang. Seasonal transition and its boundary layer characteristics in Anduo area of Tibetan Plateau[J]. Progress in Natural Science:Materials International, 2005, 15(3):239-245.
DOI URL |
| [14] | 李英, 胡志莉, 赵红梅. 青藏高原大气边界层结构特征研究综述[J]. 高原山地气象研究, 2012, 32(4):91-96. |
| [15] | 王蓉, 张强, 岳平, 等. 大气边界层数值模拟研究与未来展望[J]. 地球科学进展, 2020, 35(4):331-349. |
| [16] | 王斌. 高原地区NASA与NCEP再分析资料对比和南亚高压活动及其旱涝影响分析[D]. 北京:中国气象科学研究院, 2011. |
| [17] |
除多, 杨勇, 罗布坚参, 等. MERRA再分析地面气温产品在青藏高原的适用性分析[J]. 高原气象, 2016, 35(2):337-350.
DOI |
| [18] |
秦艳慧, 吴通华, 李韧, 等. ERA-Interim地表温度资料在青藏高原多年冻土区的适用性[J]. 高原气象, 2015, 34(3):666-675.
DOI |
| [19] |
ZHAO Tianbao, GUO Weidong, FU Congbin. Calibrating and ealuating ranalysis srface tmperature eror by tpographic correction[J]. Journal of Climate, 2006, 21(6):1440-1446.
DOI URL |
| [20] | 赵天保, 符淙斌. 中国区域ERA-40、NCEP-2再分析资料与观测资料的初步比较与分析[J]. 气候与环境研究, 2006, 11(1):14-32. |
| [21] |
孙玉婷, 高庆九, 闵锦忠. 再分析温度资料与西藏地区冬、夏季观测气温的比较[J]. 高原气象, 2013, 32(4):909-920.
DOI |
| [22] | 刘自牧, 李国平. 高原切变线的客观识别与时空分布的统计分析[J]. 大气科学, 2019, 43(1):13-26. |
| [23] |
谢欣汝, 游庆龙, 保云涛, 等. 基于多源数据的青藏高原夏季降水与水汽输送的联系[J]. 高原气象, 2018, 37(1):78-92.
DOI |
| [24] | 张强, 王蓉, 岳平, 等. 复杂条件陆-气相互作用研究领域有关科学问题探讨[J]. 气象学报, 2017, 75(1):39-56. |
| [25] | 王秀明, 俞小鼎, 朱禾. NCEP再分析资料在强对流环境分析中的应用[J]. 应用气象学报, 2012, 23(2):139-146. |
| [26] | 吴琼, 桂保玉, 徐卫民. 江西省山地风场风速订正方法研究[J]. 气象与环境科学, 2019, 42(1):47-53. |
| [27] | 李斐, 邹捍, 周立波, 等. WRF模式中边界层参数化方案在藏东南复杂下垫面适用性研究[J]. 高原气象, 2016, 36(2):340-357. |
| [28] | 朱士超, 银燕, 金莲姬, 等. 青藏高原一次强对流过程对水汽垂直输送的数值模拟[J]. 大气科学, 2011, 35(6):1057-1068. |
| [29] |
MA Minjin, PU Zhaoxia, WANG Shigong, et al. Characteristics and numerical simulations of extremely large atmospheric boundary-layer heights over an arid region in north-west China[J]. Boundary-Layer Meteorology, 2011, 140(1):163-176.
DOI URL |
| [30] |
CARVALHO D, ROCHA A, GÓMEZ-GESTEIRA M, et al. Sensitivity of the WRF model wind simulation and wind energy production estimates to planetary boundary layer parameterizations for onshore and offshore areas in the Iberian Peninsula[J]. Applied Energy, 2014, 135(2):234-246.
DOI URL |
| [31] |
GARCIA-DIEZ M, FERNÁNDEZ J, FITA L, et al. Seasonal dependence of WRF model biases and sensitivity to PBL schemes over Europe[J]. Quarterly Journal of the Royal Meteorological Society, 2013, 139(671):501-514.
DOI URL |
| [32] |
HU Xiaoming, JOHN W. Nielsen-Gammon, et al. Evaluation of tree planetary boundary layer schemes in the WRF model[J]. Journal of Applied Meteorology and Climatology, 2010, 49(9):1831-1844.
DOI URL |
| [33] |
DEE D P, UPPALA S M, SIMMONS A J, et al. The ERA-Interim reanalysis: configuration and performance of the data assimilation system[J]. Quarterly Journal of the Royal Meteorological Society, 2011, 137(656):553-597.
DOI URL |
| [34] |
KOBAYASHI Shinya, OTA Yukinari, HARADA Yayoi, et al. The JRA-55 reanalysis: general specifications and basic characteristics[J]. Journal of the Meteorological Society of Japan Ser II, 2015, 93(1):5-48.
DOI URL |
| [35] | GELARO Ronald, MCCARTY Will, SUAREZ MAX J, et al. The modern-era retrospective analysis for research and applications, version 2 (MERRA-2)[J]. Journal of Climate, 2017, 30(14):1-105. |
| [36] |
HONG S Y, NOH Y, DUDHIA J. A new vertical diffusion package with an explicit treatment of entrainment processes[J]. Monthly Weather Review, 2006, 134(9):2318-2341.
DOI URL |
| [37] |
NOH Yign, CHEON Woo Geun, RAASCH Siegfried. The role of preconditioning in the evolution of open-ocean deep convection[J]. Journal of Physical Oceanography, 2003, 33(6):1145-1166.
DOI URL |
| [38] | 王颖, 张镭, 胡菊, 等. WRF模式对山谷城市边界层模拟能力的检验及地面气象特征分析[J]. 高原气象, 2010, 29(6):1397-1407. |
| [39] |
JANJIC Zavisa. The step-mountain eta coordinate model: further developments of the convection, viscous sublayer, and turbulence closure schemes[J]. Monthly Weather Review, 1994, 122:927-945.
DOI URL |
| [40] |
PLEIM Jonathan E. A combined local and nonlocal closure model for the atmospheric boundary layer. part I: model description and testing[J]. Journal of Applied Meteorology and Climatology, 2007, 46(9):1383-1395.
DOI URL |
| [41] |
HOLTSALG A A M, BOVILLE B A. Local versus nonlocal boundary-layer diffusion in a global climate model[J]. Journal of Climate, 1993, 6(10):1825-1842.
DOI URL |
| [42] | HONG Songyou, LIM Jeong-Ock Jade. The WRF single-moment 6-class microphsics scheme (WSM6)[J]. Journal of the Korean Meteorological Society, 2006, 42(2):129-151. |
| [43] |
LIN L, FARLEY R D, ORVILLE H D. Bulk parameterization of the snow field in a cloud model[J]. Journal of Climate and Applied Meteorology, 1983, 22(6):1065-1092.
DOI URL |
| [44] |
HONG S Y, DUDHIA J, CHEN S H. A revised approach to ice-microphysical processes for the bulk parameterization of cloud and precipitation[J]. Monthly Weather Review, 2004, 132:103-120.
DOI URL |
| [45] |
KAIN John S. The kain-fritch convective parameterization: an update[J]. Journal of Applied Meteorology, 2004, 43(1):170-181.
DOI URL |
| [46] |
JANJIC Zavisa. Comments on “development and evaluation of a convection scheme for use in climate models”[J]. Journal of the Atmospheric Sciences, 2000, 57:3686-3686.
DOI URL |
| [47] | BETTS A K. A new convective adjustment scheme. part I: observational and theoretical basis[J]. Quarterly Journal of the Royal Meteorological Society, 1986, 112(473):677-691. |
| [48] | BETTS A K, MILLER M J. A new convective adjustment scheme. part II: single column tests using GATE wave, BOMEX and arctic air-mass data sets[J]. Quarterly Journal of the Royal Meteorological Society, 1986, 112:693-709. |
| [49] |
朱智, 师春香, 张涛, 等. 四套再分析土壤湿度资料在中国区域的适用性分析[J]. 高原气象, 2018, 37(1):240-252.
DOI |
| [50] |
MA Minjin, TAN Ziyuan, DING Fan, et al. Spatial characteristics of deep-developed boundary layers and numerical simulation applicability over arid and semi-arid regions in northwest China[J]. Atmosphere, 2019, 10(4):195-219.
DOI URL |
| [51] | GUO Jianping, MIAO Yucong, ZHANG Yong, et al. The climatology of planetary boundary layer height in China derived from radiosonde and reanalysis data[J]. Atmospheric Chemistry & Physics, 2016, 16(20):133 09-133 19. |
| [52] |
VOGELEZANG D H P, HOLTSLAG A A M. Evaluation and model impacts of alternative boundary-layer height formulations[J]. Boundary-Layer Meteorology, 1996, 81(3/4):245-269.
DOI URL |
| [53] |
DUDHIA Jimy. Numerical study of convection observed during the winter monsoon experiment using a mesoscale two-dimensional model[J]. Journal of the Atmospheric Sciences, 1989, 46(20):3077-3107.
DOI URL |
| [54] |
MLAWER Eli J, TAUBMAN Steven J, BROWN Patrick D, et al. Radiative transfer for inhomogeneous atmospheres: RRTM, a validated correlated-k model for the longwave[J]. Journal of Geophysical Research: Atmospheres, 1997, 102(D14):166 63-16 682.
DOI URL |
| [55] |
CHEN Fei, DUDHIA Jimy. Coupling an advanced land surface-hydrology model with the penn state-NCAR MM5 modeling system. part I: model implementation and sensitivity[J]. Monthly Weather Review, 2001, 129(4):569-585.
DOI URL |
| [56] | 马严枝, 陆昌根, 高守亭. 8·19华北暴雨模拟中微物理方案的对比试验[J]. 大气科学, 2012, 36(4):835-850. |
| [57] | 何由, 阳坤, 姚檀栋, 等. 基于WRF模式对青藏高原一次强降水的模拟[J]. 高原气象, 2012, 31(5):1183-1191. |
| [1] | FENG Xiao,LI Xun,YANG Wei,ZHANG Chunhua. Characteristics of a Persistent Sea Fog Process over the Qiongzhou Strait in February 2018 [J]. Journal of Arid Meteorology, 2021, 39(5): 785-795. |
| [2] | QING Qingtao, LIU Jia, LI Xiaolan, LUO Yu, GUO Haiyan, GAN Weiwei, SUN Yu. Analysis of Cause and Evolution Characteristics of a Continuous Severe Fog and Haze Episode in Sichuan Basin [J]. Journal of Arid Meteorology, 2021, 39(4): 610-619. |
| [3] | WANG Chunhong, TAN Yanmei, WANG Qingping, CHEN Yangquan. Characteristics of Vertical Wind Field During Persistent Heavy Fog Processes at Urumqi Airport [J]. Journal of Arid Meteorology, 2021, 39(3): 457-465. |
| [4] | REN Yong, CHEN Sai, YU Anan, FAN Mengqi. Reliability Analysis of Wind Field and Boundary Layer Height in Xiamen Retrieved by Coherent Doppler Wind Lidar [J]. Journal of Arid Meteorology, 2021, 39(3): 514-523. |
| [5] | XU Lina, LI Zhong, HU Yanan, GU Xinbo. Analysis on Meteorological Conditions About Frequent Air Pollution in Hohhot in Winter of 2019 [J]. Journal of Arid Meteorology, 2021, 39(1): 112-118. |
| [6] | REN Yulong, ZHANG Tiejun, LIU Yuanpu, WU Jing. Numerical Simulation of Influence of Underlying Surface Heterogeneity on a Rainstorm Process in Summer Monsoon Transition Zone of China [J]. Journal of Arid Meteorology, 2020, 38(5): 755-763. |
| [7] | QI Yajie, CHEN Min, ZHONG Jiqin, FAN Shuiyong, LIU Ruiting, GUO Chunwei. Effect Evaluation of Short-term Forecast of Surface Meteorological Elements by Using RMAPS-ST Coupled Urban Canopy Model in North China [J]. Journal of Arid Meteorology, 2020, 38(5): 859-868. |
| [8] | HUANG Ying, MAO Wenqian, WANG Xiaoya, ZHANG Wenyu. Temporal and Spatial Distribution of Precipitation in the Qilian Mountain and Its Surrounding Areas in Recent 39 Years [J]. Journal of Arid Meteorology, 2020, 38(4): 527-534. |
| [9] | YANG Kan JI Xiaoling, MAO Lu, ZHANG Suzhao. Numerical Simulation and Comparative Analysis of Topographic Effects on Two Extraordinary Severe Flood Rainstorms in Helan Mountain [J]. Journal of Arid Meteorology, 2020, 38(4): 581-590. |
| [10] | LIU Hao, SONG Haiqing, LI Yunpeng. Applicability Evaluation of Snow Depth Reanalysis Data in Inner Mongolia#br# [J]. Journal of Arid Meteorology, 2020, 38(4): 639-646. |
| [11] | ZENG Yong, YANG Lianmei, ZHANG Yingxin. Numerical Simulation of Mesoscale System During a Rare Torrential Rainstorm Process in Yili of Xinjiang [J]. Journal of Arid Meteorology, 2020, 38(2): 290-300. |
| [12] | TANG Lin, LI Qiong, LI Zuxian, CAI Miao, CAI Ronghui, GAO Qin. Numerical Simulation of Mircophysical Structure of a Mixed Convective Stratiform Cloud System and Analysis of Seeding Conditions#br# [J]. Journal of Arid Meteorology, 2020, 38(1): 100-108. |
| [13] | GAO Song, CHEN Guichuan, WU Zheng, DU Qin, ZHAO Lei, HUYAN Lidou. A Case Analysis of Rainstorm in Sichuan-Chongqing Region Under the Influence of Southwest Vortex [J]. Journal of Arid Meteorology, 2019, 37(4): 597-612. |
| [14] | WANG Rong, HUANG Qian, YUE Ping. Effect of Large Eddy Horizontal Resolution on Simulation of Entrainment and Tracer Vertical Transport [J]. Journal of Arid Meteorology, 2019, 37(1): 48-56. |
| [15] | ZHU Ping, WANG Chenggang, YAN Jiade, LI Ju. Comparison of Three Kinds of Wind Data in Boundary Layers Under Complex Surface Conditions in Beijing [J]. Journal of Arid Meteorology, 2018, 36(5): 794-701. |
| Viewed | ||||||
|
Full text |
|
|||||
|
Abstract |
|
|||||