干旱气象 ›› 2022, Vol. 40 ›› Issue (6): 909-921.DOI: 10.11755/j.issn.1006-7639(2022)-06-0909
西北干旱区一次极端暴雨局地性增强的对流环境特征
傅朝( ), 刘维成(), 宋兴宇, 徐丽丽, 沙宏娥, 马莉, 崔宇
- 兰州中心气象台,甘肃 兰州 730020
-
收稿日期:2022-11-13修回日期:2022-12-20出版日期:2022-12-31发布日期:2023-01-10 -
通讯作者:刘维成 -
作者简介:傅朝(1967—),男,正研级高级工程师,主要从事强对流天气的分析研究. E-mail:dry52889@hotmail.com。 -
基金资助:国家自然科学基金项目(U2142208);国家自然科学基金项目(41505036);甘肃省气象局创新团队项目(GSQXCXTD-2020-01);甘肃省气象局气象科研重点项目(Zd-2023-03);甘肃省气象局气象科研项目人才专项(2122rczx-十人计划-01)
Local enhanced convective environment characteristics of an extreme rainstorm event in arid region of Northwest China
FU Zhao(), LIU Weicheng(), SONG Xingyu, XU Lili, SHA Honge, MA Li, CUI Yu
- Lanzhou Central Meteorological Observatory, Lanzhou 730020, China
-
Received:2022-11-13Revised:2022-12-20Online:2022-12-31Published:2023-01-10 -
Contact:LIU Weicheng
摘要:
干旱地区极端降水事件往往会造成巨大的人员伤亡和经济损失,研究其演变特征及成因有利于提升该类天气的预报准确率。2022年8月13日西北干旱区甘肃省金塔县出现暴雨天气,日降水量和小时降水量均突破河西走廊国家级气象站历史极值,极端性、局地性特征显著。利用欧洲中期天气预报中心(European Centre for Medium-Range Weather Forecasts,ECMWF)第5代全球大气再分析产品ERA5和实况观测资料对其成因进行分析。结果表明:暴雨出现在稳定的南亚高压北侧,对流层中、高层动力强迫较弱,斜压系统主要位于低层,为500 hPa短波槽前的低层切变线和地面冷锋;青藏高原热低压外围的低层水汽持续输送,形成了暴雨区局地性的极端水汽条件和中等强度的层结不稳定;地面冷锋前部,酒泉中东部低层水汽输送的区域差异形成了明显的湿度锋区和干线;造成极端短时强降水的中-γ尺度对流系统由干线触发,在冷锋和干线的交叉点处发展为导致极端暴雨的深厚湿对流,干线对流单体发展到深厚湿对流过程具有显著局地性特征。
中图分类号:
引用本文
傅朝, 刘维成, 宋兴宇, 徐丽丽, 沙宏娥, 马莉, 崔宇. 西北干旱区一次极端暴雨局地性增强的对流环境特征[J]. 干旱气象, 2022, 40(6): 909-921.
FU Zhao, LIU Weicheng, SONG Xingyu, XU Lili, SHA Honge, MA Li, CUI Yu. Local enhanced convective environment characteristics of an extreme rainstorm event in arid region of Northwest China[J]. Journal of Arid Meteorology, 2022, 40(6): 909-921.

图1 2022年8月12日08:00至13日08:00甘肃河西地区24 h累计降水量空间分布(a,单位:mm)和金塔站及近郊区域自动气象站小时降水量演变(b) [图1(a)虚线所围区域为酒泉市肃州区和金塔县]
Fig.1 The spatial distribution of 24-hour accumulated precipitation in Hexi of Gansu Province from 08:00 BST 12 to 08:00 BST 13 August 2022 (Unit: mm) (a) and the evolution of hourly precipitation at Jinta station and its suburban regional automatic meteorological stations (The area enclosed by the dotted line in Fig.1(a) is Suzhou District and Jinta County of Jiuquan City)

图2 2022年8月12日08:00(a)、20:00(b)200 hPa位势高度(等值线,单位:dagpm)和散度(彩色填色区,单位:10-5 s-1),12日20:00(c)、13日08:00(d)500 hPa位势高度(黑色等值线,单位:dagpm)、温度(红色等值线,单位:℃)和风场(风矢,单位:m·s-1) (蓝点代表金塔站位置,下同)
Fig.2 The geopotential height (isolines, Unit: dagpm) and divergence (color shaded areas, Unit: 10-5 s-1) at 200 hPa at 08:00 BST (a), 20:00 BST (b) 12 August, and 500 hPa geopotential height (black isolines, Unit: dagpm), temperature (red isolines, Unit: ℃) and wind field (wind vectors, Unit: m·s-1) at 20:00 BST 12 August (c) and at 08:00 BST 13 August (d) 2022 (The blue dot represents the location of the Jinta station. the same as below)
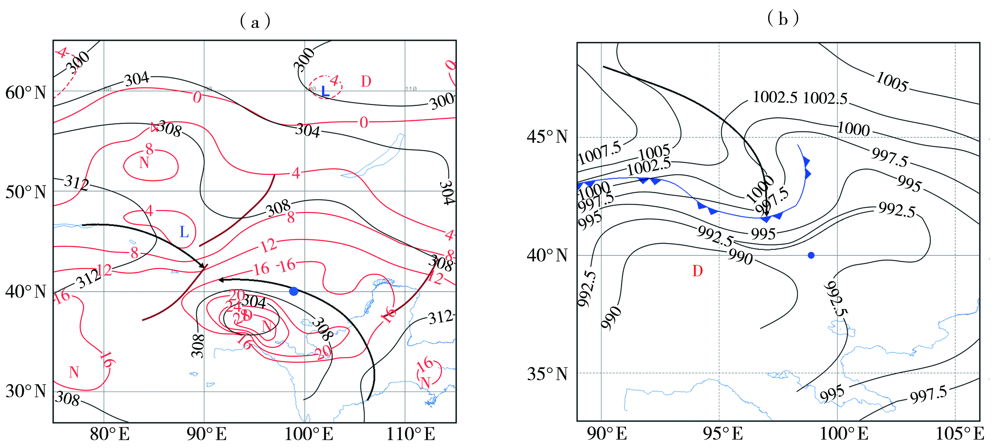
图3 2022年8月12日20:00 700 hPa位势高度(黑色等值线,单位:dagpm)、温度(红色等值线,单位:℃)、切变线(棕色实线)、显著流线(黑色箭头线)(a)和海平面气压(等值线,单位:hPa)、显著流线(黑色箭头线)、地面冷锋(蓝色齿线)(b)
Fig.3 700 hPa geopotential height (black isolines, Unit: dagpm), temperature (red isolines, Unit: ℃), shear line (brown solid lines), significant streamline (black arrow lines) (a), and sea level pressure (isolines, Unit: hPa), significant streamline (black arrow line), surface cold front (blue tooth-line) (b) at 20:00 BST 12 August 2022
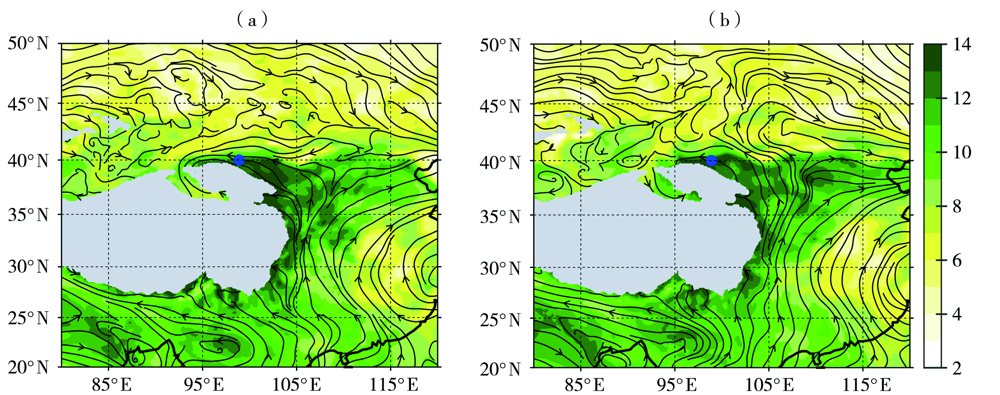
图4 2022年8月12日20:00(a)、13日02:00(b)700 hPa流线(箭头线)和比湿(彩色填色区,单位:g·kg-1) (灰色填充区的地面气压小于700 hPa)
Fig.4 700 hPa streamline (arrow lines) and specific humidity (color shaded areas, Unit: g·kg-1) at 20:00 BST 12 August (a) and 02:00 BST 13 August (b) 2022 (The surface pressure in gray filled area is less than 700 hPa)
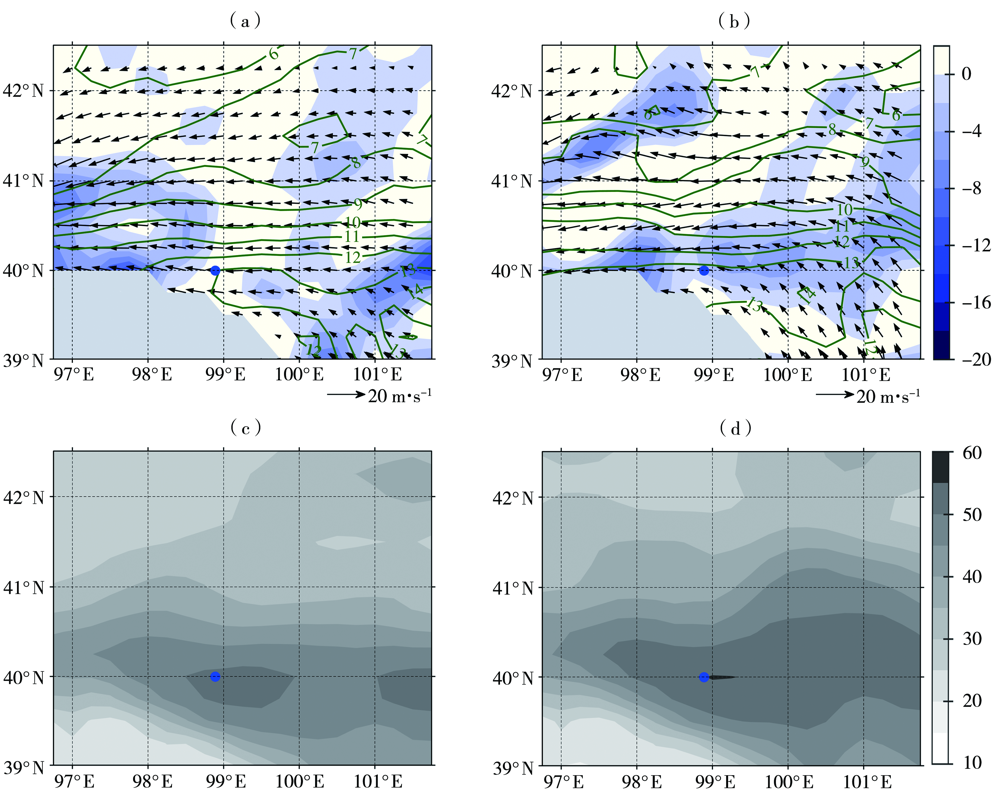
图5 2022年8月12日20:00(a、c)、13日00:00(b、d)700 hPa比湿(等值线,单位:g·kg-1)、水汽通量散度(彩色填色区,单位:10-7 g·hPa-1·cm-2·s-1)、风场(箭矢,单位:m·s-1)(a、b)和整层大气可降水量(单位:mm)(c、d) [图5(a)、图5(b)中灰色填充区的地面气压小于700 hPa]
Fig.5 The specific humidity (isolines, Unit: g·kg-1), vapor flux divergence (color shaded areas, Unit: 10-7 g·hPa-1·cm-2·s-1), wind field (arrow vectors, Unit: m·s-1) at 700 hPa (a, b), and whole layer integrated atmospheric precipitable water (Unit: mm) (c, d) at 20:00 BST 12 August (a, c) and 00:00 BST 13 August (b, d) 2022 [The surface pressure for the gray filled areas in Fig. 5(a) and Fig. 5(b) is less than 700 hPa]
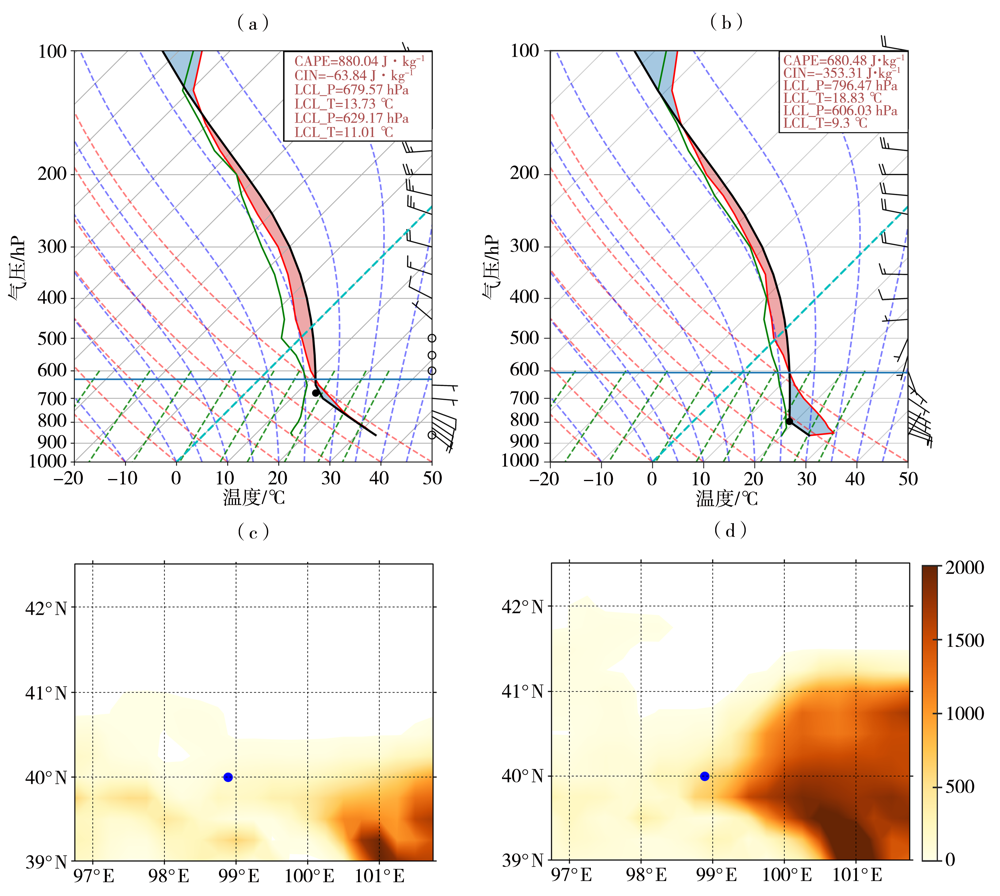
图6 2022年8月12日20:00(a、c)和13日00:00(b、d)金塔站T-ln P图(a、b)和对流有效位能(CAPE)(单位:J·kg-1)(c、d) (红实线为层结曲线,黑实线为状态曲线,绿实线为露点温度线)
Fig.6 T-ln P diagram (a, b) at Jinta station and convective effective potential energy (CAPE) (Unit: J·kg-1) (c, d) at 20:00 BST 12 August (a, c) and 00:00 BST on 13 August (b, d) 2022 (The red, black, green solid lines are stratification curve, state curve and dew point temperature, respectively)

图7 2022年8月12日10:00至13日10:00金塔站比湿(等值线,单位:g·kg-1)、假相当位温(彩色填色区,单位:K)及风场(风矢,单位:m·s-1)时间-高度剖面
Fig.7 The time-height cross-section of specific humidity (isolines,Unit: g·kg-1), pseudo-equivalent potential temperature (color shaded areas, Unit: K) and wind field (wind vectors, Unit: m·s-1) at Jinta station from 10:00 BST 12 August to 10:00 BST 13 August 2022
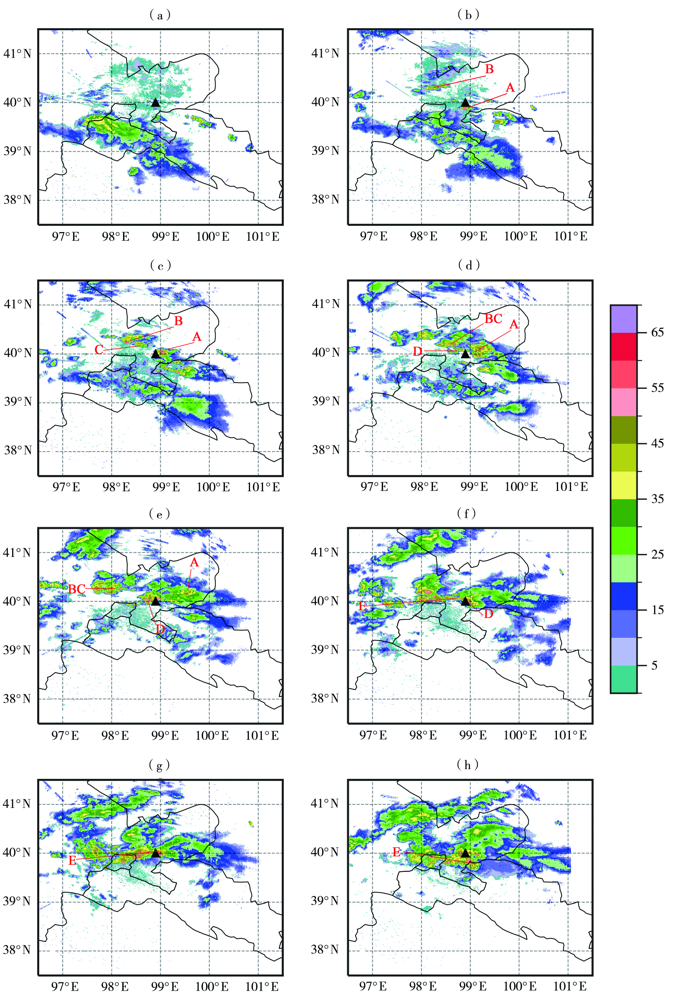
图8 2022年8月12日20:01(a)、20:58(b)、22:01(c)、22:58(d)及13日00:01(e)、01:03(f)、02:00(g)、03:03(h)嘉峪关雷达站组合反射率因子(单位:dBZ) (黑色三角形代表金塔站,英文大写字符用红色线段指向所代表的对流单体或系统)
Fig.8 The combined reflectivity factor from Jiayuguan radar station at 20:01 BST (a), 20:58 BST (b), 22:01 BST (c), 22:58 BST (d) 12 August and 00:01 BST (e), 01:03 BST (f), 02:00 BST (g), 03:03 BST (h) 13 August 2022 (Unit: dBZ) (The black triangle represents Jinta station, the English capital letters connected by red line represent convective cells or systems)
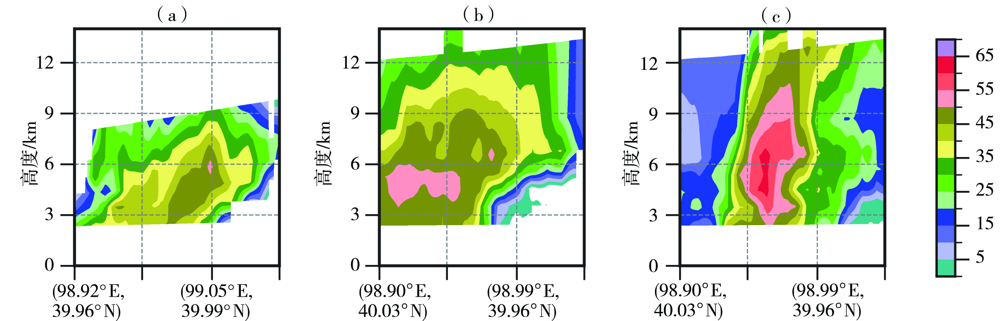
图9 2022年8月12日21:33对流单体A(a)和13日00:29(b)、02:12(c)对流单体D的雷达反射率因子垂直剖面(单位:dBZ)
Fig.9 The vertical profile of radar reflectivity factor of convective cell A at 21:33 BST on August 12 (a) and convective cell D at 00:29 BST (b) and 02:12 BST (c) on August 13, 2022 (Unit: dBZ)
图9 2022年8月12日21:33对流单体A(a)和13日00:29(b)、02:12(c)对流单体D的雷达反射率因子垂直剖面(单位:dBZ)
Fig.9 The vertical profile of radar reflectivity factor of convective cell A at 21:33 BST on August 12 (a) and convective cell D at 00:29 BST (b) and 02:12 BST (c) on August 13, 2022 (Unit: dBZ)
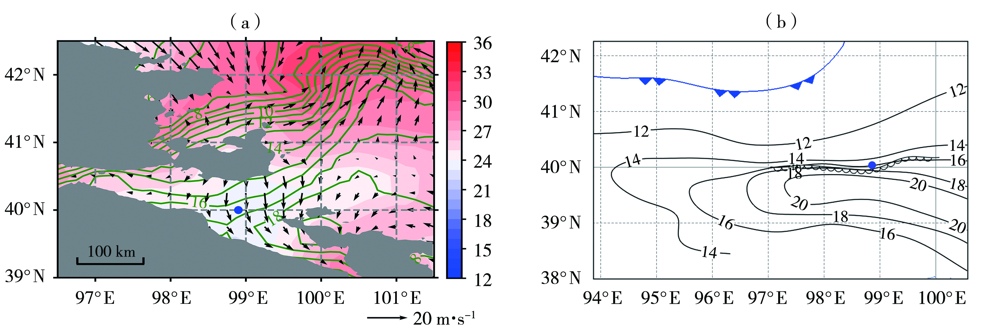
图10 2022年8月12日20:00 850 hPa比湿(等值线,单位:g·kg-1)、温度(彩色填色区,单位:℃)、风场(箭矢,单位:m·s-1)(a)和地面大于等于12 ℃露点温度(黑色等值线,单位:℃)、冷锋(蓝色齿线)、干线(黑色圆齿线)(b) (灰色区域的地面气压小于850 hPa)
Fig.10 The specific humidity (isolines, Unit: g·kg-1), temperature (color shaded areas, Unit: ℃), wind field (arrow vectors, Unit: m·s-1) at 850hPa (a), and surface dewpoint temperature greater than or equal to 12 ℃(black isolines, Unit: ℃), cold front (blue tooth-line), dryline (black circular tooth-line) (b) at 20:00 BST on August 12, 2022 (The surface pressure in gray area is less than 850 hPa.)
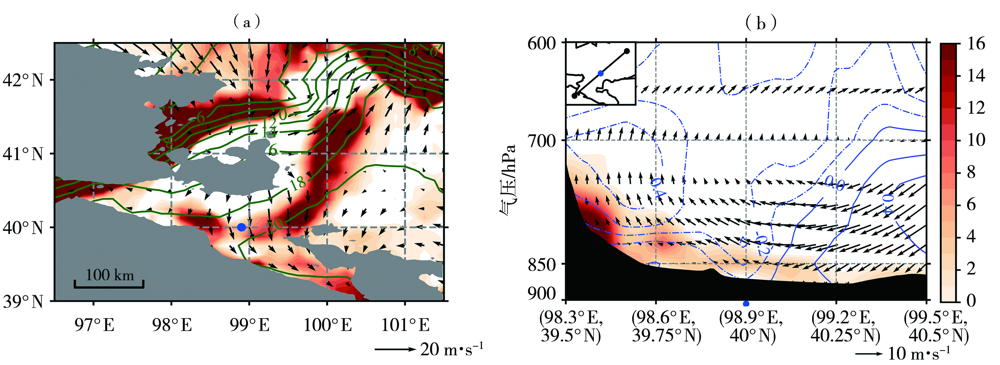
图11 2022年8月12日20:00 850 hPa比湿(绿色等值线,单位g·kg-1)、锋生函数(彩色填色区,单位K·m-1·s-1)、风场(箭矢,单位:m·s-1)(a)和锋生函数(彩色填色区,单位:K·m-1·s-1)、垂直速度(灰色等值线,单位:hPa·s-1)、风场(箭矢,水平风在剖面方向投影与垂直速度合成,单位:m·s-1)垂直剖面(b) [图11(a)灰色填充区的地面气压小于700 hPa;图11(b)的左上角为剖线示意图,黑色区域为地形。下同]
Fig.11 The specific humidity(green isolines, Unit: g·kg-1), frontogenesis function (color shaded areas, Unit: K·m-1·s-1), wind vector (arrow vectors, Unit:m·s-1) at 850hPa (a), and vertical profiles of frontogenesis function (color shaded areas, Unit: K·m-1·s-1), vertical velocity (gray isolines, Unit: hPa·s-1), wind (arrow vector , the composite of vertical velocity with the projection of horizontal wind,Unit:m·s-1) (b) at 20:00 BST on August 12, 2022 (The surface pressure for the gray filled areas in Fig. 11(a) is less than 700 hPa;the left corner in Fig. 11 (b) is diagram of the profile line and the black areas for the terrain. the same as below)

图12 2022年8月12日22:00 850 hPa比湿(等值线,单位g·kg-1)、锋生函数(彩色填色区,单位K·m-1·s-1)、风(箭矢,单位:m·s-1)(a)和23:00地面大于等于12 ℃露点温度(黑色等值线,单位:℃)、冷锋(蓝色齿线)、干线(黑色圆齿线)(b)以及12日23:00(c)和13日00:00(d)锋生函数(彩色填色区,单位:K·m-1·s-1)、垂直速度(等值线,单位:hPa·s-1)、风(箭矢,水平风在剖面方向投影与垂直速度合成,单位:m·s-1)的垂直剖面 (红色字母T是冷锋和干线的三分点位置)
Fig.12 The specific humidity (isolines, Unit: g·kg-1) and frontogenesis function (color shaded areas, Unit:K·m-1·s-1), wind (arrow vector , Unit:m·s-1) at 850 hPa at 22:00 BST on August 12 (a), surface dewpoint temperature greater than or equal to 12 ℃ (black isolines, Unit: ℃), cold front (blue tooth-line), dryline (black circular tooth-line) at 23:00 BST on August 12 (b),and vertical profiles of frontogenesis function (color shaded areas, Unit: K·m-1·s-1), vertical velocity (gray isolines, Unit: hPa·s-1), wind (arrow vector, composite of vertical velocity with projection of horizontal wind on the profile, Unit: m·s-1) at 23:00 BST on August 12 (c) and 00:00 BST on August 13 (d), 2022 (The red letter T is three-point position of the cold front and the dryline)
| [1] | 张强, 林婧婧, 刘维成, 等. 西北地区东部与西部汛期降水跷跷板变化现象及其形成机制[J]. 中国科学:D辑地球科学, 2019, 49 (12): 2064-2078. |
| [2] |
CHEN F H, CHEN J H, HUANG W, et al. Westerlies Asia and monsoonal Asia: spatiotemporal differences in climate change and possible mechanisms on decadal to sub-orbital timescales[J]. Earth-Science Reviews, 2019, 192:337-354.
DOI URL |
| [3] | 荀学义, 胡泽勇, 崔桂凤, 等. 青藏高原季风对我国西北干旱区气候的影响[J]. 气候与环境研究, 2018, 23 (3): 311-320. |
| [4] |
王澄海, 张晟宁, 张飞民, 等. 论全球变暖背景下中国西北地区降水增加问题[J]. 地球科学进展, 2021, 36(9):980-989.
DOI |
| [5] |
徐栋, 孔莹, 王澄海. 西北干旱区水汽收支变化及其与降水的关系[J]. 干旱气象, 2016, 34(3):431-439.
DOI |
| [6] | 姚俊强, 杨青, 毛炜峰, 等. 西北干旱区大气水分循环要素变化研究进展[J]. 干旱区研究, 2016, 35(2):269-276. |
| [7] |
刘维成, 张强, 傅朝. 近55 年来中国西北地区降水变化特征及影响因素分析[J]. 高原气象, 2017, 36(6):1533-1545.
DOI |
| [8] | 王澄海, 张晟宁, 李课臣, 等. 1961—2018 年西北地区降水的变化特征[J]. 大气科学, 2021, 45(4): 713-724. |
| [9] | ZHAI P M, ZHANG X B, WAN H, et al. Trends in total precipitation and frequency of daily precipitation extremes over China[J]. Journal of Climate, 2005, 1897: 1096-1108. |
| [10] | ZHOU B T, XU Y, WU J, et al. Changes in temperature and precipitation extreme indices over China: analysis of a high-resolution grid dataset[J]. International Journal of Climatology, 2016(36):1051-1066. |
| [11] | 马柱国, 符淙斌. 1951-2004 年中国北方干旱化的基本事实[J]. 科学通报, 2006, 25(20):2429-2439. |
| [12] | 赵丽, 韩雪云, 杨青. 近50 a西北干旱区极端降水的时空变化特征[J]. 沙漠与绿洲气象, 2016, 10(1): 19-26. |
| [13] |
ALLANR P, SODEN B J. Atmospheric warming and the amplification of precipitation extremes[J]. Science, 2008, 321 (5895): 1481-1484.
DOI PMID |
| [14] |
TRENBERTH K E. Atmospheric moisture residence times and cycling: implications for rainfall rates and climate change[J]. Climatic Change, 1998, 39(4):667-694.
DOI URL |
| [15] | 孔祥伟, 陶健红. 近51 a甘肃夏季气温和降水极端事件变化[J]. 干旱区研究, 2012, 29(6):965-971. |
| [16] |
孔祥伟, 陶健红, 刘治国, 等. 河西走廊中西部干旱区极端暴雨个例分析[J]. 高原气象, 2015, 34(1):70-81.
DOI |
| [17] |
陶健红, 孔祥伟, 刘新伟. 河西走廊西部两次极端暴雨事件水汽特征分析[J]. 高原气象, 2016, 35(1):107-117.
DOI |
| [18] |
刘洪兰, 张强, 刘德菊, 等. 河西走廊中部一次暴雨过程的天气学诊断[J]. 干旱气象, 2014, 32(2):263-269.
DOI |
| [19] | 胡素琴, 希热娜依·铁里瓦尔地, 李娜, 等. 南疆西部干旱区两次极端暴雨过程对比分析[J]. 大气科学, 2022, 46(5): 1177-1197. |
| [20] |
曾勇, 杨莲梅. 西部一次极端暴雨事件的成因分析[J]. 高原气象, 2018, 37(5): 1220-1232.
DOI |
| [21] | 杨涛, 杨莲梅, 张云惠, 等. 新疆短时强降水天气系统环流配置及雷达回波特征[J]. 干旱气象, 2021, 39(4): 631-642. |
| [22] |
庄晓翠, 李博渊, 赵江伟, 等. 天山南坡暖季暴雨过程的水汽来源及输送特征[J]. 干旱气象, 2022, 40(1):30-40.
DOI |
| [23] | 李文莉, 王宝鉴, 吉惠敏, 等. 河西干旱区短时强降水过程的中尺度分析[J]. 干旱气象, 2013, 31(2):318-326. |
| [24] | 杨秀梅, 孔祥伟, 王勇, 等. 一次干旱区极端暴雨天气的中尺度特征分析[J/OL]. 高原气象, [2022-09-06]. https://kns.cnki.net/kcms/detail/62.1061.P.20220905.1412.002.html. |
| [25] | 付双喜, 张鸿发, 楚忠荣. 河西走廊中部一次强降水过程的多普勒雷达资料分析[J]. 干旱区研究, 2009, 26(5): 656-663. |
| [26] | 滕水昌, 渠永兴, 王坚, 等. 河西走廊一次突发性暴雨天气的诊断分析[J]. 干旱气象, 2007, 25(3):66-71. |
| [27] |
林纾, 李红英, 黄鹏程, 等. 2022年夏季我国高温干旱特征及其环流形势分析[J]. 干旱气象, 2022, 40(5):748-763.
DOI |
| [28] |
郝立生, 马宁, 何丽烨. 2022年长江中下游夏季异常干旱高温事件之环流异常特征[J]. 干旱气象, 2022, 40(5): 721-732.
DOI |
| [29] | 朱乾根, 林锦瑞, 寿绍文, 等. 天气学原理和方法[M]. 北京: 气象出版社, 2007:95-106. |
| [30] | 孙国武. 青藏高原科技实验文集:第2卷[M]. 北京: 科学出版社, 1984:152-158. |
| [31] |
WEI W, ZHANG R H, WEN M, et al. Impact of Indian summer monsoon on the South Asian high and its influence on summer rainfall over China[J]. Climate Dynamics, 2014, 43:1257-1269.
DOI URL |
| [32] |
WEI W, ZHANG R, YANG S, et al. Quasi-biweekly oscillation of the South Asian high and its role in connecting the Indian and East Asian summer rainfalls[J]. Geophysical Research Letters, 2019, 46:14742-14750.
DOI URL |
| [33] | 李江林, 李照荣, 杨建才, 等. 近10 年夏季西北地区水汽空间分布和时间变化分析[J]. 高原气象, 2012, 31(6): 1574-1581. |
| [34] | 方祖亮, 俞小鼎, 王秀明. 东北暖季干线统计分析[J]. 气象学报, 2020, 78(2):260-276. |
| [35] | 俞小鼎, 王秀明, 李万莉, 等. 雷暴与强对流临近预报[M]. 北京: 气象出版社, 2020: 76-77. |
| [36] |
ZIGLER C L, MARTINWJ, PIELKERA, et al. A modeling study of the dryline[J]. Journal of the Atmospheric Sciences, 1995, 52(2):263-285.
DOI URL |
| [37] |
ZIGLER C L, RASMUSSEN E N. The initiation of moist convection at the dryline: forecasting issues from a case study perspective[J]. Weather Forecasting, 1998, 13:1106-1131.
DOI URL |
| [38] |
KOCH S E. The role of an apparent mesoscale frontogenetic circulation in squall line initiation[J]. Monthly Weather Review, 1984, 112(10): 2090-2111.
DOI URL |
| [39] |
WEISS C C, BLUESTEINH B. Airborne pseudo-dual Doppler analysis of a dryline out flow boundary intersection[J]. Monthly Weather Review, 2002, 130: 1207-1226.
DOI URL |
| [40] |
NEIMANP J, WAKIMOTORM. The interaction of a Pacific cold front with shallow air masses east of Rocky mountains[J]. Monthly Weather Review, 1999, 127: 2102-2127.
DOI URL |
| [41] | ROBERT J T. 大气中的中尺度对流过程[M]. 苏德斌,范新港,译. 北京: 气象出版社, 2022:119-124. |
| [1] | 徐栋,孔莹,王澄海. 西北干旱区水汽收支变化及其与降水的关系[J]. 干旱气象, 2016, 34(3): 431-439. |
| [2] | 张强 ,黄荣辉 ,王胜. 浅论西北干旱区陆面过程和大气边界层对区域天气气候的特殊作用[J]. J4, 2011, 29(2): 133-136. |
| [3] | 赵 鸿, 王润元, 王鹤龄, 杨启国, 陈 雷. 西北干旱区棉花对气候变化响应的评价指标体系[J]. J4, 2008, 26(4): 29-34. |
| [4] | 张强, 赵映东, 张存杰, 李耀辉, 孙国武, 高前兆. 西北干旱区水循环与水资源问题[J]. J4, 2008, 26(2): 1-8. |
| [5] | 张 强, 王 胜. 西北干旱区荒漠水分循环特征及其模拟[J]. J4, 2007, 25(4): 1-4. |
| [6] | 王 胜, 张 强, 卫国安. 敦煌干旱区一次降水过程陆面特征模拟[J]. J4, 2004, 22(4): 46-50. |
| 阅读次数 | ||||||
|
全文 |
|
|||||
|
摘要 |
|
|||||
