2025年沙尘入侵湖南省的污染输送分析
Analysis of pollutant transport during sandstorm invasion into Hunan Province in 2025
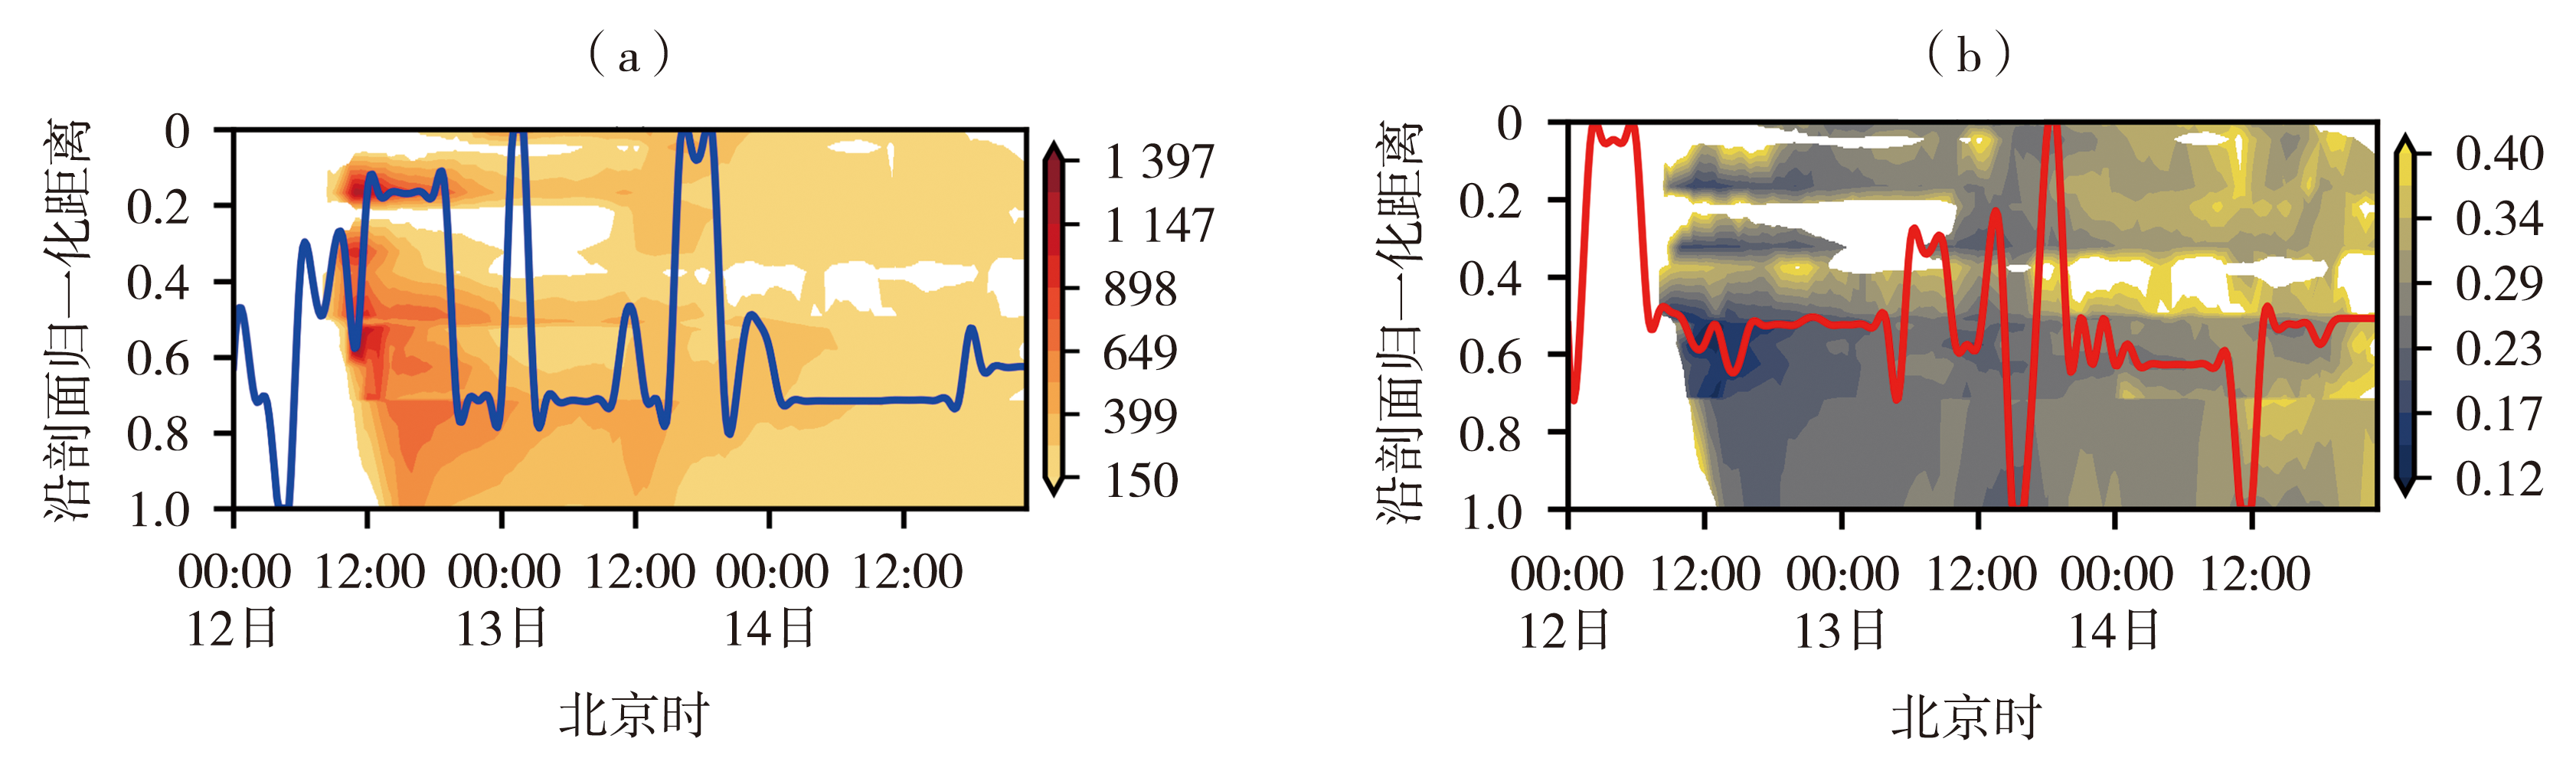
[剖面起点为张家界(29.1°N,110.5°E),终点为郴州(25.8°N,113.0°E),蓝色实线表示PM10质量浓度最大值轨迹,红色实线表示PM2.5与PM10质量浓度比最低值轨迹]
(The profile starts at Zhangjiajie (29.1°N, 110.5°E) and ends at Chenzhou (25.8°N, 113.0°E), the blue solid line indicates the trajectory of the maximum PM10 mass concentration, and the red solid line shows the trajectory of the minimum PM2.5 to PM10 mass concentration ratio)