), 彭丽英2(), 刘祖任1, 余绍荣1, 梁家杰3
), PENG Liying2(), LIU Zuren1, YU Shaorong1, LIANG Jiajie3
), 彭丽英2(), 刘祖任1, 余绍荣1, 梁家杰3
), PENG Liying2(), LIU Zuren1, YU Shaorong1, LIANG Jiajie3
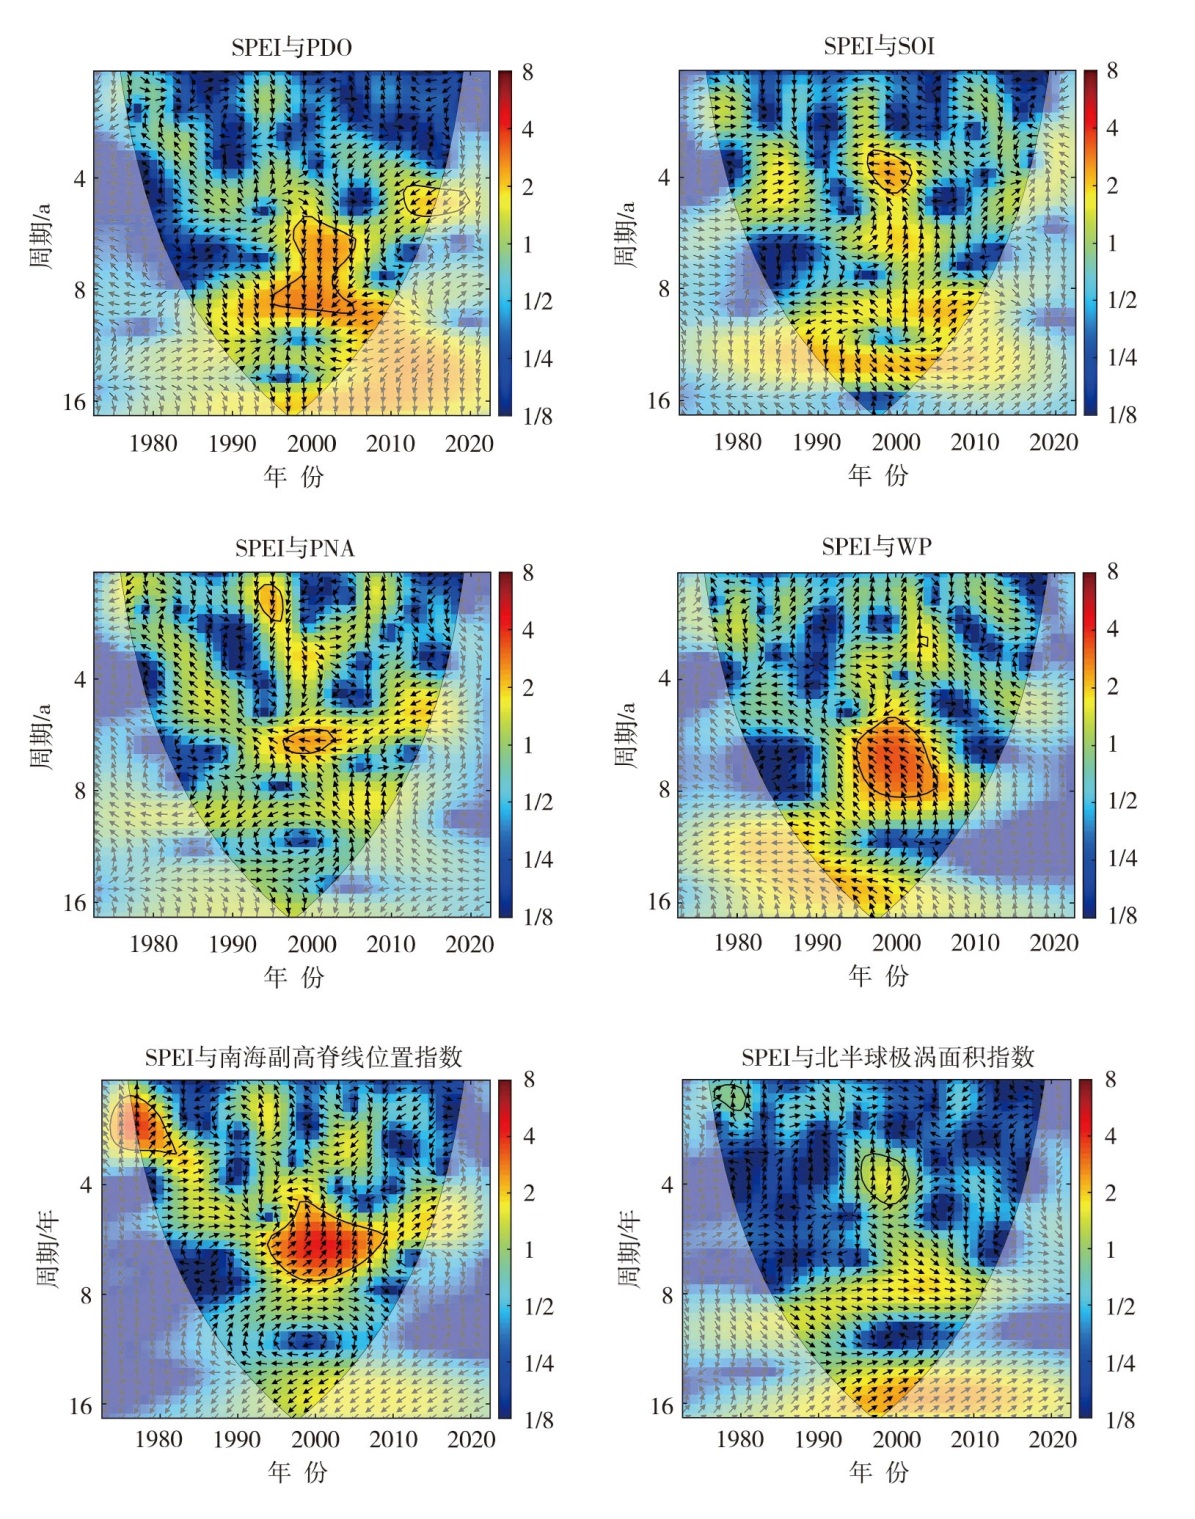
图5. 1973—2022年粤西年SPEI与不同环流指数交叉小波变换周期
(黑色细实线为小波边界效应影响锥,粗黑实线表示通过置信水平为95%的红噪声检验;箭头表示位相关系:←表示两个序列变化呈负位相关系,→表示两个序列变化呈正位相关系,↓表示位相超前90°,↑表示位相滞后90°;色标表示交叉小波变换周期)
Fig.5. The cross wavelet transform period between annual SPEI and different circulation indices in western Guangdong during 1973-2022
(The black thin solid line represents the influence cone of wavelet boundary effect, the thick black solid line represents the red noise test with a confidence level of 95%; the arrow represents the phase relationship: ← represents the negative phase relationship between the two sequence changes, → represents the positive phase relationship between the two sequence changes, ↓ represents the phase leading by 90°, ↑ represents the phase lagging by 90°; the color code represents the period of the cross wavelet transform)