河西走廊2023年春季两次强沙尘天气过程对比
何敏1( ), 王金龙1, 黄玉霞2(), 苟尚2, 张可心3, 王彩凡1, 魏雅鹏4, 张艳荣5, 张伊婕6, 安俊宝1
), 王金龙1, 黄玉霞2(), 苟尚2, 张可心3, 王彩凡1, 魏雅鹏4, 张艳荣5, 张伊婕6, 安俊宝1
Comparison of two severe sand-dust weather processes over the Hexi Corridor in spring 2023
HE Min1(), WANG Jinlong1, HUANG Yuxia2(), GOU Shang2, ZHANG Kexin3, WANG Caifan1, WEI Yapeng4, ZHANG Yanrong5, ZHANG Yijie6, AN Junbao1
), WANG Jinlong1, HUANG Yuxia2(), GOU Shang2, ZHANG Kexin3, WANG Caifan1, WEI Yapeng4, ZHANG Yanrong5, ZHANG Yijie6, AN Junbao1
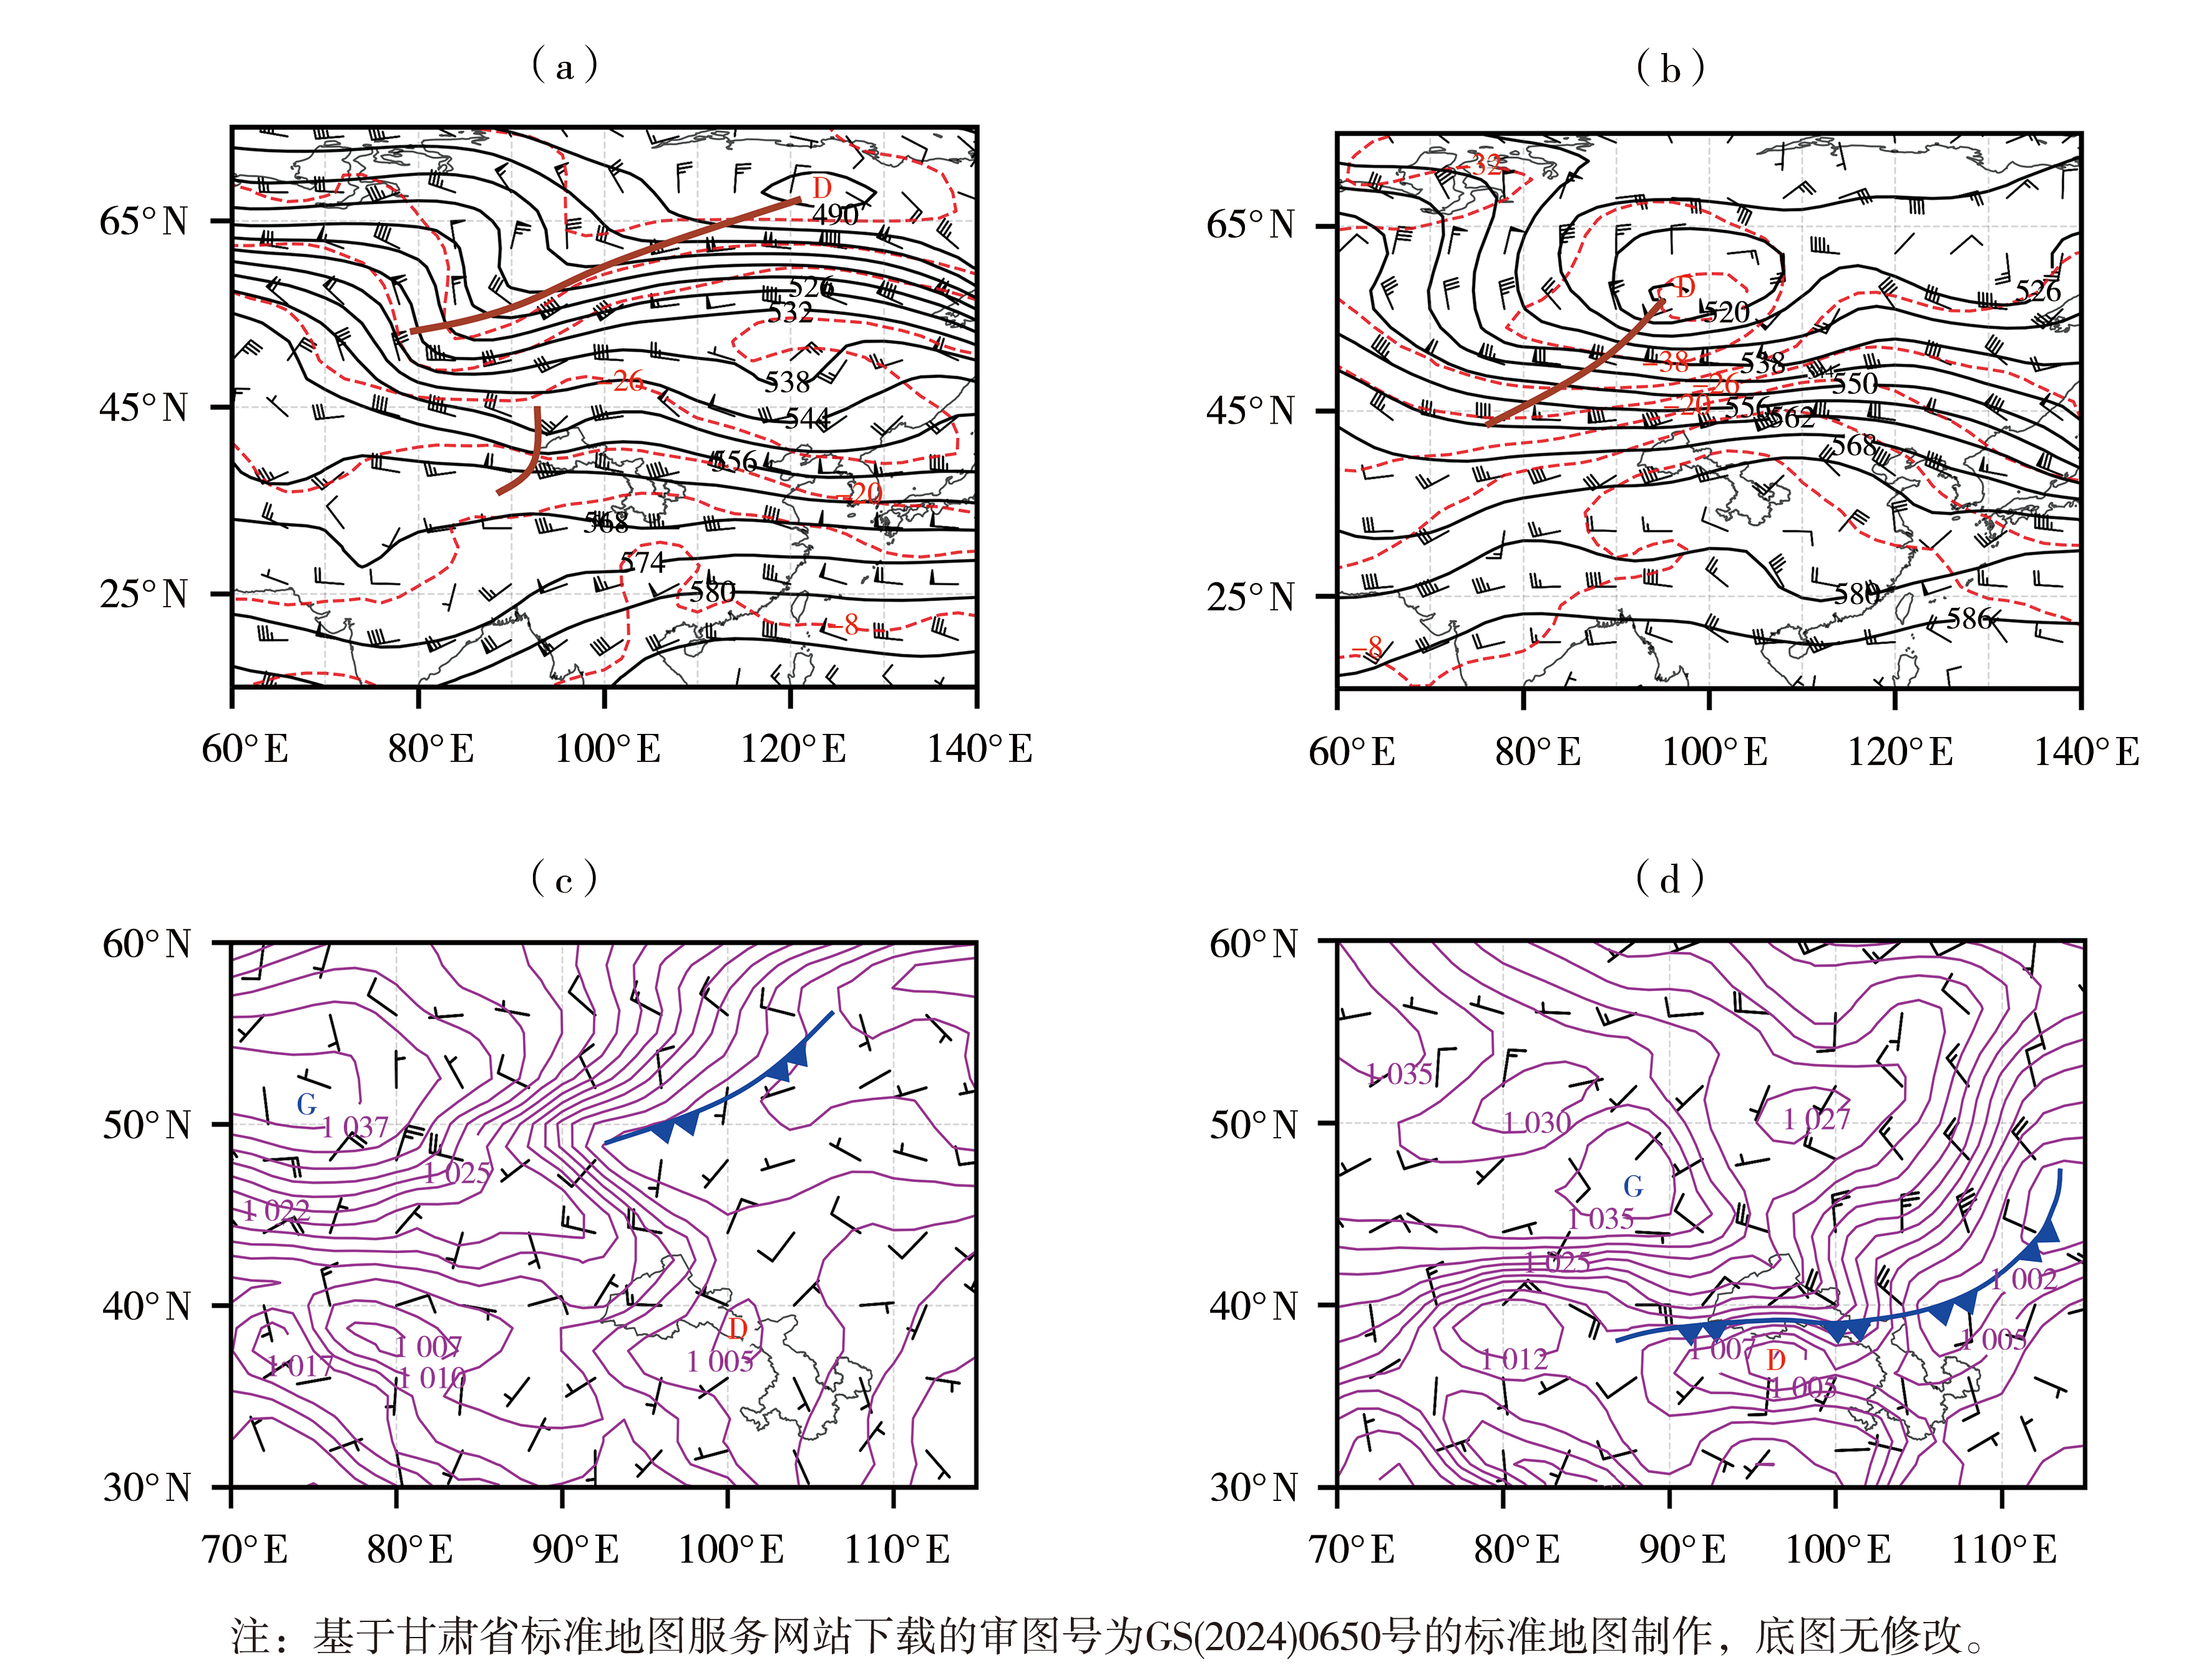
图3. 2023年3月20日08:00(a、c)、4月19日08:00(b、d)500 hPa位势高度场(黑实线,单位:dagpm)、温度场(红虚线,单位:℃)、风场(风矢,单位:m·s-1)(a、b)及海平面气压(紫色等值线,单位:hPa)和地面风场(风矢,单位:m·s-1)(c、d)
(字母D表示低压中心,字母G表示高压中心,棕色粗线表示槽线,蓝色粗线表示锋面)
Fig.3. Geopotential height field (black solid lines, Unit: dagpm), temperature field (red dashed lines, Unit: ℃), and wind field (wind vectors, Unit: m·s-1) at 500 hPa (a, b), and sea level pressure field (purple contours, Unit: hPa) and surface wind field (wind vectors, Unit: m·s-1) (c, d) at 08: 00 on 20 March (a, c) and 19 April (b, d) 2023
(The letter D denotes low-pressure center, and the letter G denotes high-pressure center, thick brown line represents trough line, and thick blue line represents front)