风廓线雷达资料在一次对流暴雨过程中的特征分析
Characteristic analysis of wind profile radar data in a convective rainstorm
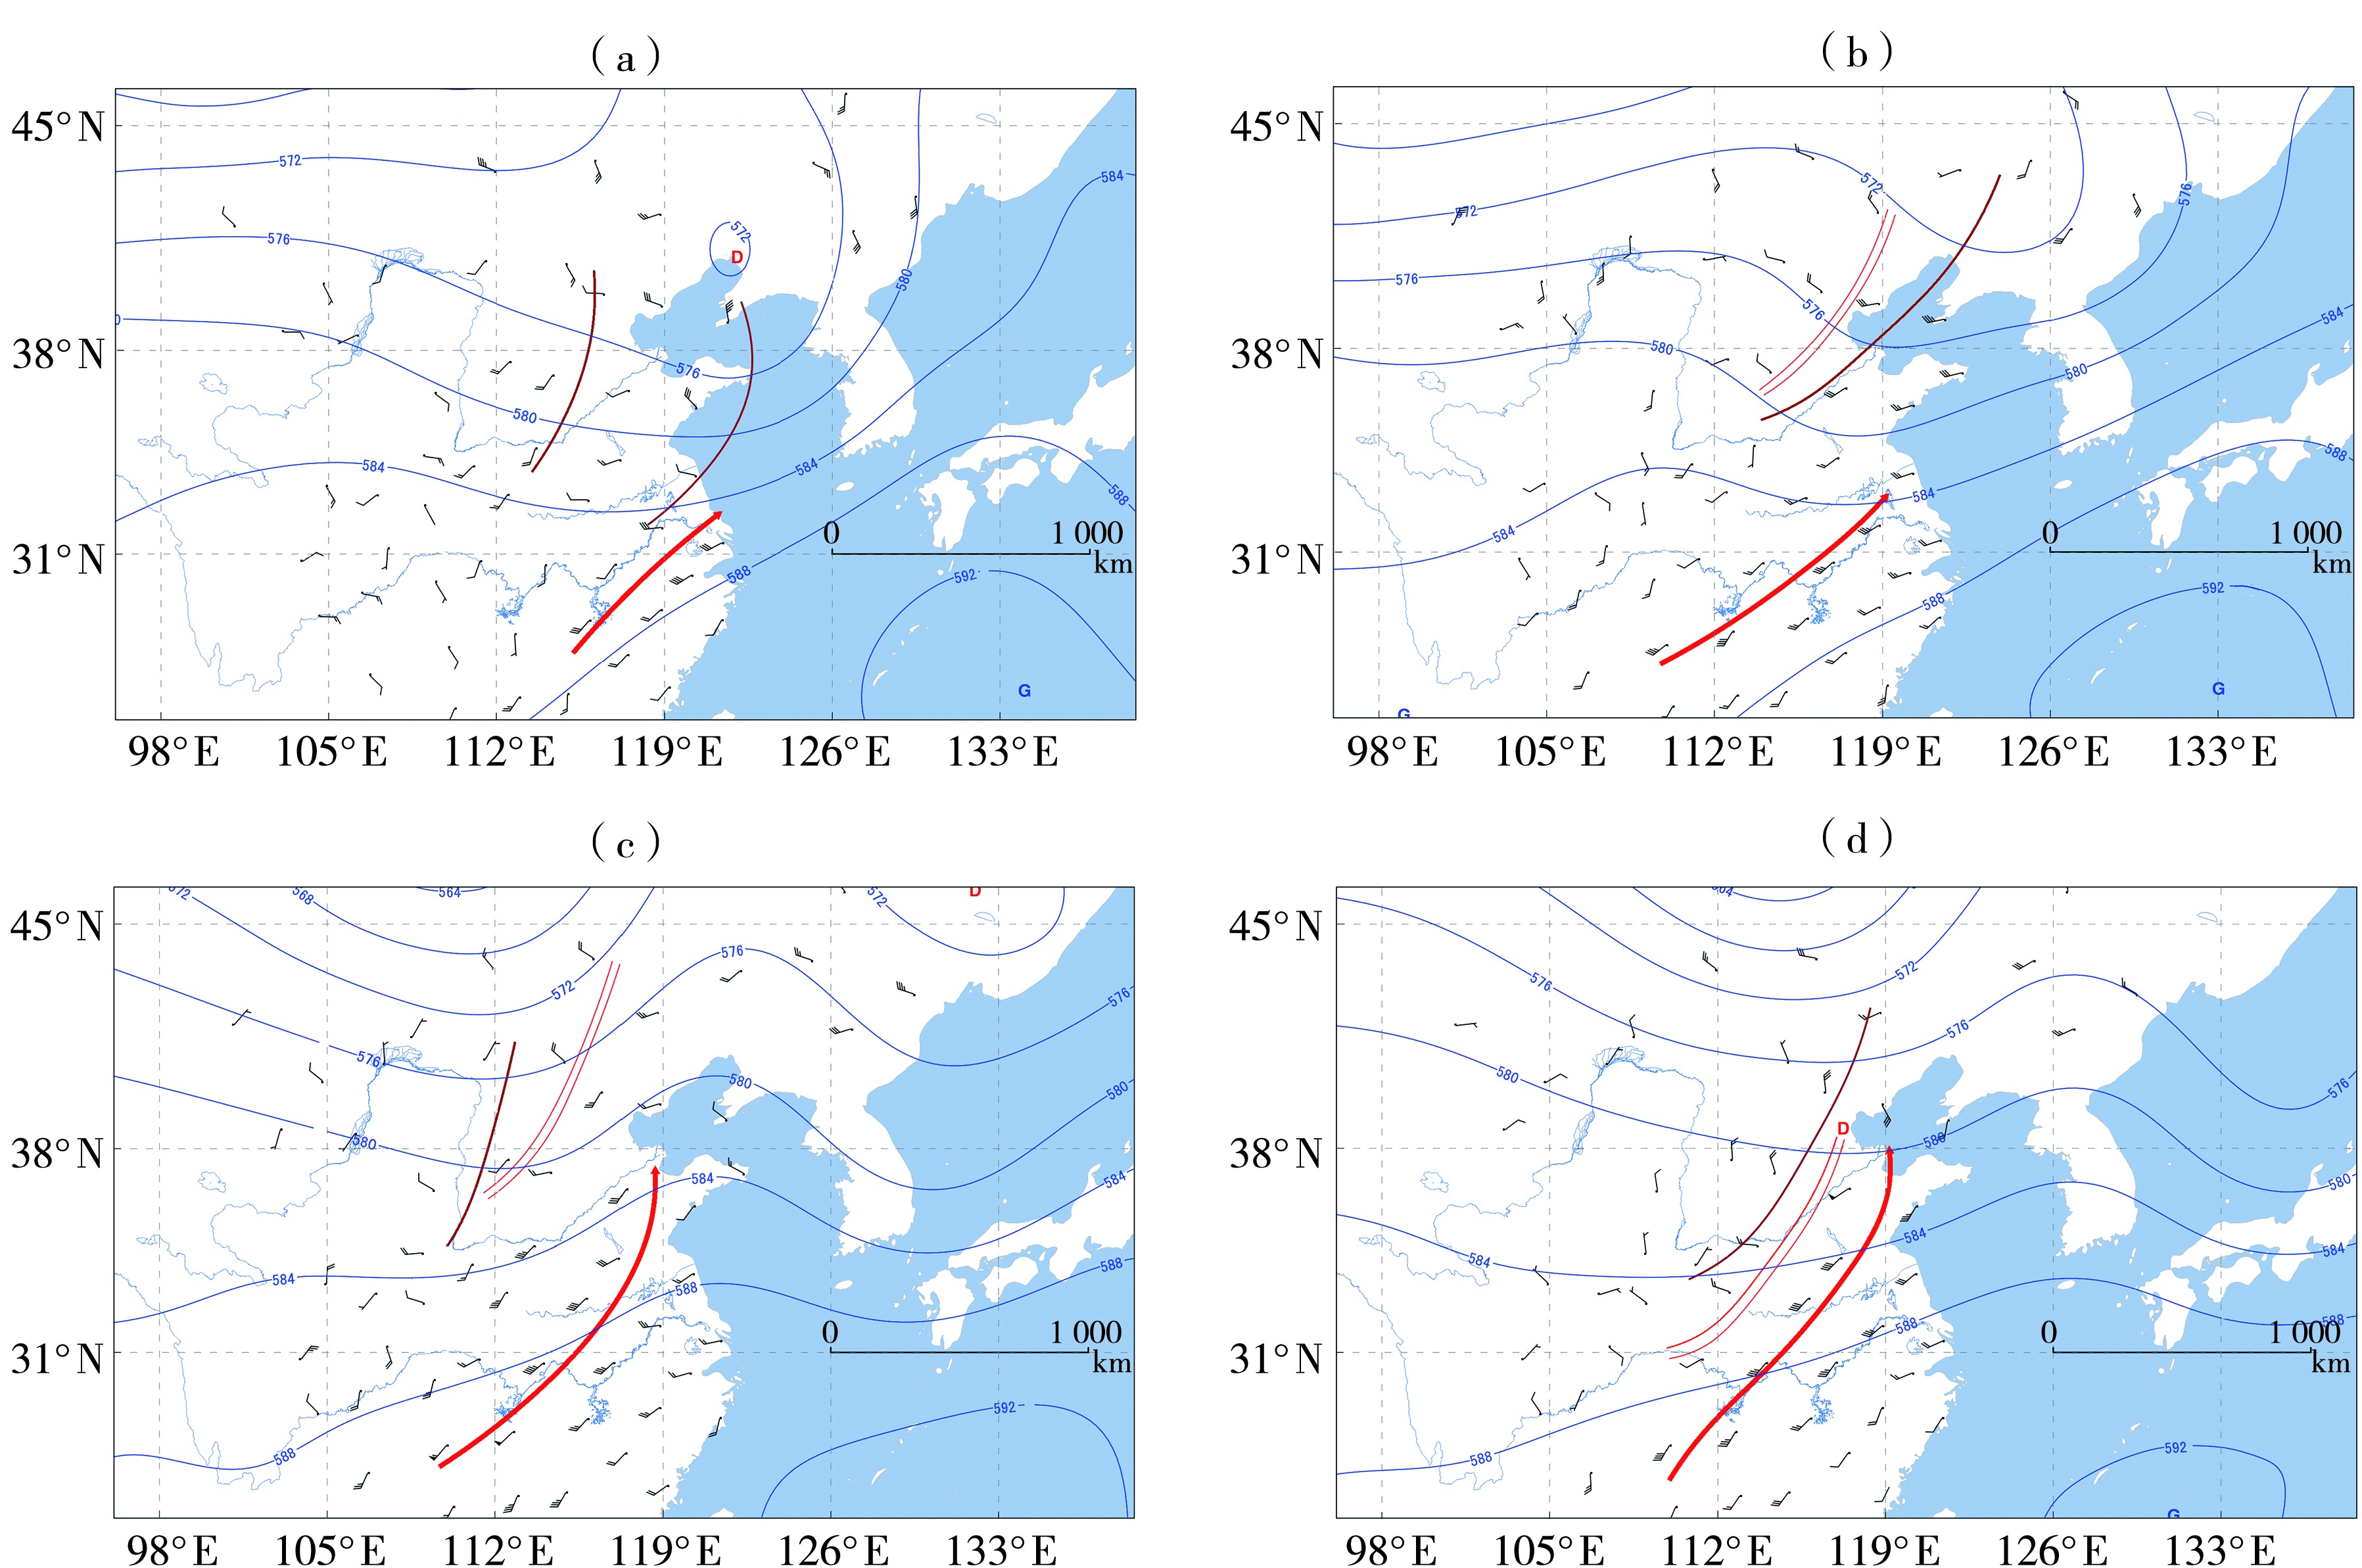
(字母D为低涡中心)
(The letter D represents the center of the vortex)
风廓线雷达资料在一次对流暴雨过程中的特征分析 |
| 王文波, 李晓利, 曹云飞, 杨明, 高晓梅, 杨萌 |
|
Characteristic analysis of wind profile radar data in a convective rainstorm |
| WANG Wenbo, LI Xiaoli, CAO Yunfei, YANG Ming, GAO Xiaomei, YANG Meng |
| 图2 2023年6月26日20:00(a)、27日08:00(b)、28日08:00(c)及28日20:00(d)500 hPa槽线(棕色线)、位势高度场(蓝色线,单位:dagpm)及850 hPa切变线(红色双实线)、急流(红色箭头,单位:m·s-1) (字母D为低涡中心) |
| Fig.2 Trough line (brown lines) and geopotential height field (blue contour lines, Unit: dagpm) at 500 hPa, shear line (red double solid lines) and jet stream (red arrows, Unit: m·s-1) at 850 hPa at 20:00 on 26 (a), 08:00 on 27 (b), 08:00 on 28 (c) and 20:00 on 28 (d) June, 2023 (The letter D represents the center of the vortex) |
|
|