辽东半岛一次大暴雨过程触发和维持机制分析
|
|
梁军, 贾旭轩, 张胜军, 冯呈呈, 李婷婷, 程航, 刘晓初
|
Diagnostic analysis of trigger and maintenance mechanism associated with a rainstorm over Liaodong Peninsula
|
|
LIANG Jun, JIA Xuxuan, ZHANG Shengjun, FENG Chengcheng, LI Tingting, CHENG Hang, LIU Xiaochu
|
|
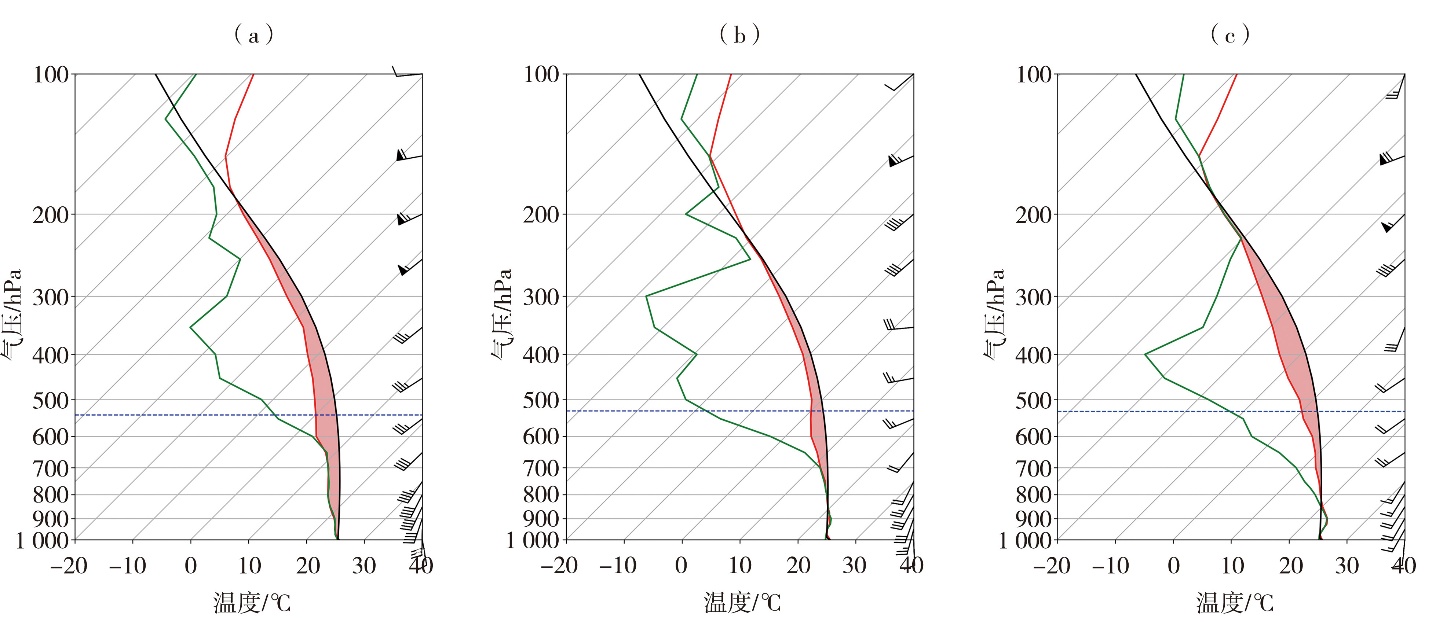
图6 2017年8月4日00:00石灰窑站(a)、03:00大连站(b)和5日02:00董铧炉站(c)T-ln P图
(红线为温度线,绿线为露点线,黑线为状态曲线,蓝色虚线为0 ℃层高度)
|
Fig.6 The T-ln P charts at Shihuiyao Station at 00:00 on 4 (a), Dalian Station at 03:00 on 4 (b) and Donghualu Station at 02:00 on 5(c)August 2017
(the red line for temperature curve, the green line for dew point curve, and the black line for state curve, the blue dotted line for the height of 0 ℃ layer)
|
|
|
|
|