四川盆地一次极端暴雨过程的演变及成因分析
Evolution and cause analysis of an extreme rainstorm process in the Sichuan Basin
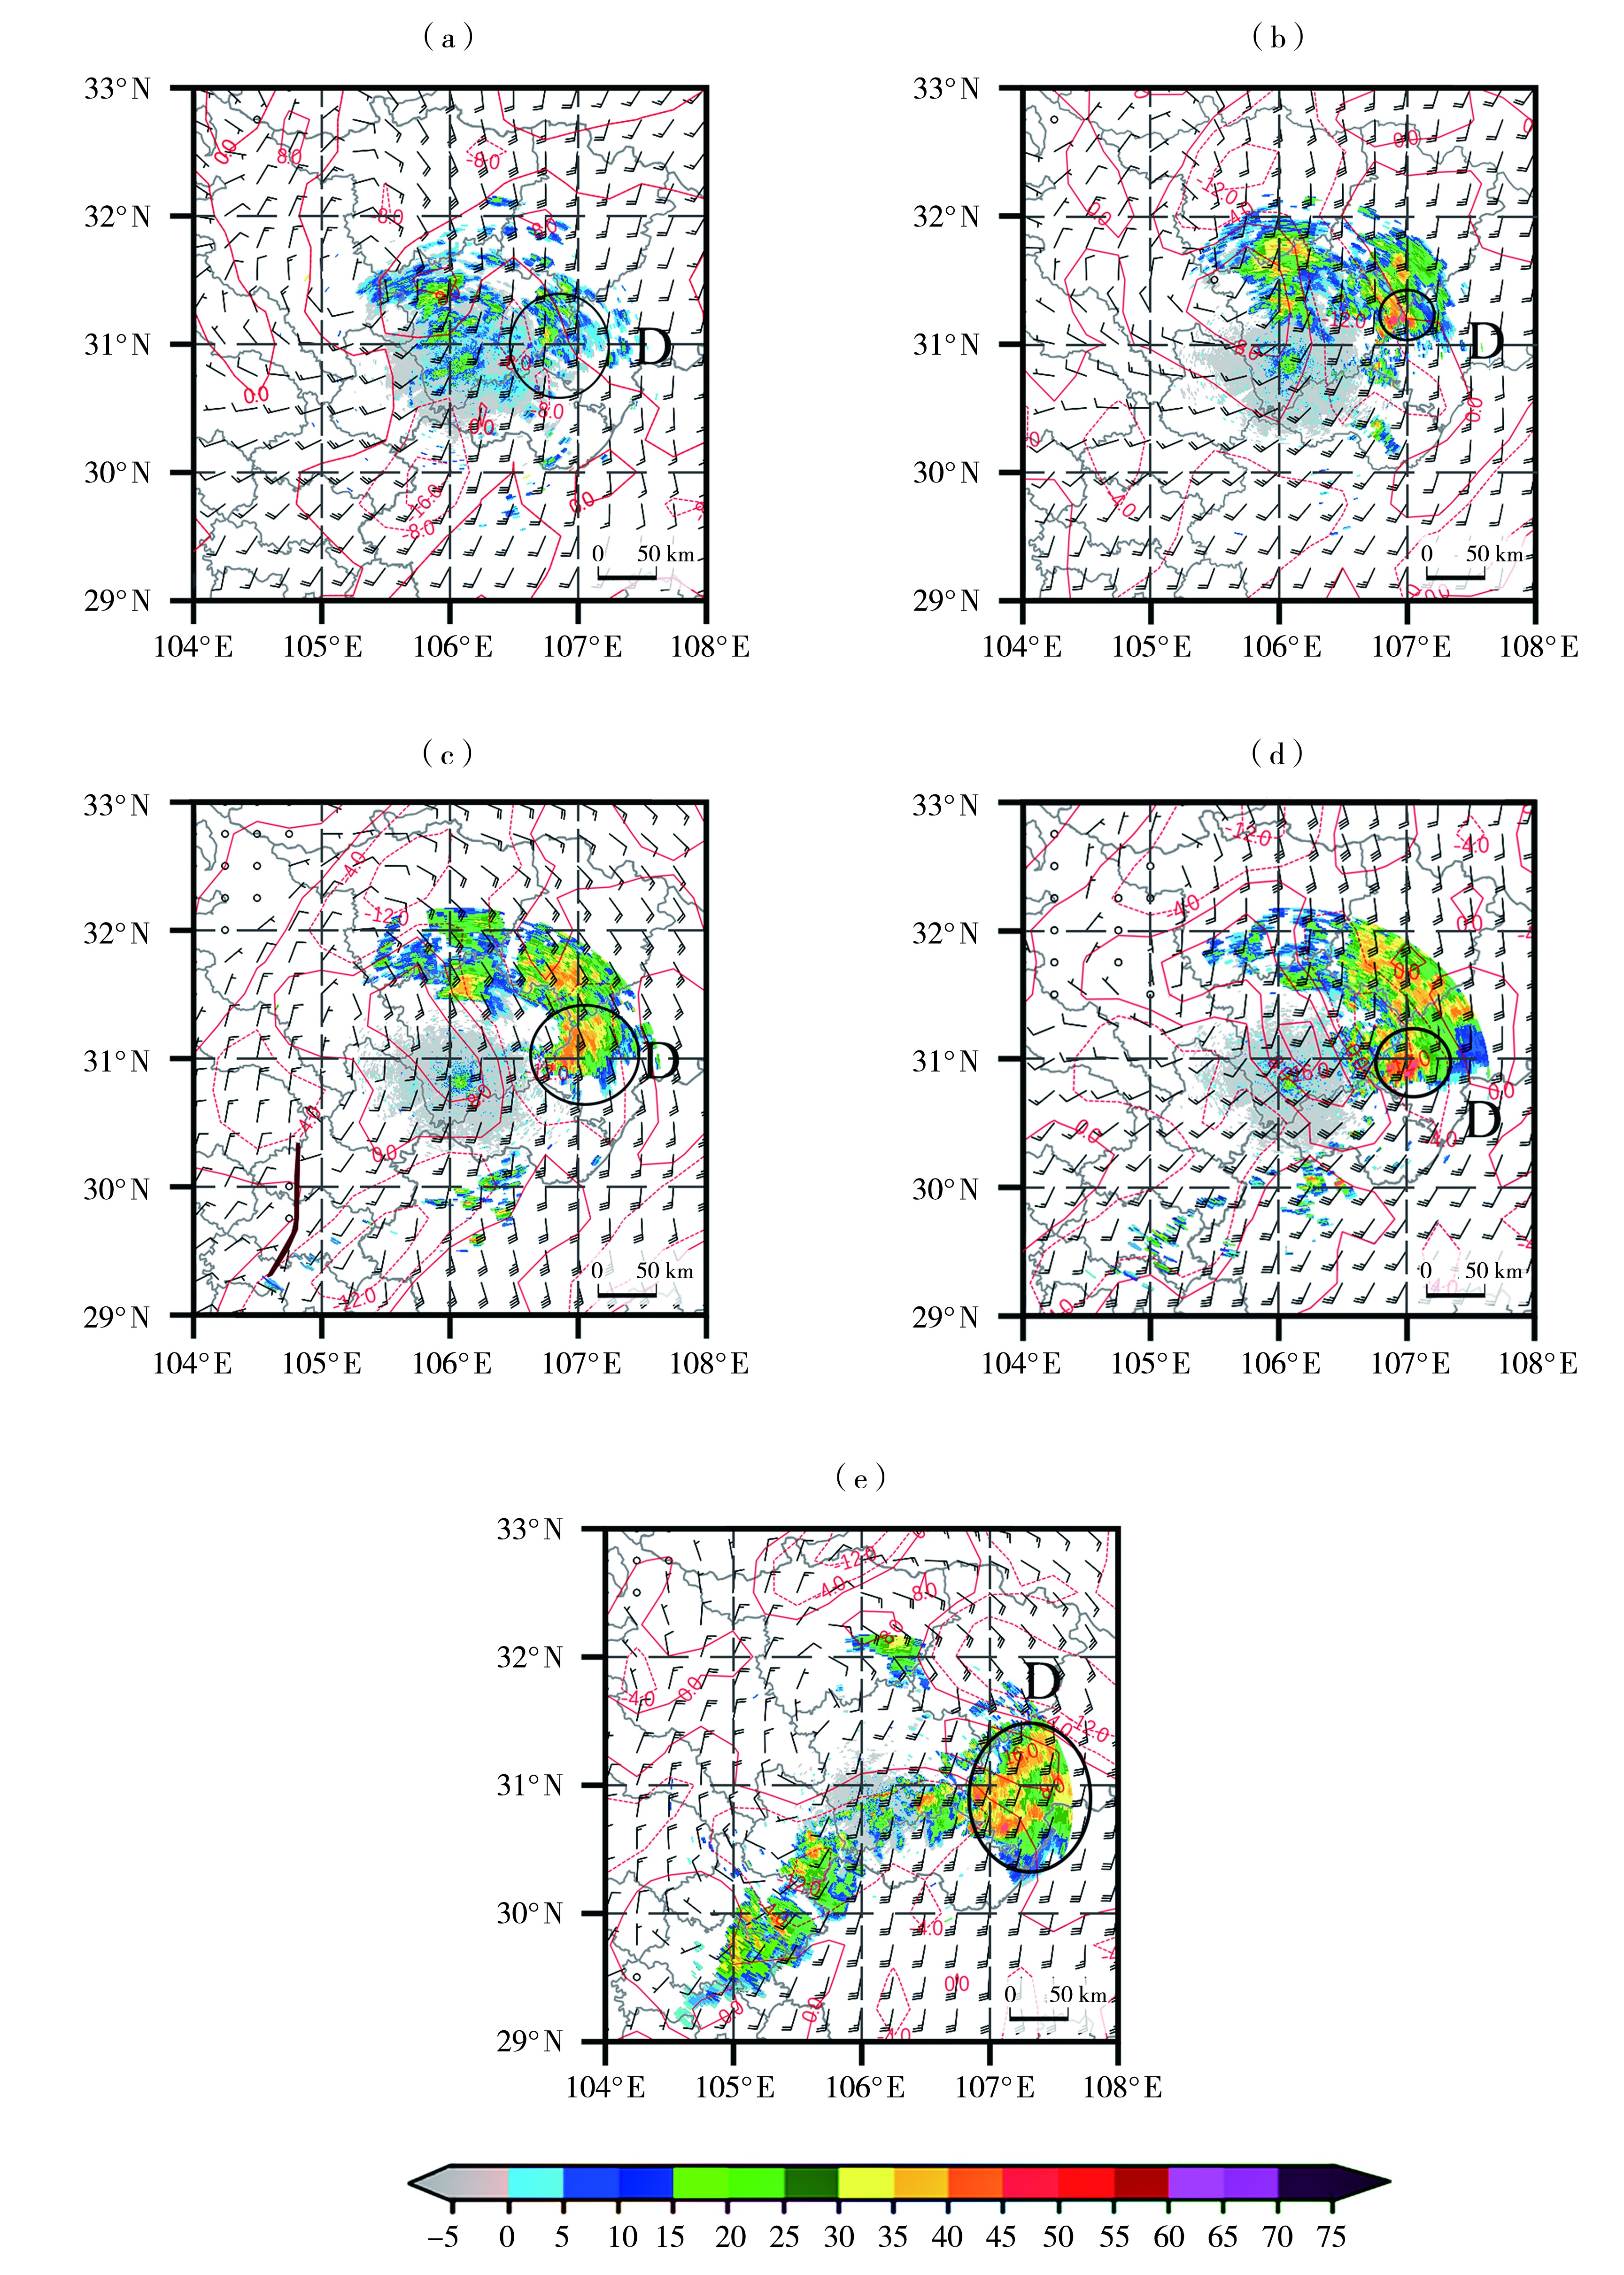
(棕线为切变线,黑色圆圈为对流系统D所在位置)
(The brown line is the shear line, and the black circle indicates the location of the convection system D)
四川盆地一次极端暴雨过程的演变及成因分析 |
| 李梦, 竹利, 张悦含 |
|
Evolution and cause analysis of an extreme rainstorm process in the Sichuan Basin |
| LI Meng, ZHU Li, ZHANG Yuehan |
| 图7 2021年8月7日20:20(a)、23:29(b)及8日01:06(c)、02:00(d)、06:28(e)南充雷达站1.5°仰角反射率因子(填色,单位:dBZ)叠加700 hPa(a、b、d)和800 hPa(c、e)风场(风矢,单位:m·s-1)、750 hPa(a、b、c)和700 hPa(d、e)散度场(红色等值线,单位:10-5 s-1) (棕线为切变线,黑色圆圈为对流系统D所在位置) |
| Fig.7 The radar reflectivity factor on the elevation of 1.5° of Nanchong Station (the color shaded, Unit: dBZ) superimposed with 700 hPa (a, b, d) and 800 hPa (c, e) wind fields (wind vectors, Unit: m·s-1), 750 hPa (a, b, c) and 700 hPa (d, e) divergence fields (red isolines, Unit: 10-5 s-1) at 20:20 (a), 23:29 (b) on 7 and 01:06 (c), 02:00 (d), 06:28 (e) on 8 August 2021 (The brown line is the shear line, and the black circle indicates the location of the convection system D) |
|
|