2022年与2013年浙江夏季极端高温特点和成因对比
|
|
付远, 刘汉华, 周玲丽, 赵军平, 马昊, 陆婷婷, 魏蕾, 宣卓林
|
Comparative analysis of characteristics and causes of summer extreme high temperatures in Zhejiang in 2022 and 2013
|
|
FU Yuan, LIU Hanhua, ZHOU Lingli, ZHAO Junping, MA Hao, LU Tingting, WEI Lei, XUAN Zhuolin
|
|
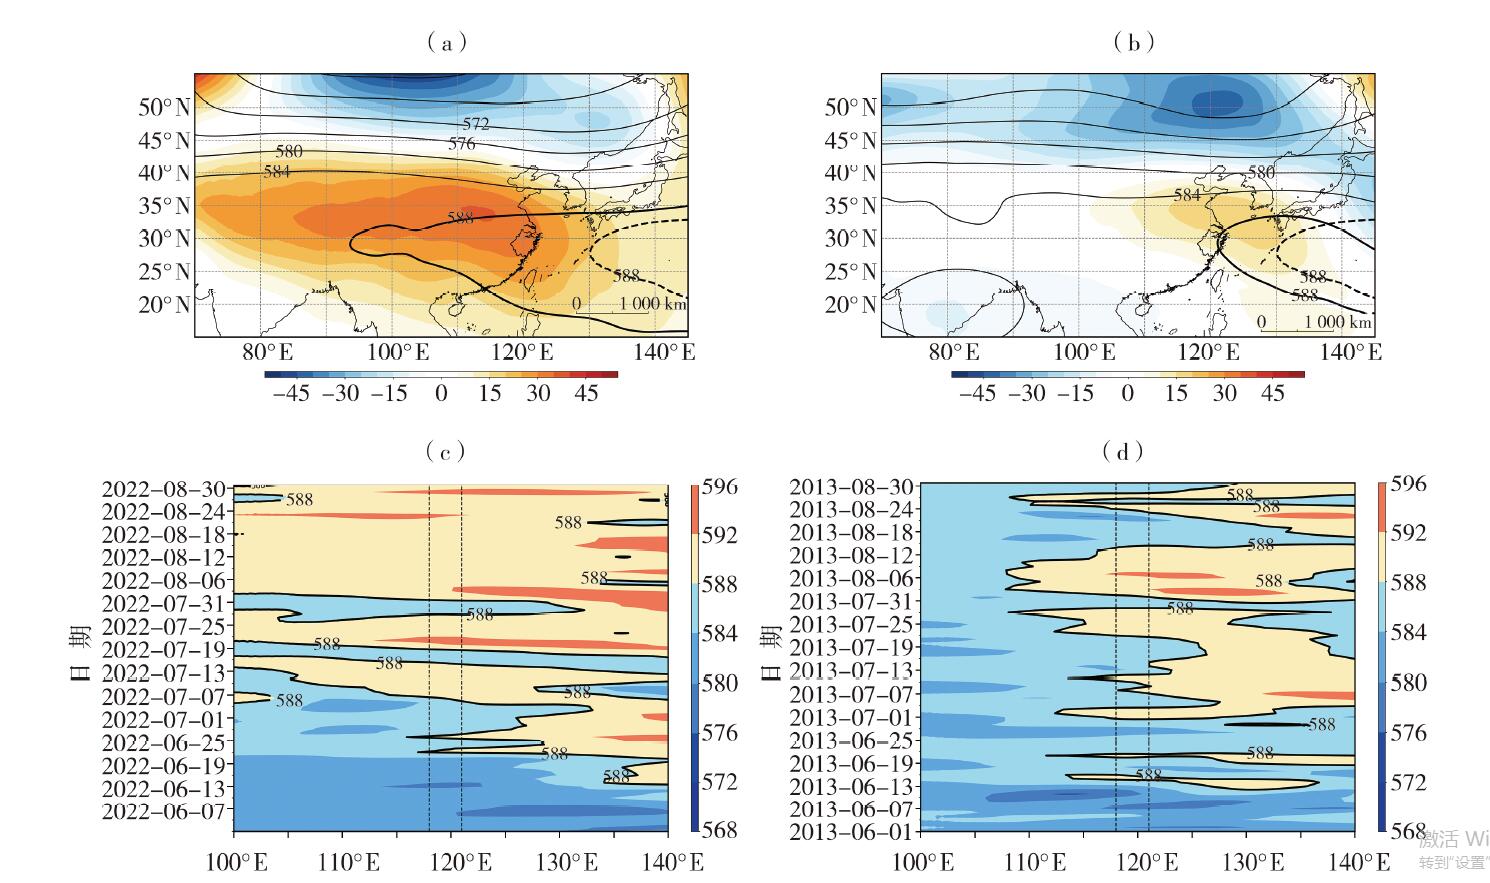
图3 2022 年(a)及2013年(b)7- 8月500 hPa位势高度场(实线)及其距平(填色), 2022年(c)与2013年(d)夏季28°N31°N经向平均的500hPa位势高度的经度-时间剖面(单位:dagpm)
[黑色粗实线和粗虚线分别为588dagpm线在7-8月及气候平均的位置;黑色虚线围成区域表示浙江所在位置(118°E-121°E)]
|
Fig.3 The 500 hPa geopotential height ( contours) and its anomalies ( the color shaded) from July to August in 2022 (a) and 2013 (b), and the longitude-time cross-sections of 500 hPa geopotential height averaged over 28° N-31°N in summers of 2022 (c) and 2013 (d) (Unit: dagpm)
(The thick black solid line and thick dashed lines are the 588 dagpm lines in July-August and the climatological average,respectively. The area enclosed by the black dashed lines represents the location of Zhejiang Province (118° E-121°E), the same as below)
|
|
|
|
|