基于CRA空间检验技术的甘肃河东汛期降水智能网格预报偏差特征分析
Deviation characteristics in intelligent grid forecast of flood season precipitation in Hedong area of Gansu based on CRA spatial forecast verification
基于CRA空间检验技术的甘肃河东汛期降水智能网格预报偏差特征分析 |
| 韩晶, 焦美玲, 曹彦超, 王娟, 贺涛, 徐耕, 周忠文, 金满慧 |
|
Deviation characteristics in intelligent grid forecast of flood season precipitation in Hedong area of Gansu based on CRA spatial forecast verification |
| HAN Jing, JIAO Meiling, CAO Yanchao, WANG Juan, HE Tao, XU Geng, ZHOU Zhongwen, JIN Manhui |
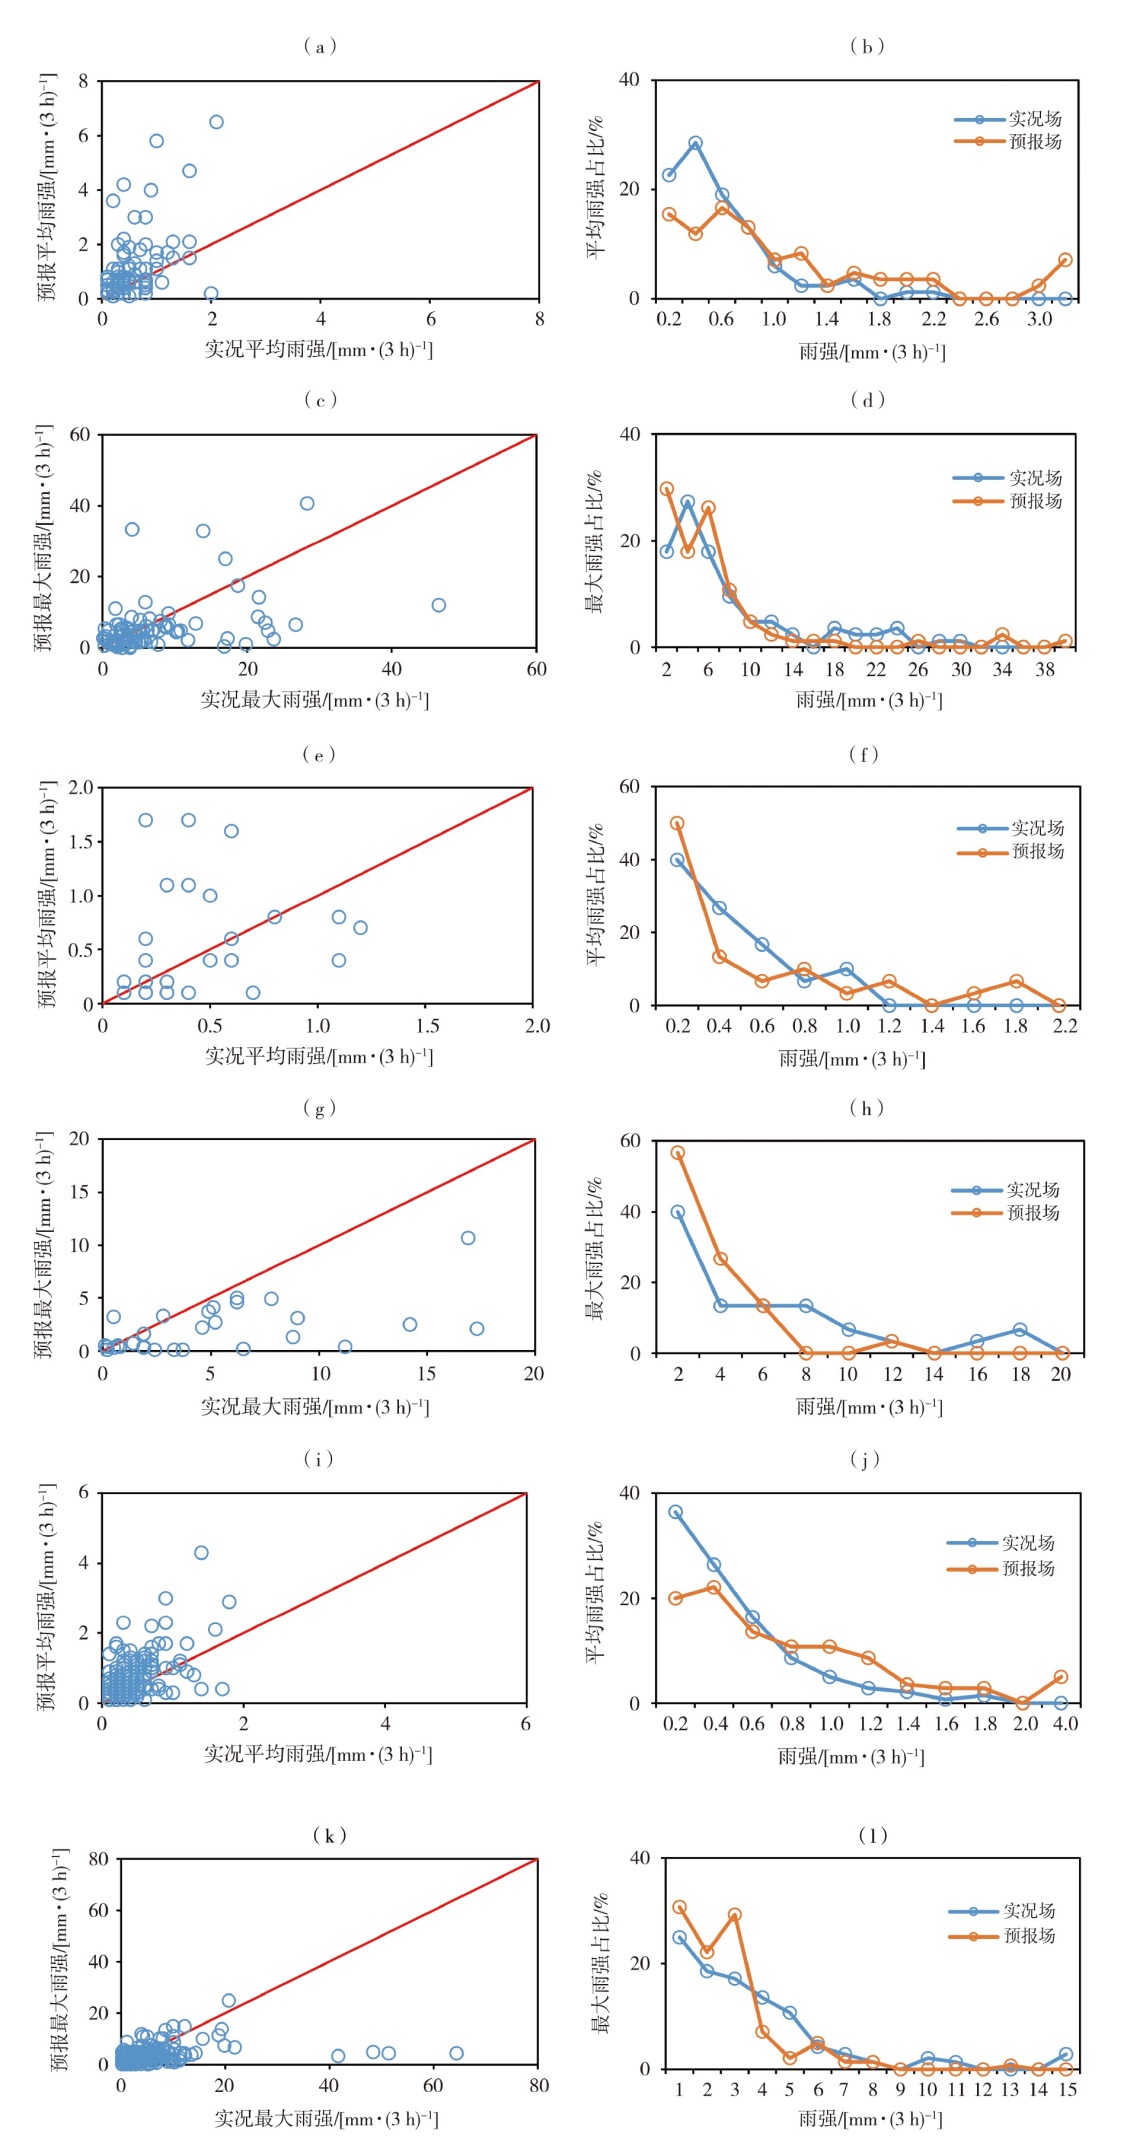
| 图9 暖强迫类(a、b、c、d)、冷强迫类(e、f、g、h)及斜压锋生类(i、j、k、l)平均降水实况与预报雨强散点图(a、e、i)及占比(b、f、j)和最大降水实况与预报雨强散点图(c、g、k)及占比(d、h、l) |
| Fig.9 The scatter plots of average precipitation and forecasted rainfall intensity (a, e, i) and their proportions (b, f, j), and the scatter plots of maximum precipitation and forecasted rainfall intensity (c, g, k) and their proportions (d, h, l) of warm forcing type (a, b, c, d), cold forcing type (e, f, g, h), and oblique pressure frontogenesis type (i, j, k, l) |
|
|