东南沿海一次近云区湍流事件的数值模拟与产生机制研究
|
|
何沛霖, 吴迪, 王柯化, 李克南
|
Numerical simulation and generation mechanism of a near-cloud turbulence encounter in southeast coast of China
|
|
HE Peilin, WU Di, WANG Kehua, LI Kenan
|
|
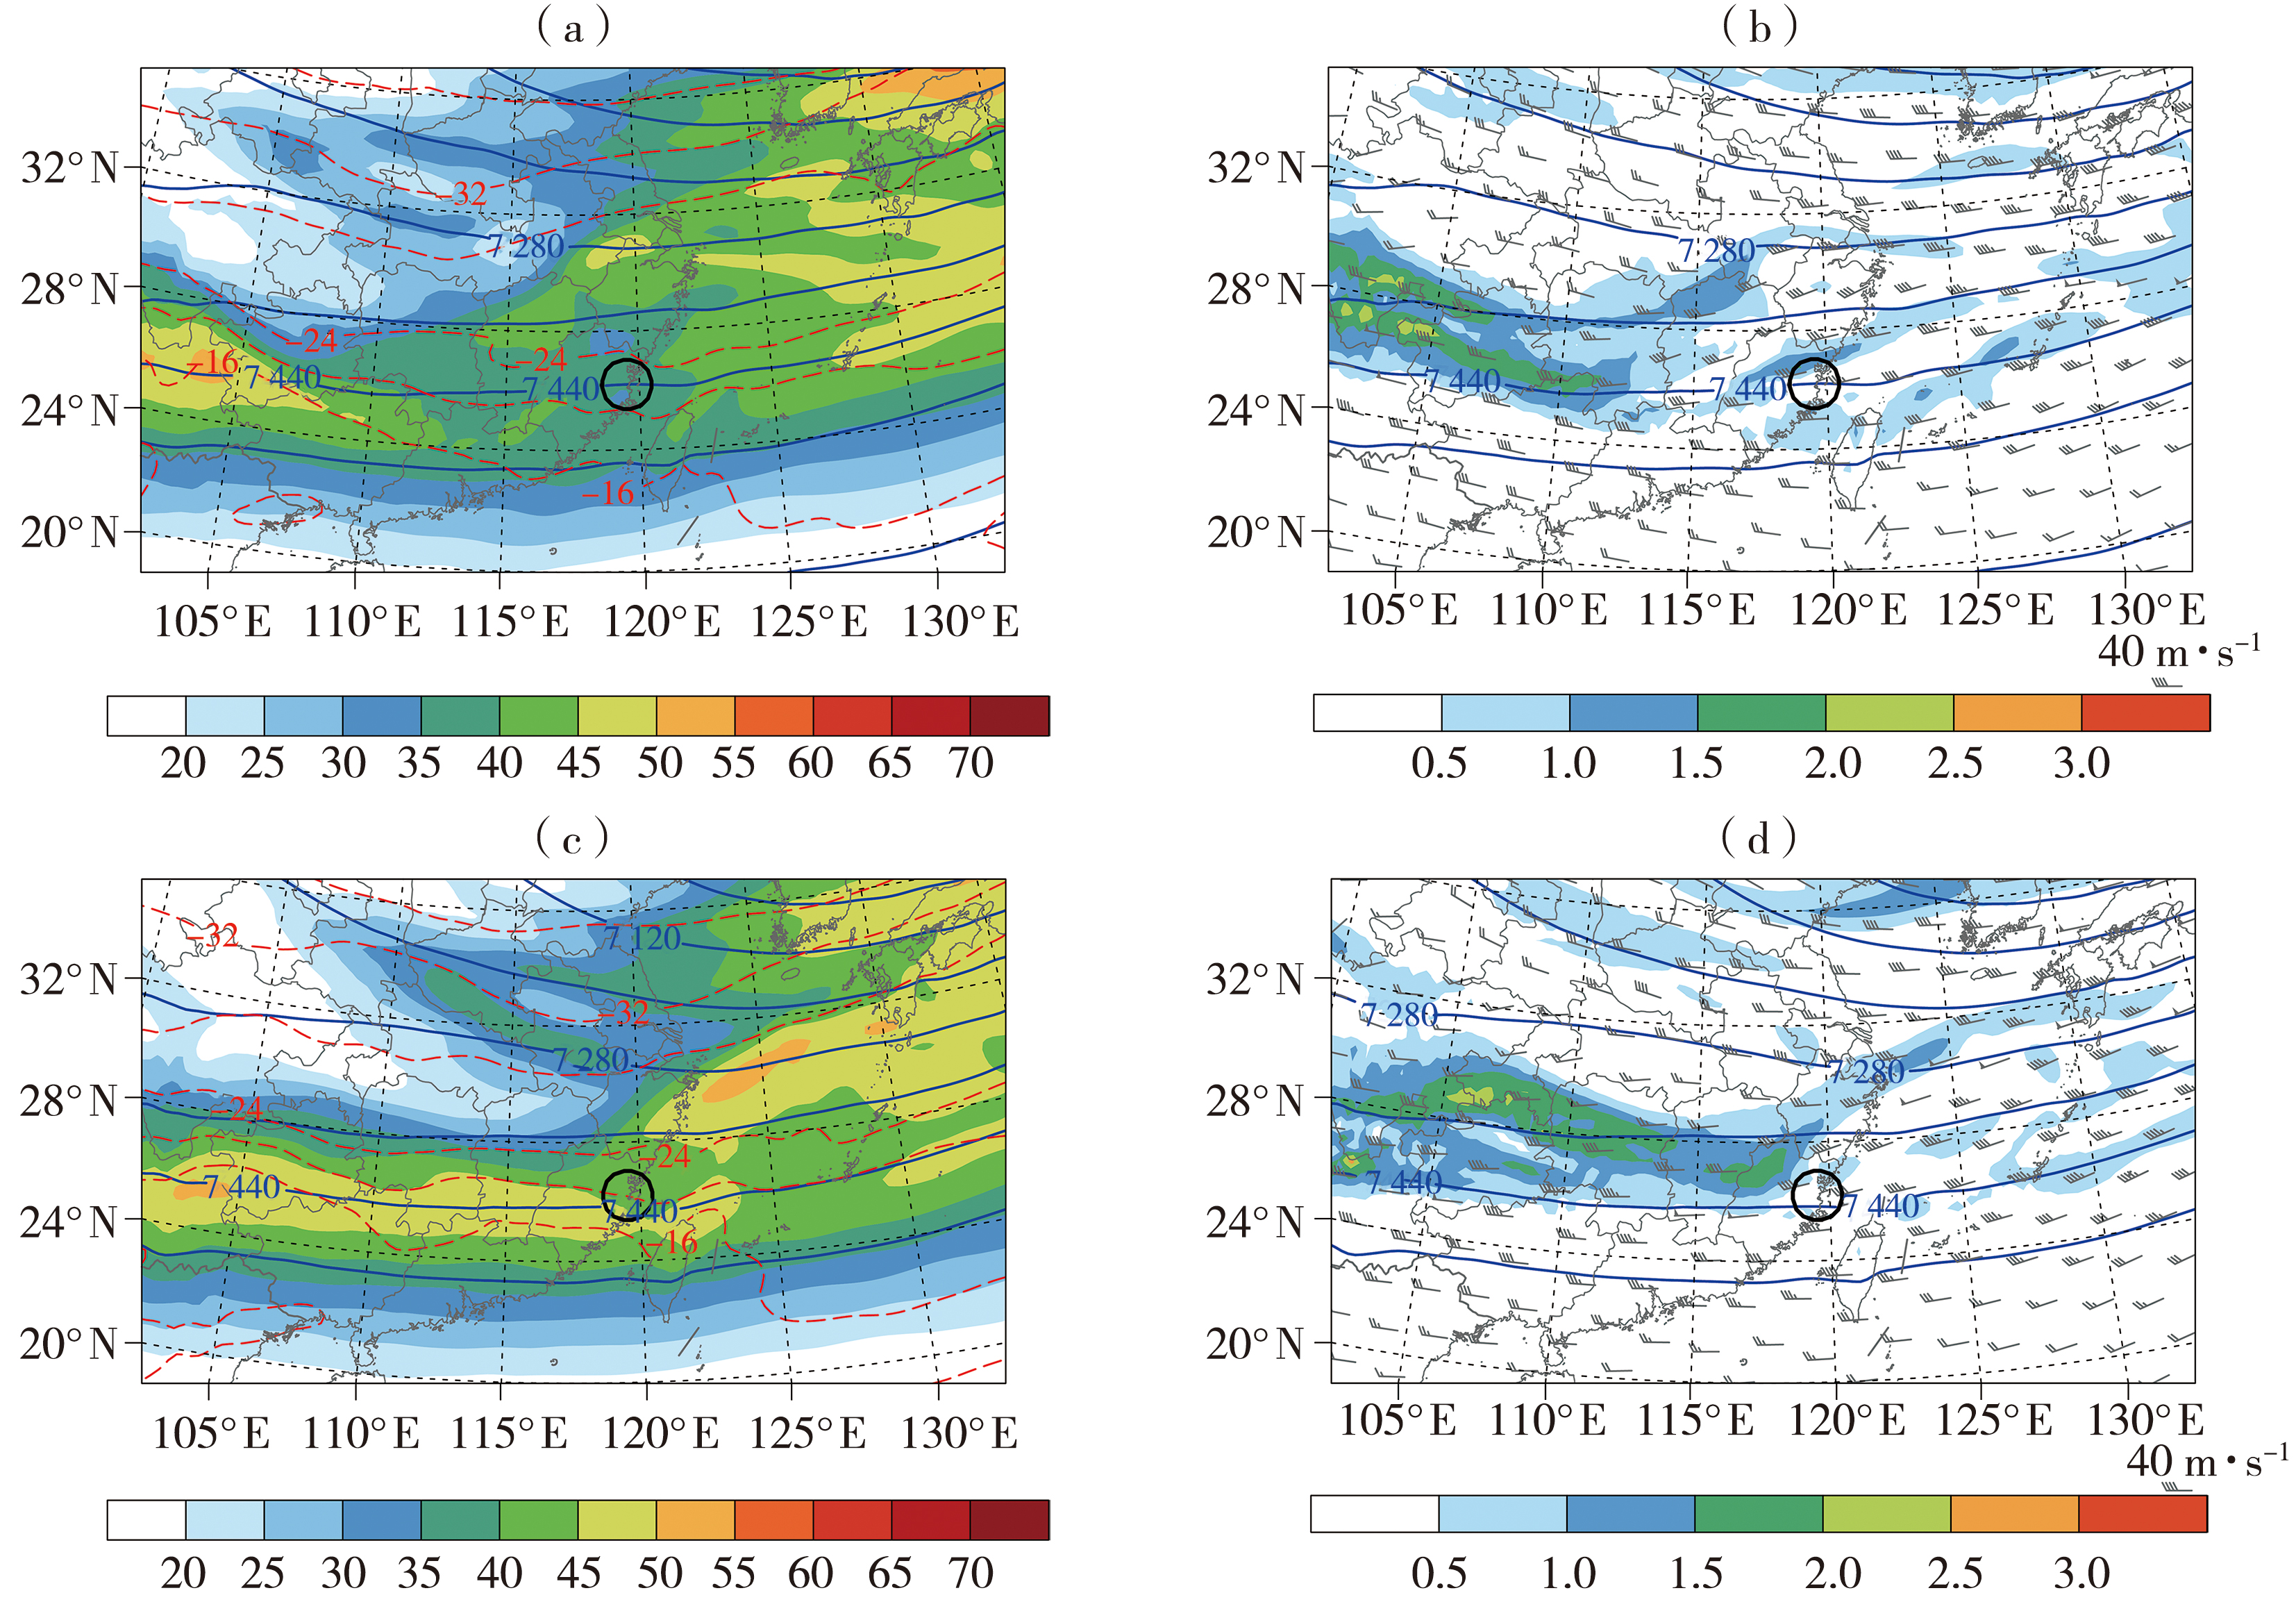
图3 2017年2月24日00:00(a、b)、06:00(c、d)400 hPa水平风速(填色,单位:m·s-1)、位势高度场(蓝色实线,单位:gpm)、温度场(红色虚线,单位:°C)(a、c)及对应的位涡场(填色,单位:PVU,1 PVU=10-6 K·kg-1·m2·s-1)、位势高度场(蓝色实线,单位:gpm)、水平风场(风矢,单位:m·s-1)(b,d)
(黑色圆圈表示湍流报告区域,下同)
|
Fig.3 The horizontal wind speed (the color shaded, Unit: m·s-1), geopotential height field (blue solid lines, Unit: gpm) and temperature field (red dashed lines, Unit: °C) at 400 hPa (a, c), and the corresponding distribution of potential vorticity field (the color shaded, Unit: PVU, 1 PVU=10-6 K·kg-1·m2·s-1), geopotential height field (blue solid lines, Unit: gpm) and horizontal wind field (wind vectors, Unit: m·s-1) (b, d) at 00:00 (a, b), 06:00 (c, d) on 24 February 2017
(The black circles indicate the location where aircraft turbulence occurred, the same as below)
|
|
|
|
|