2023年上半年我国干旱的特征及其成因分析
Analysis of the characteristics and causes of drought in China in the first half of 2023
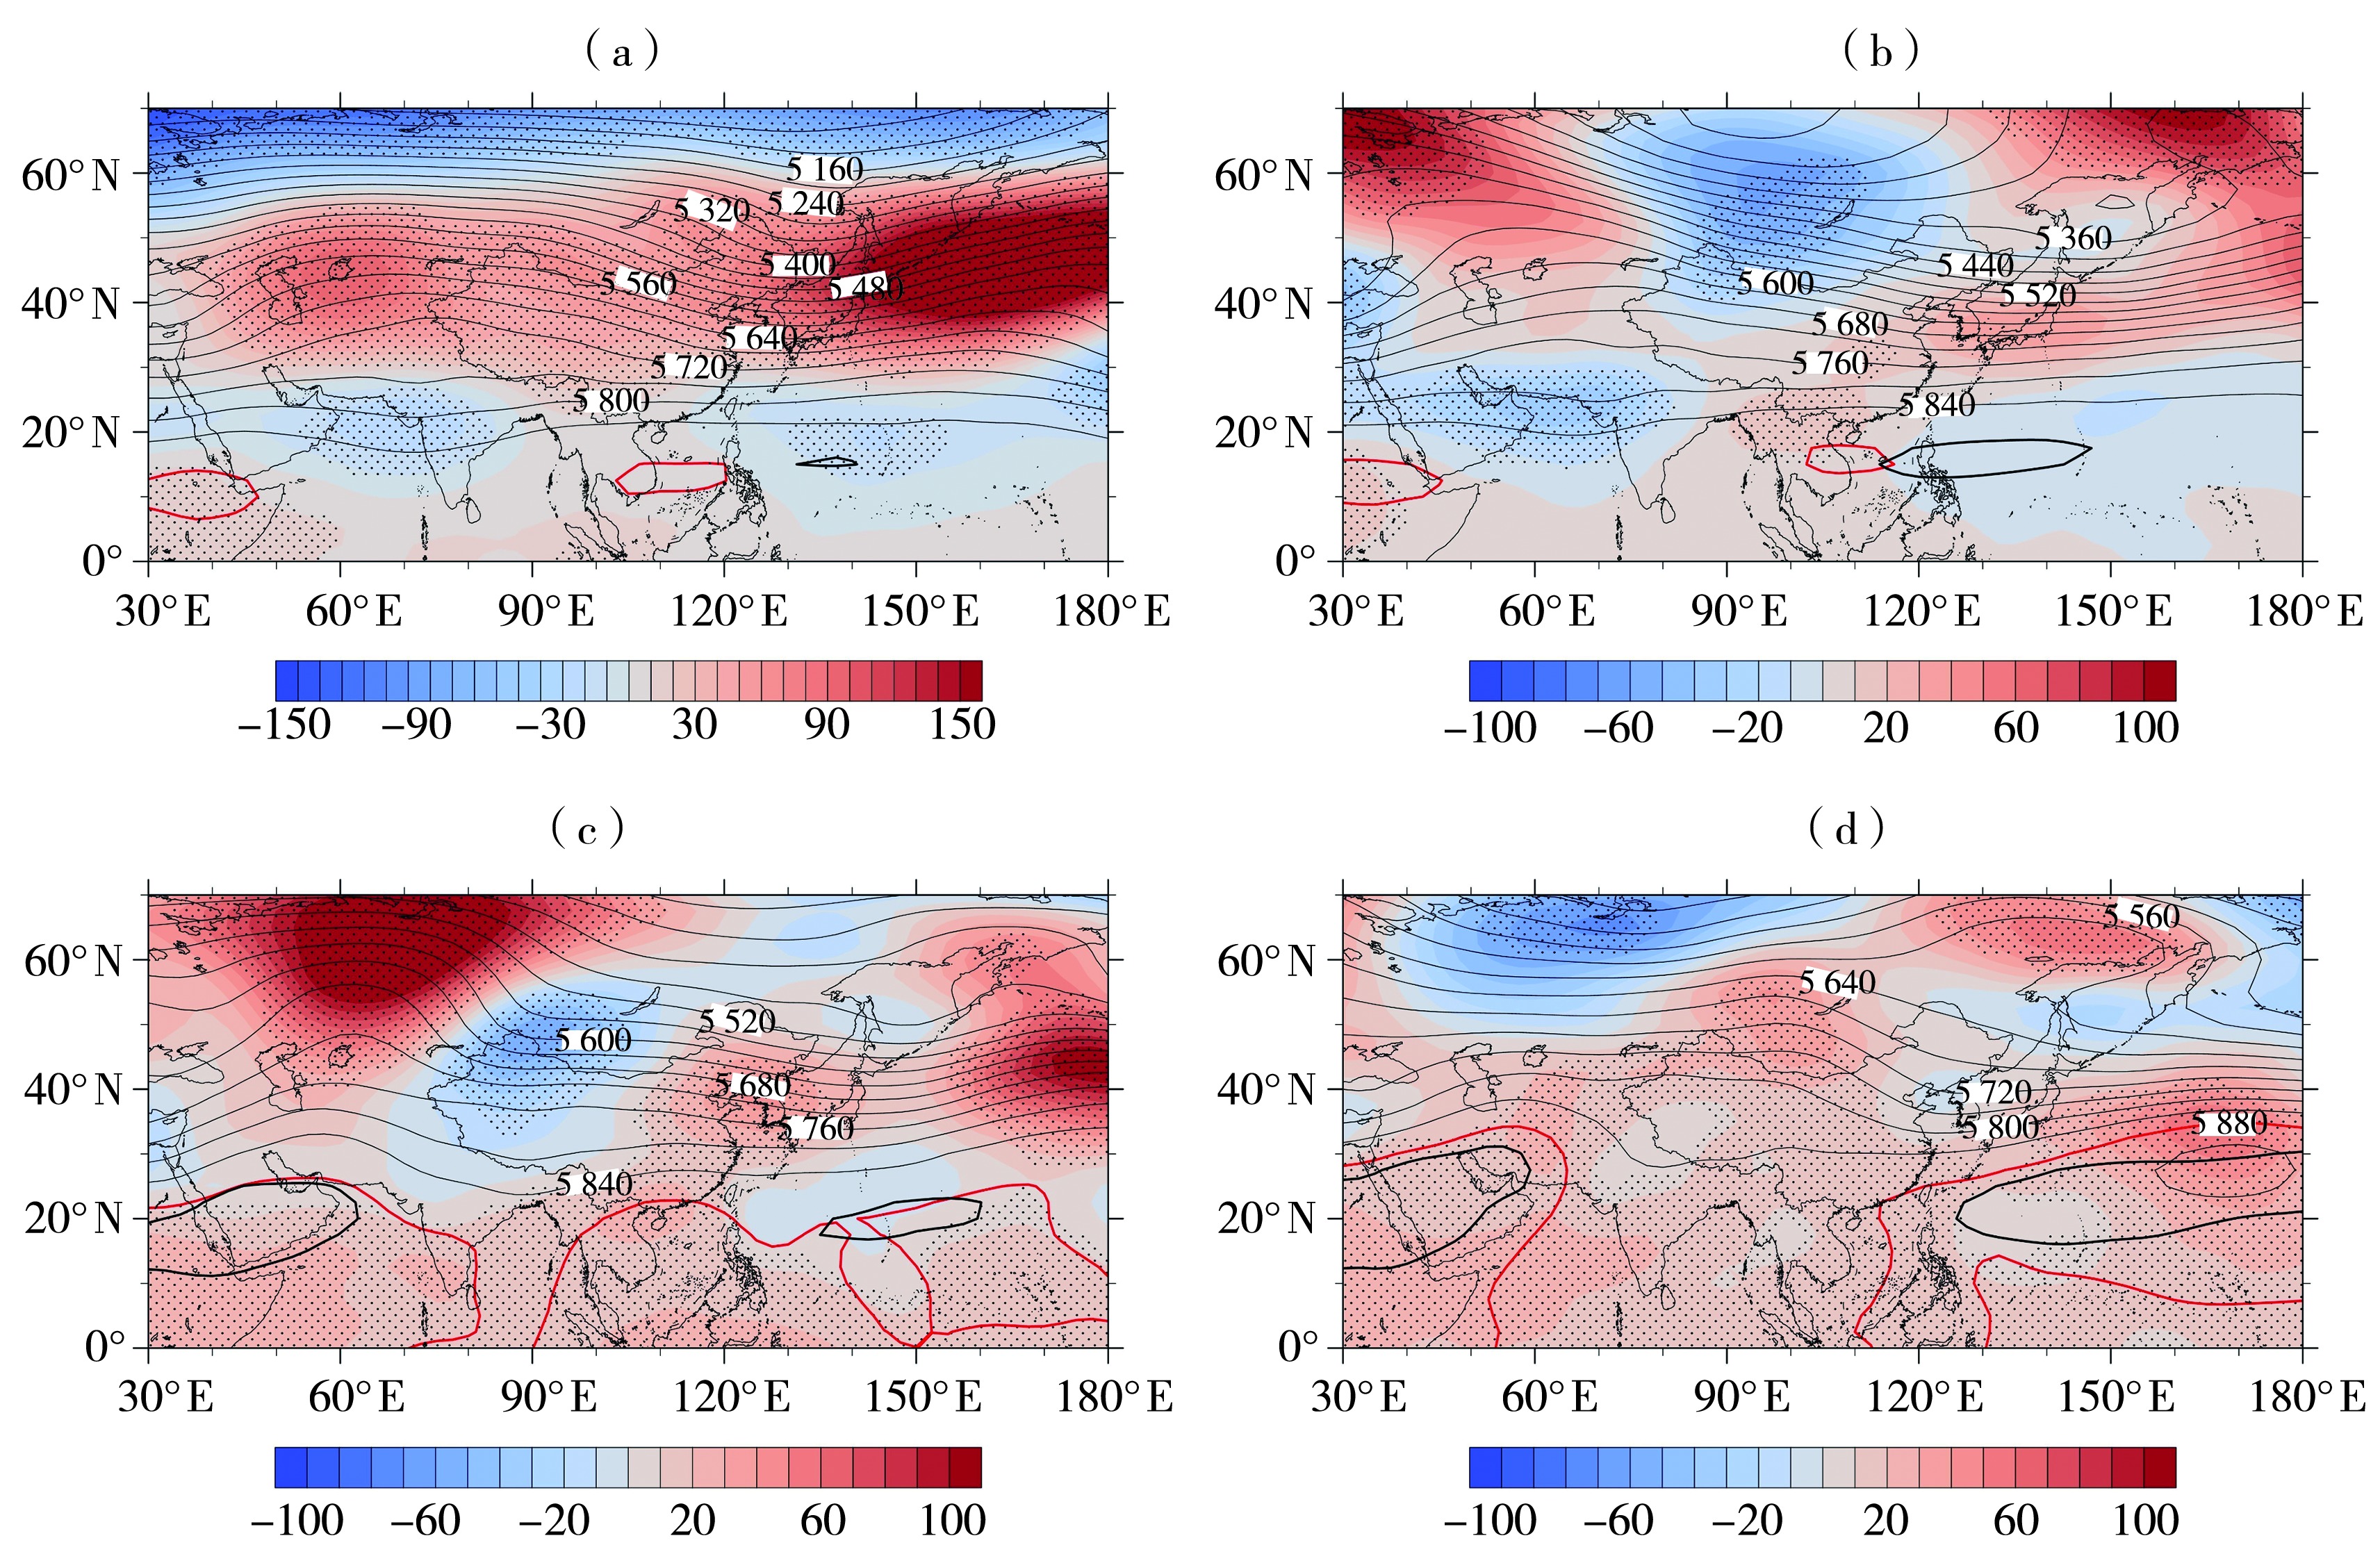
(红色实线为5 880 gpm等值线,黑色粗实线为1981—2010年气候态5 880 gpm等值线,黑色圆点为距平超过一倍标准差。)
(The red solid lines represent the 5 880 gpm contour lines, the black thick solid lines represent the 5 880 gpm contour lines for the climate state from 1981 to 2010, areas exceeding a standard deviation are covered with black dots)